Hello fellow traders. In this technical article we’re going to take a look at the Elliott Wave charts charts of Ethereum ETHUSD published in members area of the website. As our members know ETHUSD has recently made pull back that has unfolded as Elliott Wave Double Three Pattern. It made clear 7 swings from the March 11th peak and completed correction right at the Equal Legs zone( Blue Box Area) . In further text we’re going to explain the Elliott Wave pattern and forecast
Before we take a look at the real market example, let’s explain Elliott Wave Double Three pattern.
Elliott Wave Double Three Pattern
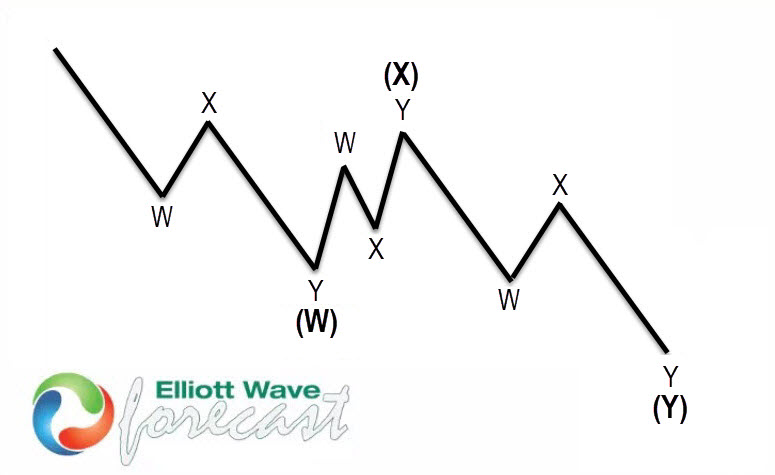
Double three is the common pattern in the market , also known as 7 swing structure. It’s a reliable pattern which is giving us good trading entries with clearly defined invalidation levels.
The picture below presents what Elliott Wave Double Three pattern looks like. It has (W),(X),(Y) labeling and 3,3,3 inner structure, which means all of these 3 legs are corrective sequences. Each (W) and (Y) are made of 3 swings , they’re having A,B,C structure in lower degree, or alternatively they can have W,X,Y labeling.
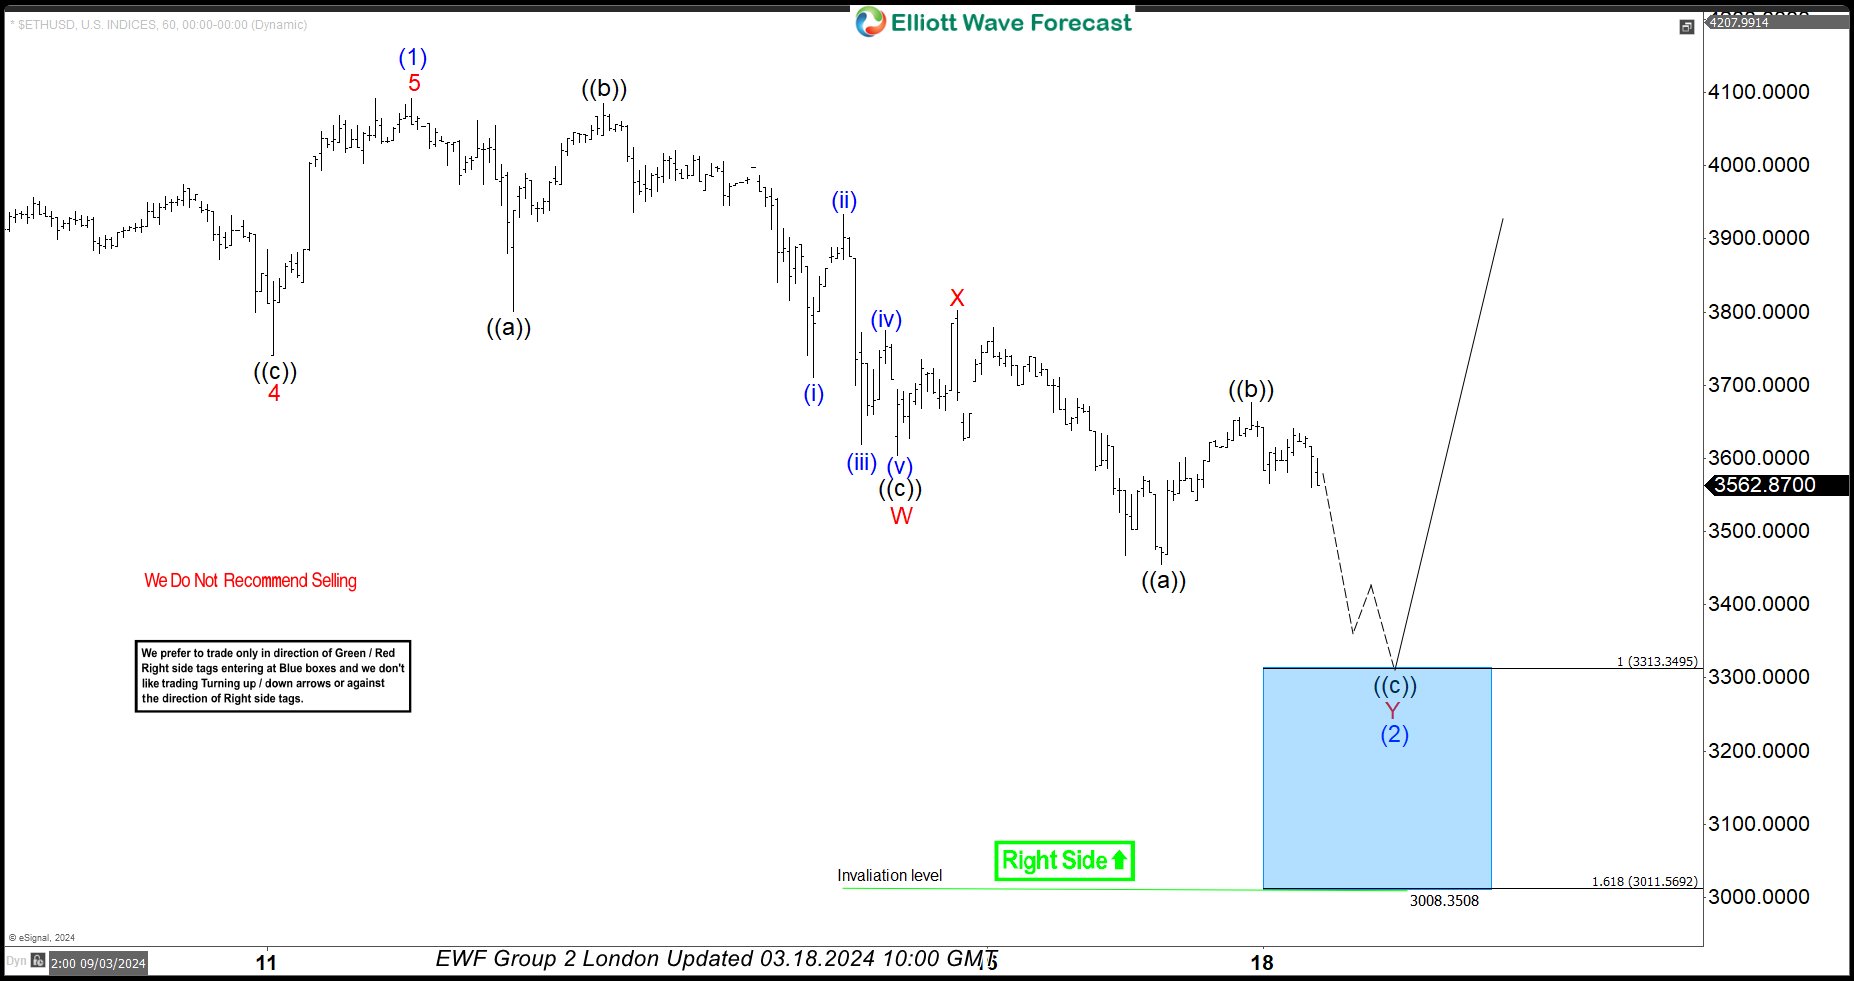
ETHUSD H1 Update 03.18.2024
ETHUSD is doing correction that is unfolding as a 7 swings pattern. Pull back has WXY red labeling. First leg W red shows clear 3 waves ((a))((b))(c)) black, after which we got 3 waves bounce in X red connector. Consequently we assume that pull back is unfolding as Double Three pattern, when we expect to see 3 waves in Y red as well. The structure is still incomplete at the moment. ETHUSD is showing lower low sequences from the March 11th peak. We expect to see another leg down toward extreme area: 3313.34-3011.56 ( buying zone). Once Ethereum reaches proposed extreme zone, we expect the crypto to make a rally toward new highs or in 3 waves bounce alternatively.
You can learn more about Elliott Wave Double Three Patterns at our Free Elliott Wave Educational Web Page.
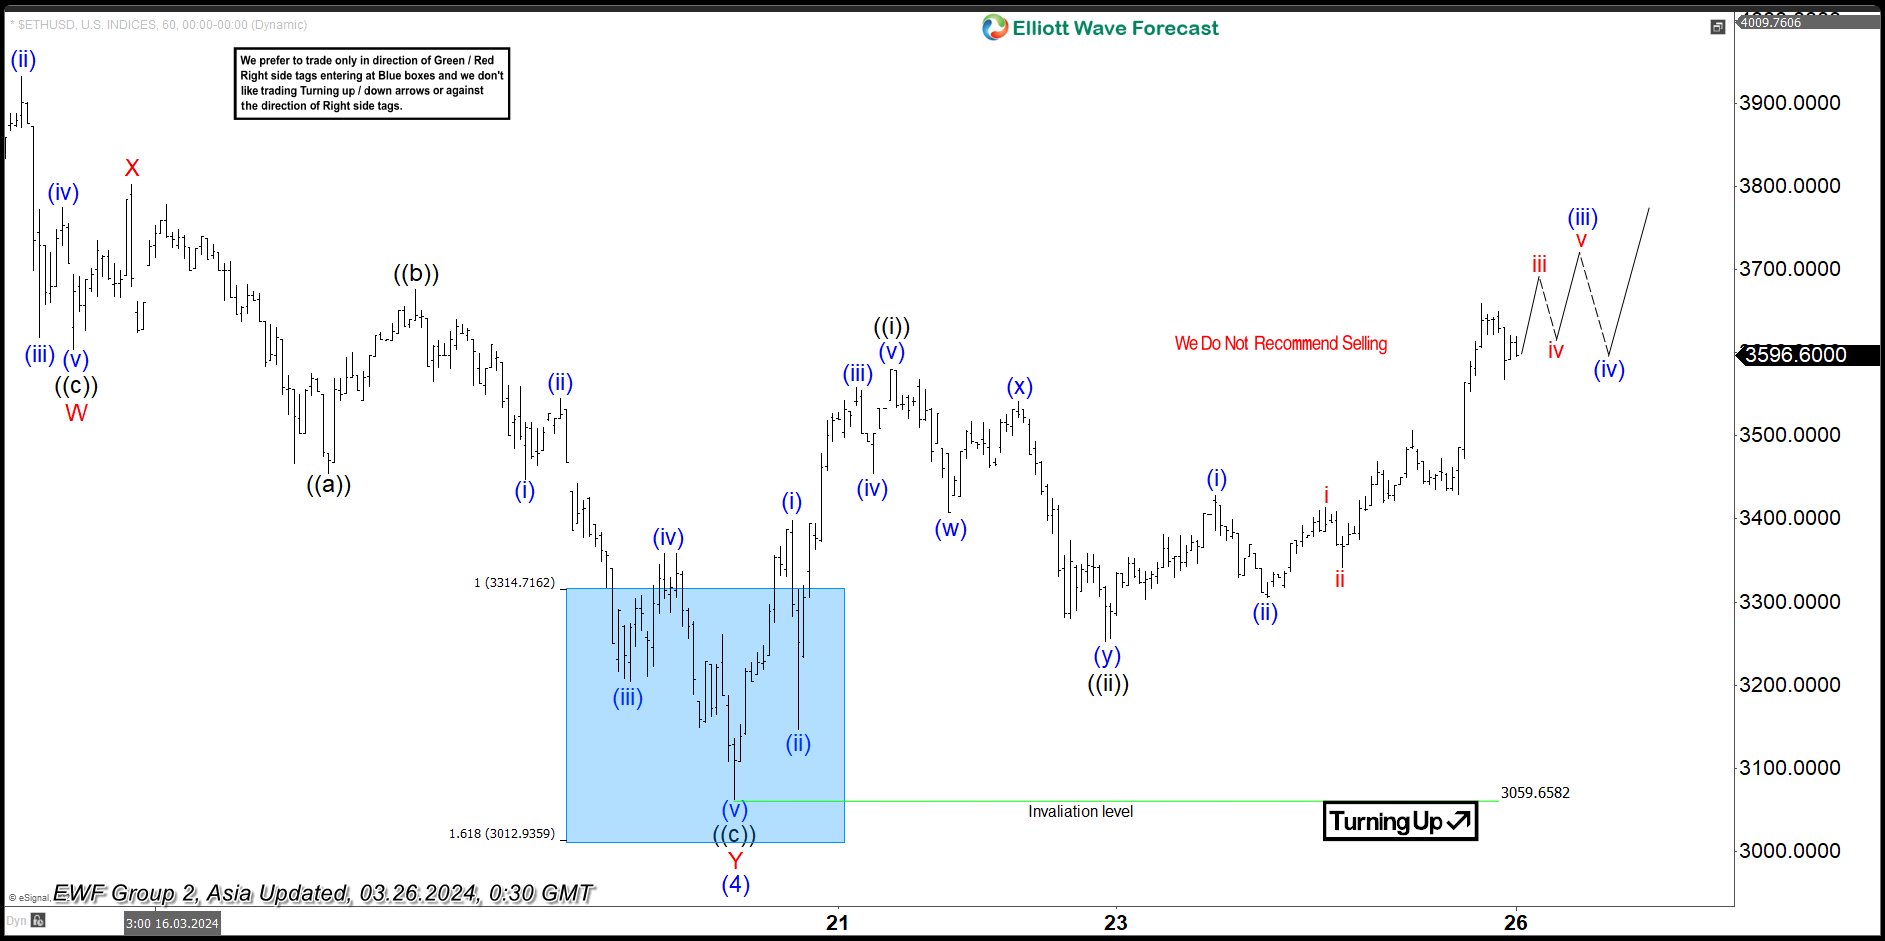
ETHUSD H1 Update 03.26.2024
Ethereum found buyers as expected. It made decent rally from the Blue Box. Bounce already reached 50 fibs against the X red connector which confirms cycle from the peak is done. Consequently, any long positions from the equal legs area are risk free by now and we have taken partial profits. We call wave (4) completed at the 3059.65low. Once ETHUSD make a break of March 11th peak, it will confirm next leg up is in progress.
Keep in mind not every chart is trading recommendation. You can check most recent charts and new trading setups in the membership area of the site. Best instruments to trade are those having incomplete bullish or bearish swings sequences. We put them in Sequence Report and best among them are shown in the Live Trading Room.