

In this technical article we’re going to take a look at the Elliott Wave charts charts of Bitcoin BTCUSD published in members area of the website. As our members know, we generally favor the long side in BTCUSD, and it has recently offered good trading opportunities. However, BTCUSD is currently correcting the cycle from the August low and is not ready for buying at this stage. Recently, we observed a recovery against the 108364 high, which unfolded as an Irregular Flat pattern. Once this flat correction was completed, the crypto declined as anticipated.
Before we take a look at the real market example of Expanded Flat, let’s explain the pattern in a few words.
Understanding the Expanded Flat Pattern
Elliott Wave Flat is a 3 wave corrective pattern which could often be seen in the market nowadays. Inner subdivision is labeled as A,B,C , with inner 3,3,5 structure. Waves A and B have forms of corrective structures like zigzag, flat, double three or triple three. Third wave C is always 5 waves structure, either motive impulse or ending diagonal pattern. It’s important to notice that in Irregular Flat Pattern wave B completes below the starting point of wave A. Wave C ends above the ending point of wave A . Wave C of Flat completes usually between 1.00 to 1.236 Fibonacci extension of A related to B, but sometimes it could go up to 1.618 fibs ext.
At the graphic below, we can see what Expanded Flat structure looks like
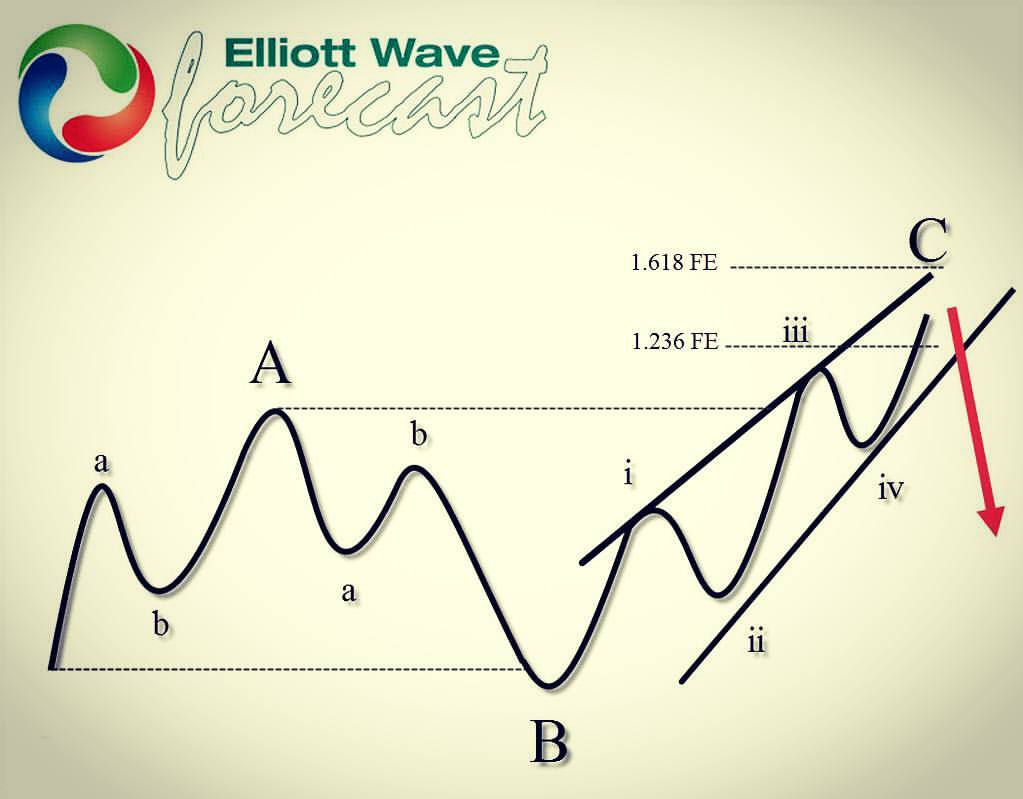
Visual Guide: Expanded Flat Correction Pattern in Elliott Wave Theory
Now, let’s take a look what Elliott Wave Flat Pattern looks like in the real market
Bitcoin BTCUSD 1h Hour Elliott Wave Analysis 01.05.2025
Currently, BTCUSD is correcting the cycle from the 108364 high. The Elliott Wave view suggests that the recovery is unfolding as an Irregular Flat Pattern. When we analyze the lower time frames, we can observe that the inner subdivisions of waves A and B (red) exhibit corrective sequences. Wave B has already broken below the starting point of wave A, while wave C is expected to break above the point of wave A, which is characteristic of an Irregular Flat pattern. At this stage, we see that the C leg is still missing another wave up to complete its structure as a 5-wave move. We recommend our members avoid buying at this stage.

BTCUSD Wave Count: Irregular Flat Correction in Progress
Bitcoin BTCUSD 1h Hour Elliott Wave Analysis 01.09.2025
Bitcoin made another leg up in wave ((v)) of C, completing the (X) blue recovery at the 102730 high. As anticipated, the crypto turned lower. We are now looking for a break below wave B (red) to confirm that the next leg down is in progress. At this stage, we do not favor selling and would prefer to wait for the (Y) leg to reach the extreme area before considering buying BTC again.
Keep in mind that market is dynamic and presented view could have changed in the mean time. You can check most recent charts in the membership area of the site. Best instruments to trade are those having incomplete bullish or bearish swings sequences. For additional information on the best trading strategies for Bitcoin, visit our Live Trading Room and stay updated with the latest insights in our 24H Chat Room.

BTCUSD Update: Completed Correction and Next Potential Move
Elliott Wave Forecast Membership
Trade with a clear plan — not guesswork.
At Elliott Wave Forecast, our team of professional analysts monitors 78 instruments across global markets every day, helping members identify high-probability opportunities and manage risk through a structured, rules-based trading process.
Inside your membership, you’ll receive:
✅ Real-Time Trading Recommendations — with clearly defined Entry, Stop Loss, and Take Profit levels for each setup.
✅ Live Trading Room Access — follow professional trade setups as they develop in real time.
✅ 24-Hour Chat Room Support — ask unlimited questions and receive guidance from experienced analysts throughout the trading week.
✅ Expert Multi-Market Analysis — covering Forex, Stocks, Indices, ETFs, Commodities, and Cryptocurrencies.
✅ Exclusive Educational Videos — included at no additional cost, with practical lessons on Elliott Wave theory, trading strategies, risk management, and trade execution.
✅ Learn the Process Behind Every Setup — understand how experienced analysts identify opportunities, define risk, and manage trades as market conditions evolve.
Ready to see how the process works in real market conditions?
Regular 14-Day Trial: $9.99
Limited-Time Price: Only $0.99
👉 Start Your 14-Day Trial for Only $0.99


