Hello fellow traders. In this article we’re going to take a quick look at the Elliott Wave charts of Bitcoin BTCUSD published in members area of the website. BTCUSD is showing impulsive bullish sequences in the cycles from the 74,799 low, that are calling for a further strength. Recently we got a pull back that has reached the Blue Box zone,our buying area. In the following text, we will explain the Elliott Wave trading setup, including the target areas.
BTCUSD Elliott Wave 1 Hour Chart 06.22.2025
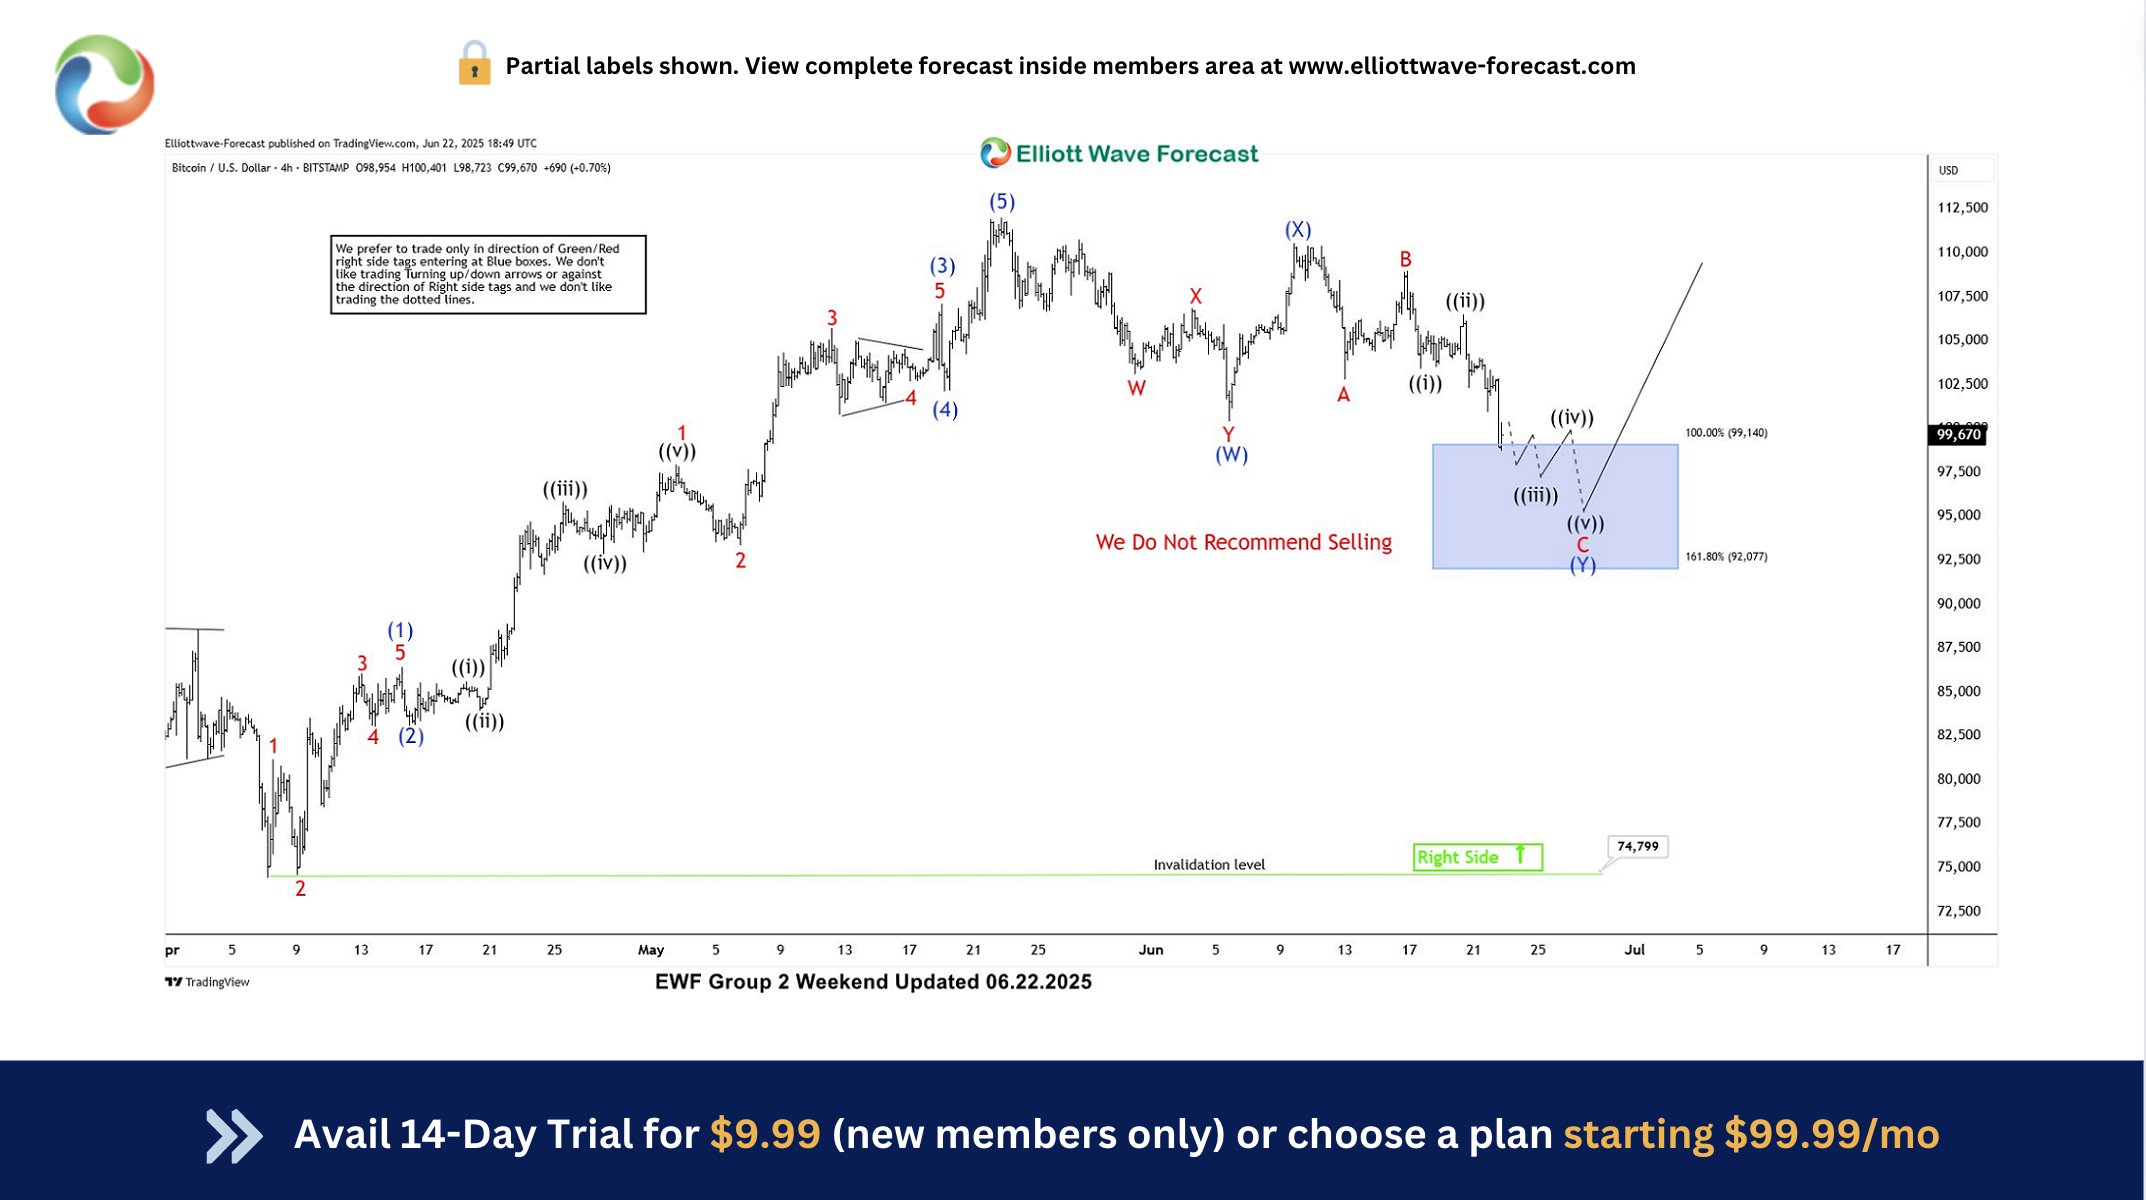
BTCUSD is showing impulsive bullish sequences. The current Elliott Wave count suggests that a pullback is in progress as a Double Three structure. The price is reaching our buying zone at 99,140–92,077 (Blue Box).
Since the main trend is bullish, we expect to see at least a 3-wave bounce from the buying zone. This setup could ideally lead to a rally toward new highs. We advise against selling and prefer the long side from the marked Blue Box (buying zone).
On the other hand, a break below the 1.618 Fibonacci extension level at 92,077 would invalidate the trade.
Official trading strategy on How to trade 3, 7, or 11 swing and equal leg is explained in details in Educational Video, available for members viewing inside the membership area.
BTCUSD Elliott Wave 4 Hour Chart 06.26.2025
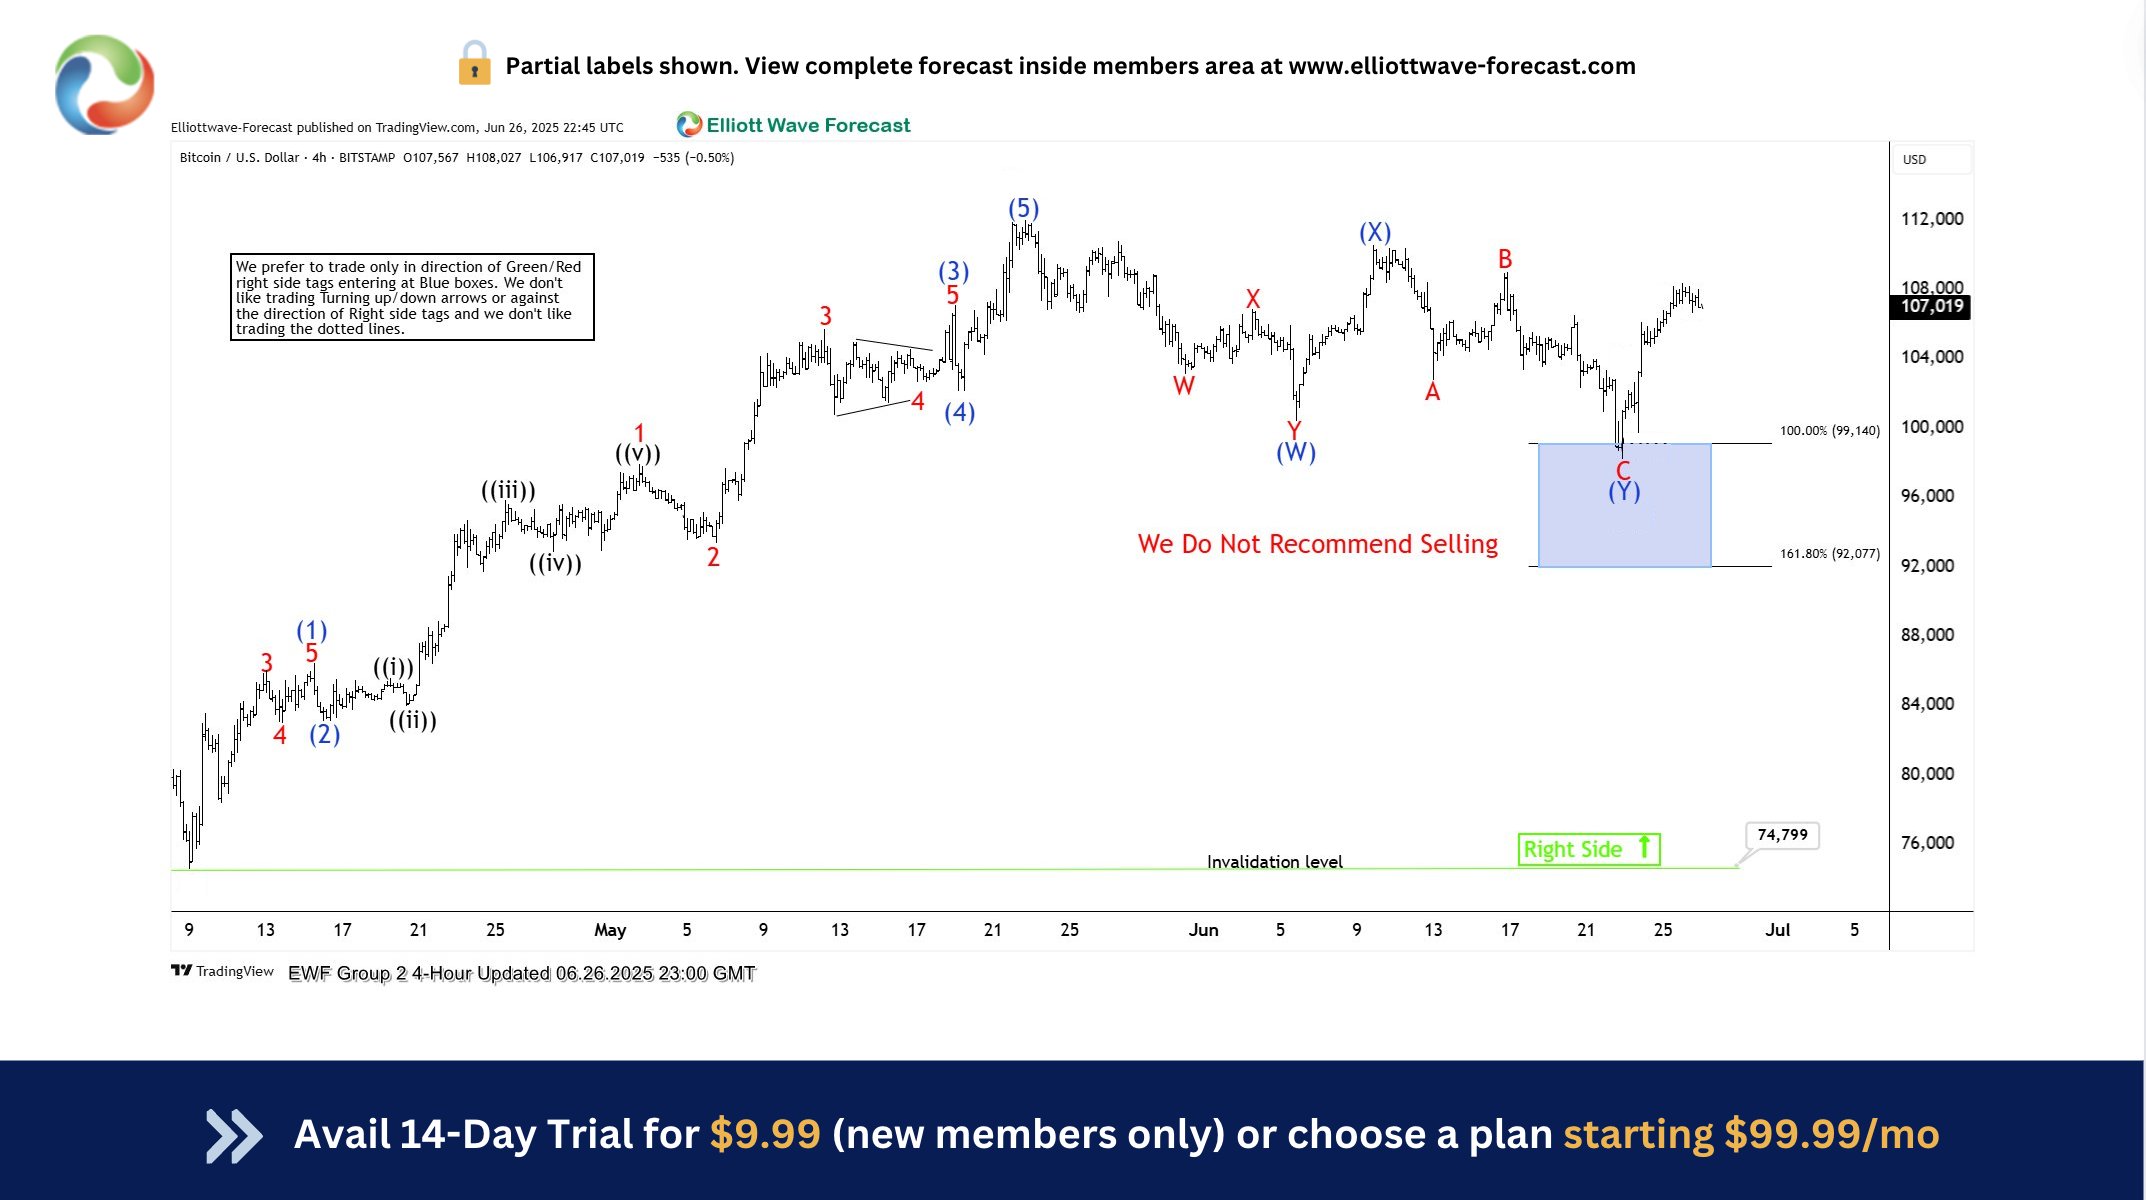
BTCUSD found buyers at the Blue Box Area: 99,140-92,077 as expected, and we got a good reaction from there. Pull back completed as Elliott Wave Double Three pattern. With the price holding above the 98,357 low, we expect further strength to follow.
90% of traders fail because they don’t understand market patterns. Are you in the top 10%? Test yourself with this advanced Elliott Wave Test
Reminder for members: Our chat rooms in the membership area are available 24 hours a day, providing expert insights on market trends and Elliott Wave analysis. Don’t hesitate to reach out with any questions about the market, Elliott Wave patterns, or technical analysis. We’re here to help.