In this technical blog, we will look at the past performance of the 1-hour Elliott Wave Charts of IBEX. We presented to members at the elliottwave-forecast. In which, the rally from the 07 April 2025 low is unfolding as an impulse structure. Also showed a higher high sequence suggested that index should see more upside extension to complete the impulse sequence. Therefore, we advised members not to sell the index & buy the dips in 3, 7, or 11 swings at the blue box areas. We will explain the structure & forecast below:
IBEX 1-Hour Elliott Wave Chart From 2.13.2026
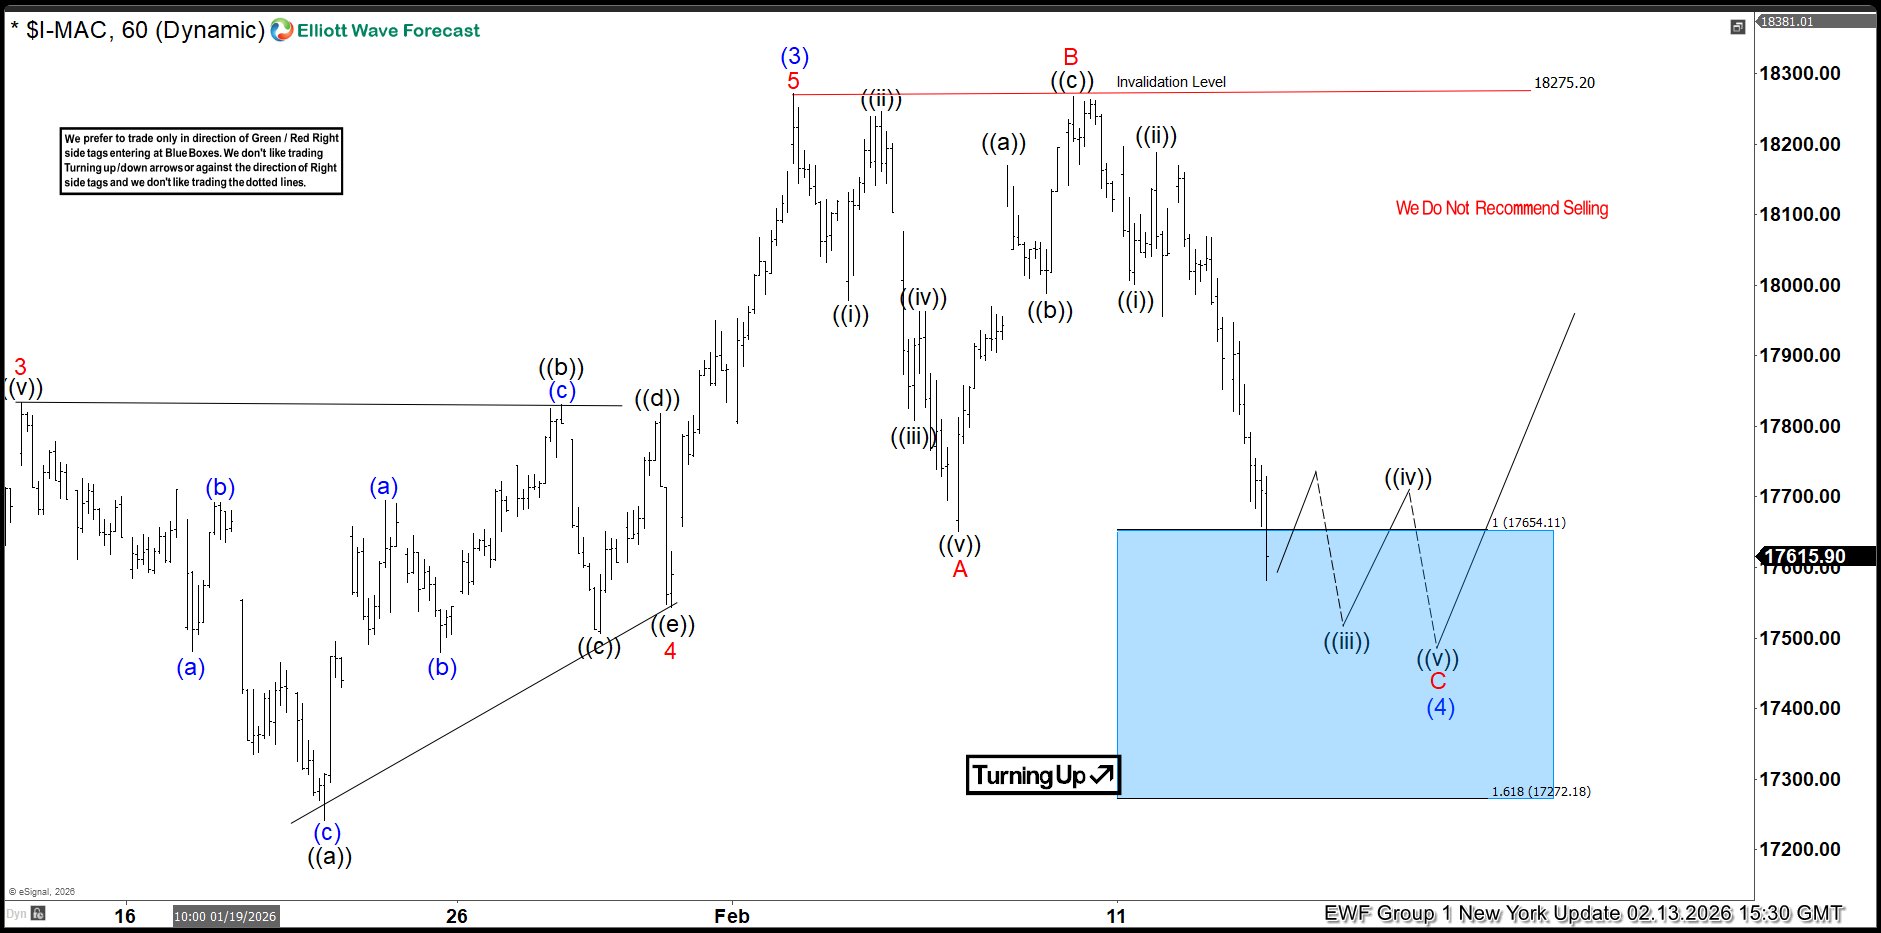
Here’s the 1-hour Elliott wave chart from the 2.13.2026 New York update. In which, the short-term cycle from the 11.21.2025 low ended in wave (3) as impulse at 18275.20 high. Down from there, the IBEX made a pullback in wave (4) to correct that cycle. The internals of that pullback unfolded as Elliott wave zigzag structure where wave A ended at 17650.80 low. Wave B bounce ended at 18267.30 high. Then wave C managed to reach the blue box area at 17654.11- 17272.18. From there, buyers were expected to appear looking for the next leg higher or for a 3 wave bounce minimum.
IBEX Latest 1-Hour Elliott Wave Chart From 2.20.2026
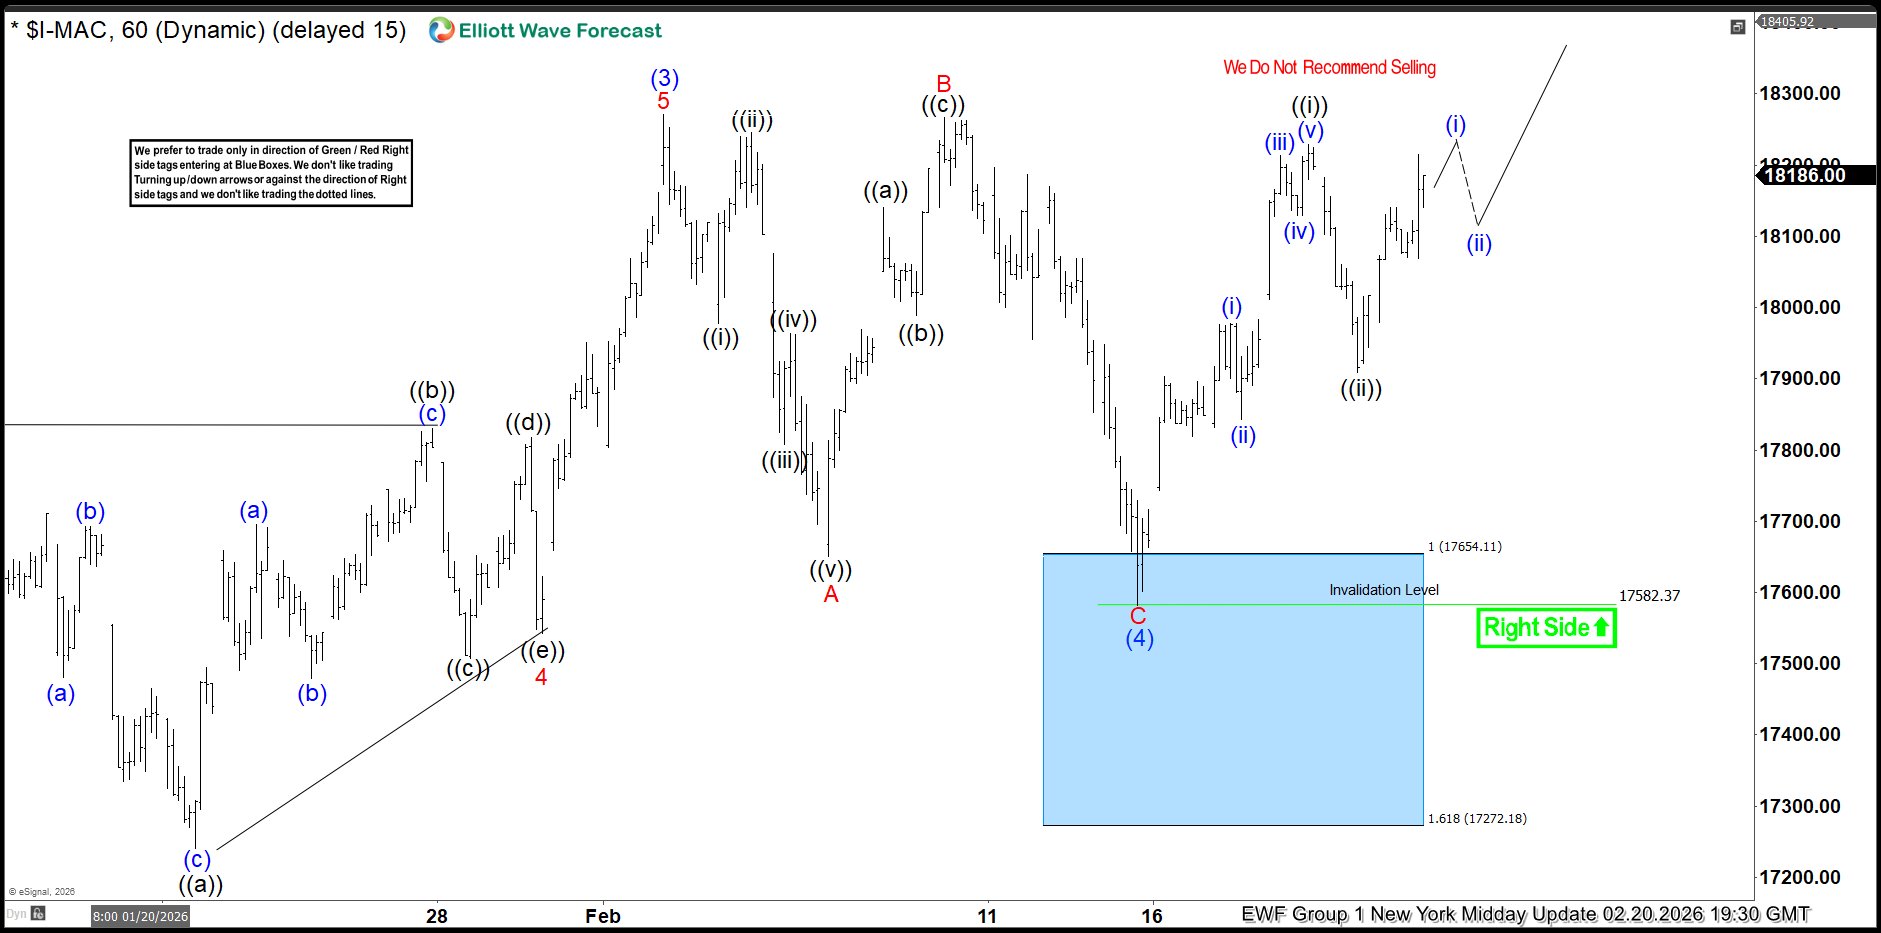
This is the 1-hour Elliott wave Chart from the 2.20.2026 NY Midday update. In which the index is showing a reaction higher taking place, right after ending the correction within the blue box area. Allowed members to create a risk-free position shortly after taking the long position at the blue box area. Since then, IBEX has already made a new high targeting 18433.67- 18696.81 area higher minimum before profit taking & next pullback takes place in 3, 7 or 11 swings.
If you are looking for real-time analysis in IBEX along with the other indices & stocks then join us with a 14-Day Trial for the latest updates & price action.
Success in trading requires proper risk and money management as well as an understanding of Elliott Wave theory, cycle analysis, and correlation. We have developed a very good trading strategy that defines the entry.
Stop loss and take profit levels with high accuracy and allow you to take a risk-free position, shortly after taking it by protecting your wallet. If you want to learn all about it and become a professional trader. Then join our service by taking a Trial.
