
-
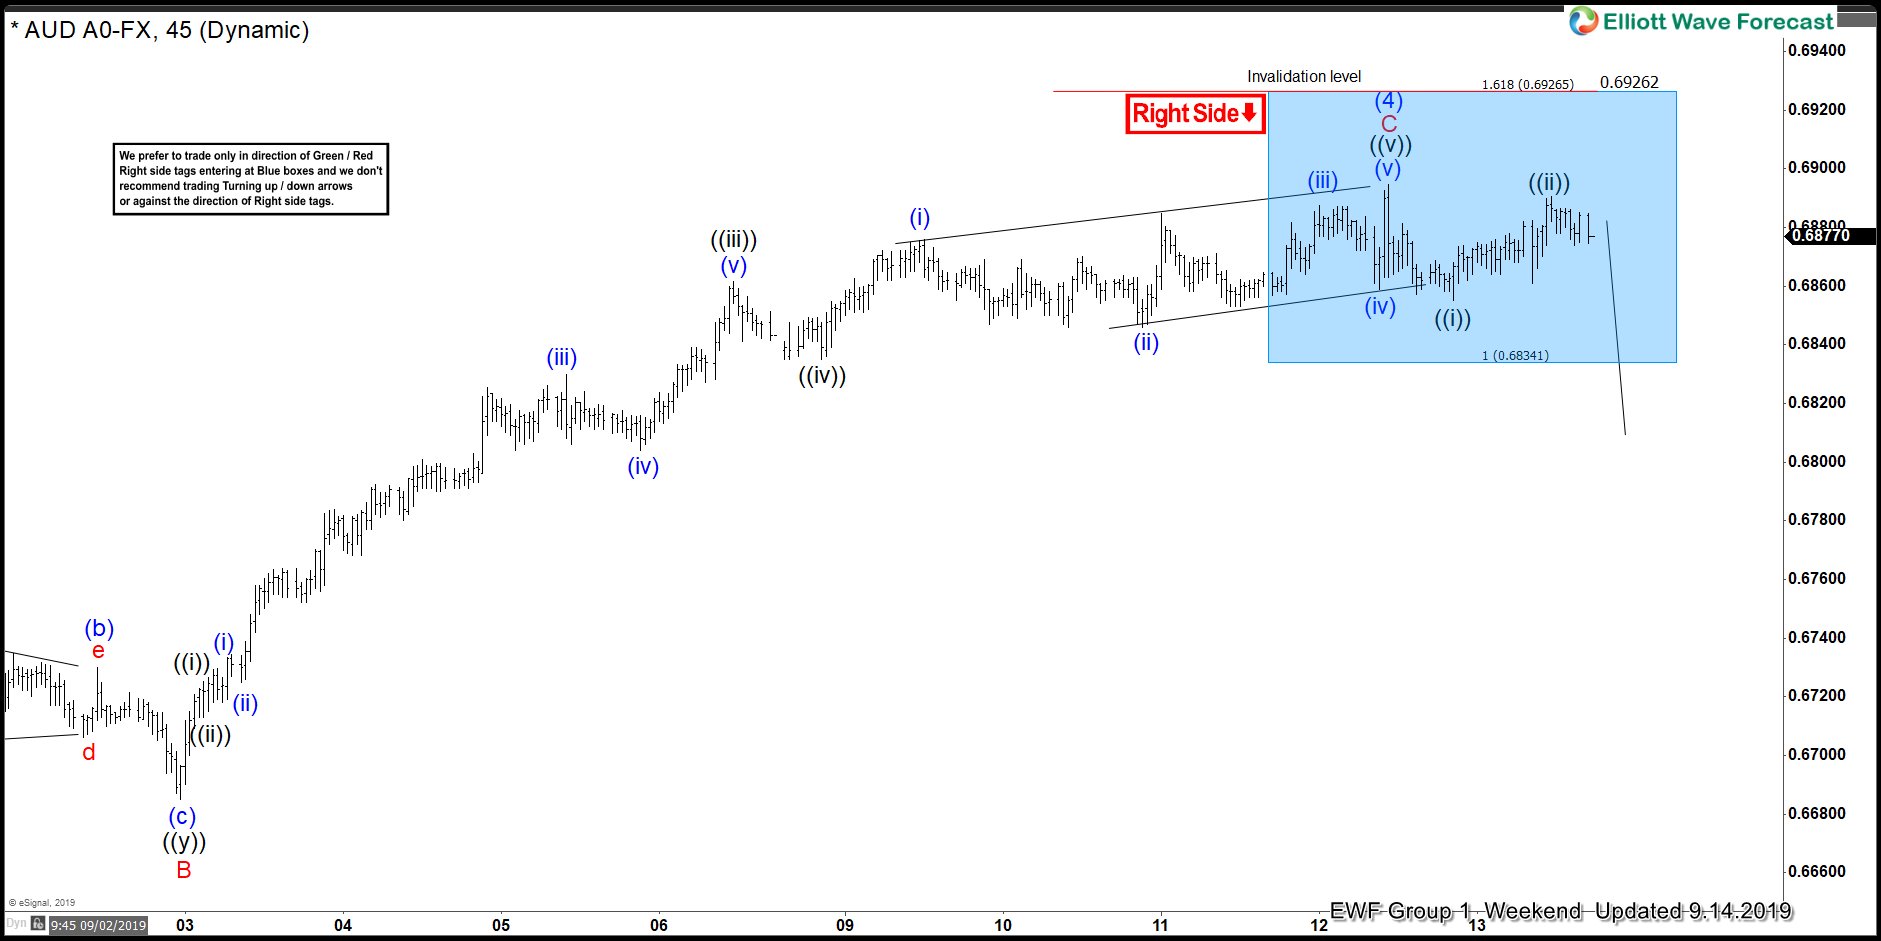
AUDUSD Found Sellers At The Blue Box
Read MoreIn this technical blog we’re going to take a quick look at the Elliott Wave charts of AUDUSD, published in members area of the website. As our members know, AUDUSD is showing incomplete bearish sequences in the Daily cycle. Besides that, the pair has incomplete bearish sequences in the cycle from the 0.7299 (January 31st) […]
-
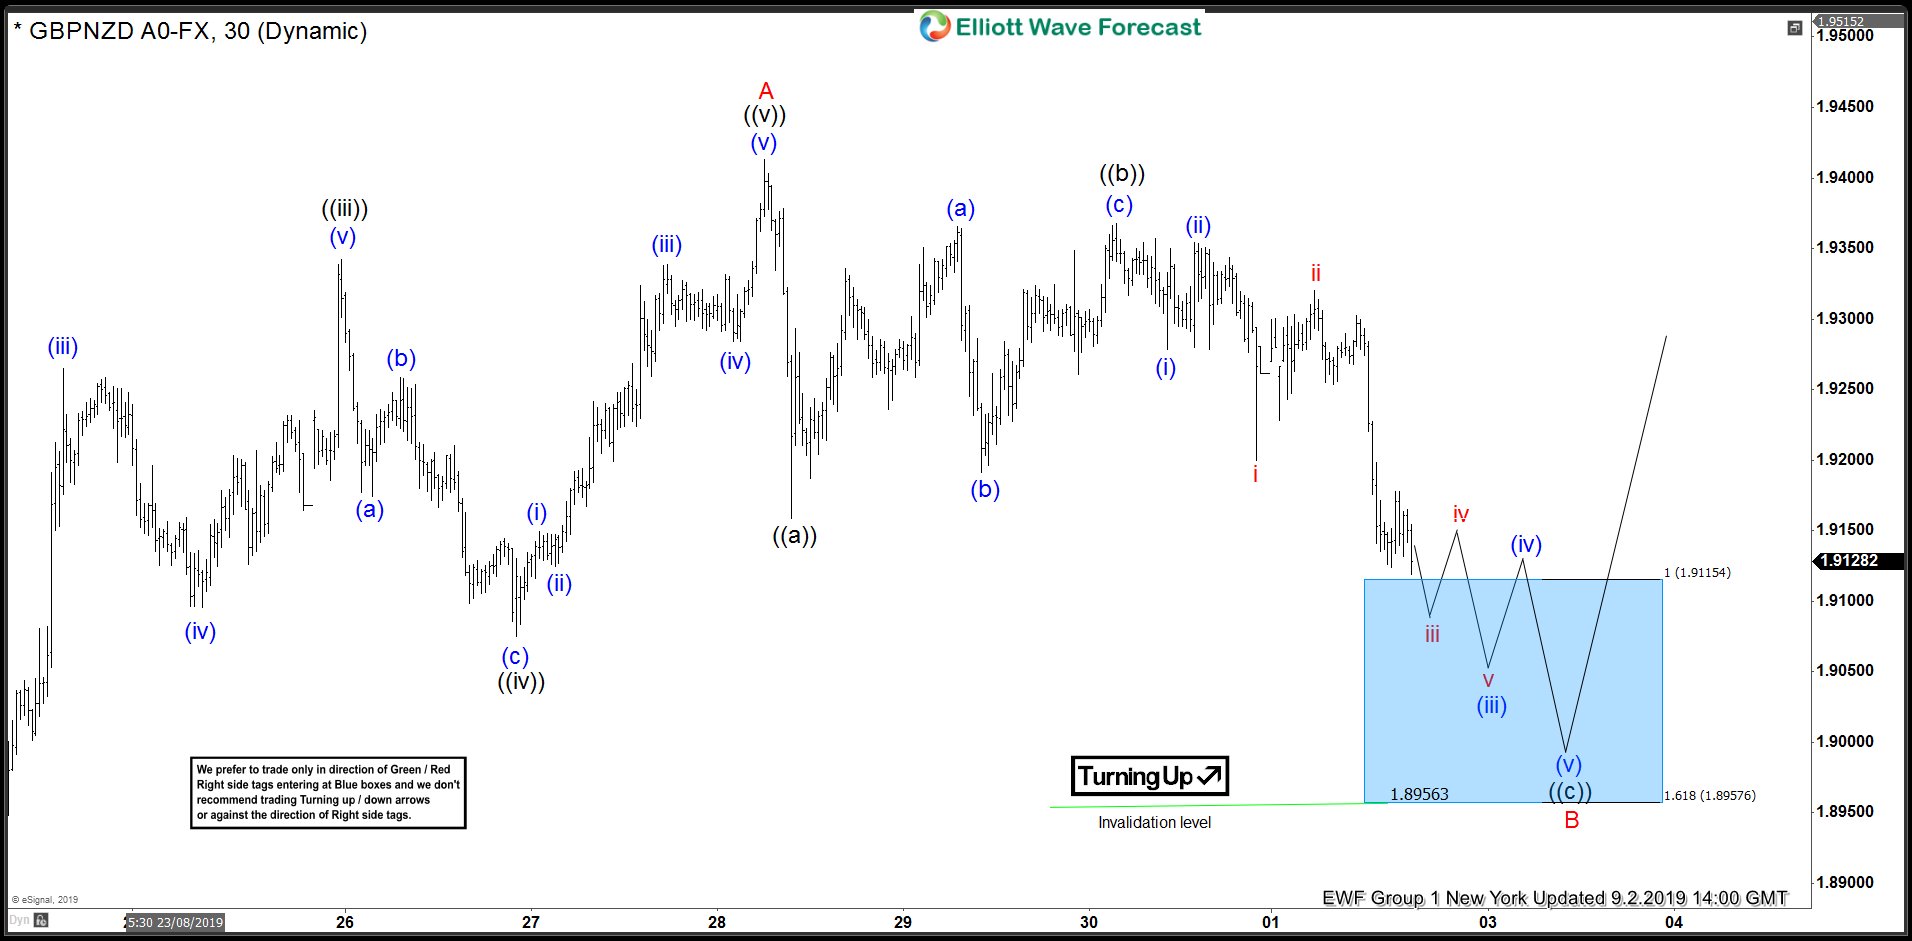
GBPNZD Forecasting The Rally After Elliott Wave Zig Zag Pattern
Read MoreHello fellow traders. In this technical blog we’re going to take a quick look at the Elliott Wave charts of GBPNZD, published in members. As our members know, GBPNZD recently corrected cycle from the 07/30 low. Pull back has unfolded as Elliott Wave ZIG ZAG pattern. After the pull back completed we got expected rally […]
-
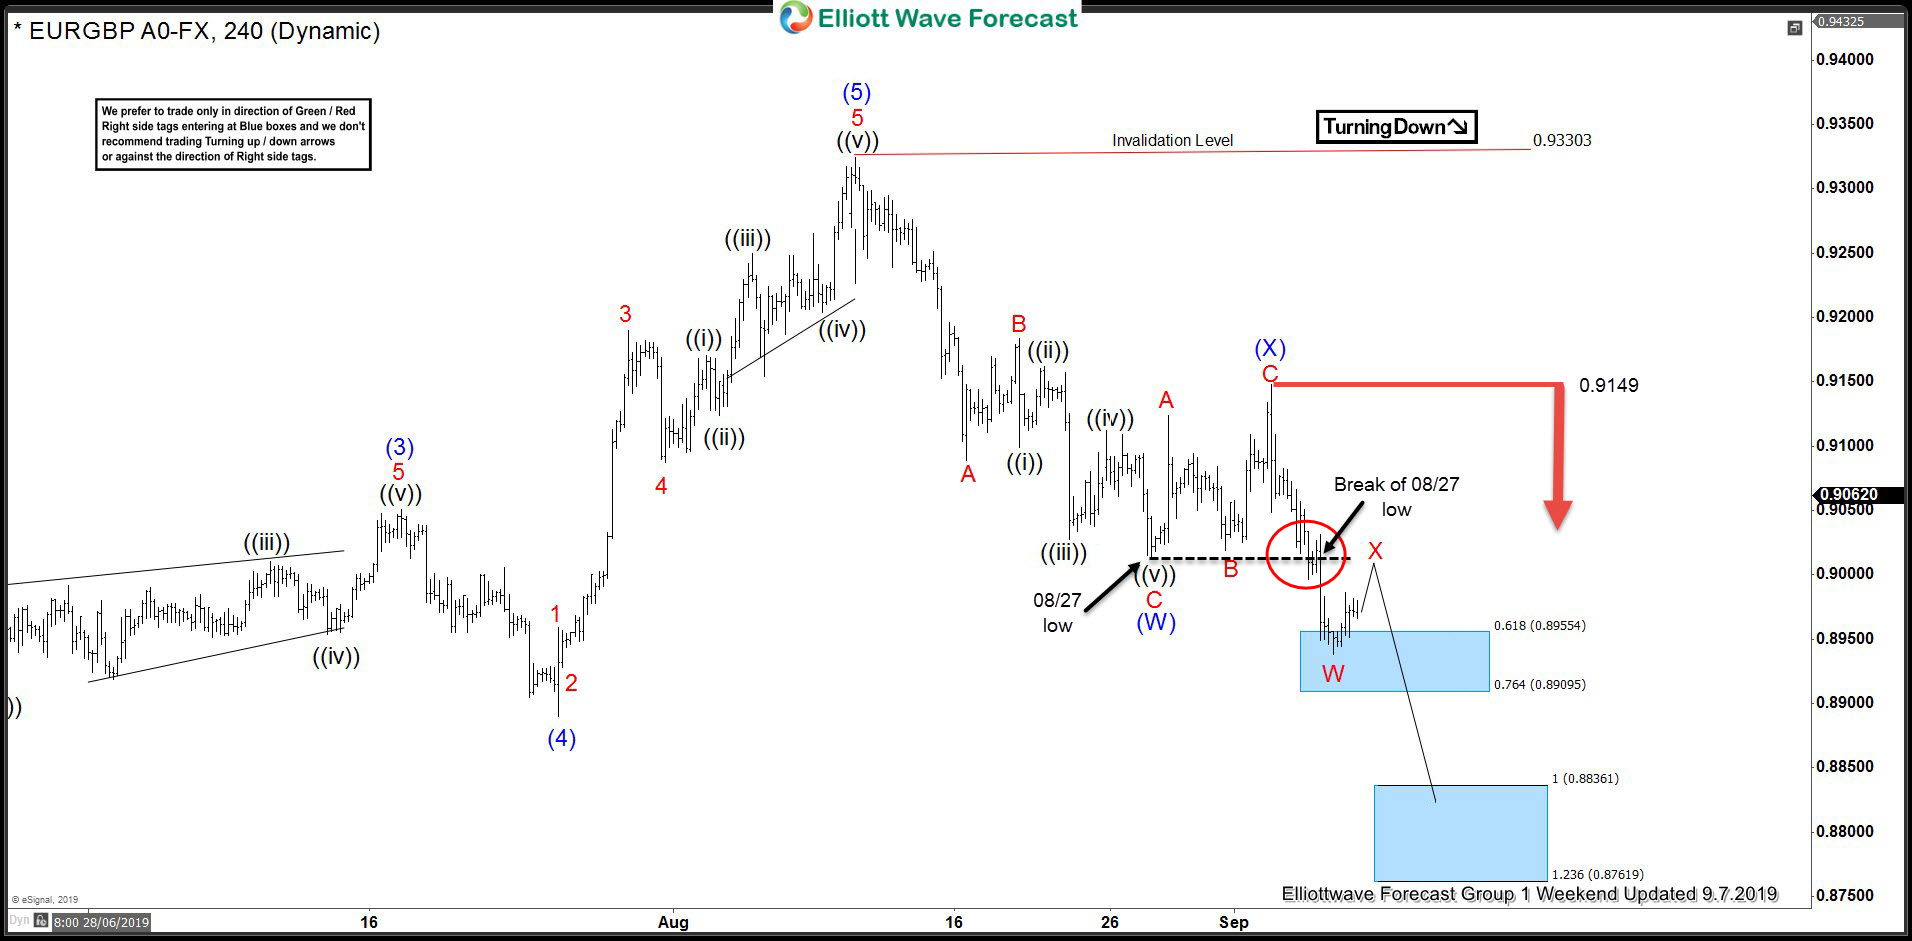
EURGBP Selling The Rallies At The Blue Box
Read MoreHello fellow traders. Another instrument that we have been trading lately is EURGBP. In this technical blog we’re going to take a quick look at the Elliott Wave charts of EURGBP, published in members area of the website. As our members know, EURGBP has incomplete bearish sequences in the cycle from the 08/12 peak . […]
-
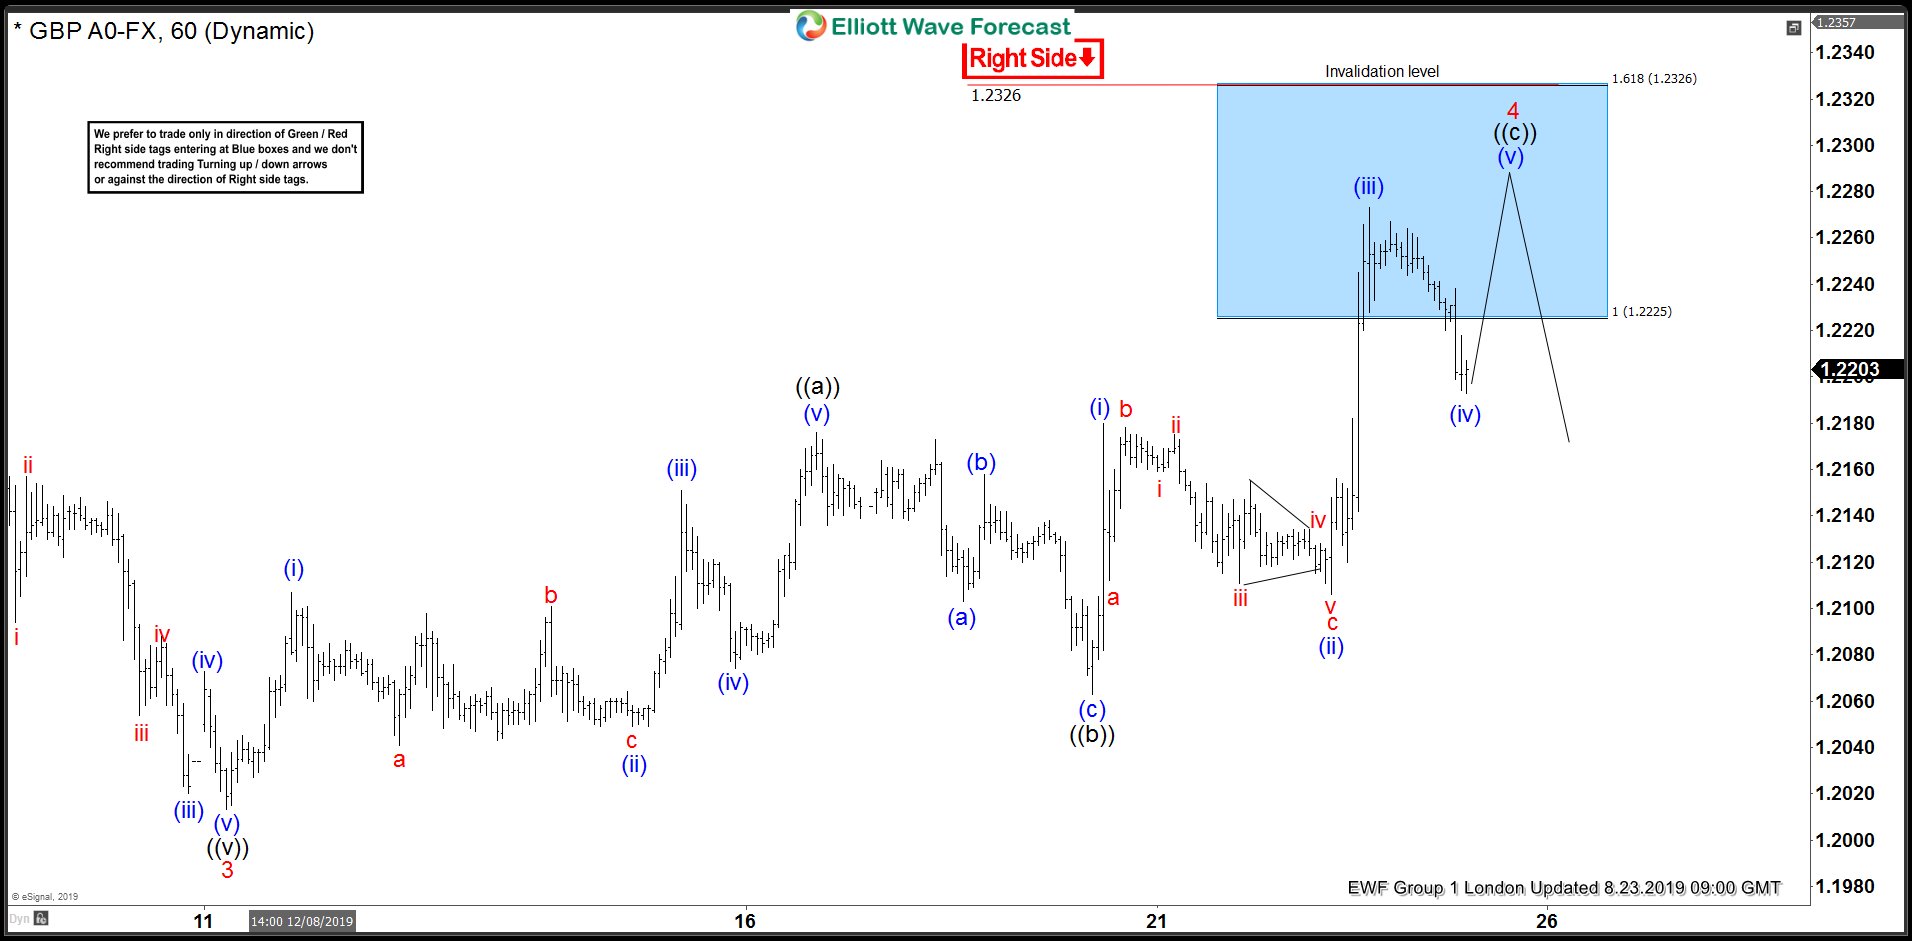
GBPUSD Forecasting The Decline From The Blue Box
Read MoreHello fellow traders. In this technical blog we’re going to take a quick look at the Elliott Wave charts of GBPUSD , published in members area of the website. GBPUSD has incomplete bearish sequences in the cycle from the April 2018 peak. Consequently, we advised members to avoid buying the pair and keep on selling […]
-
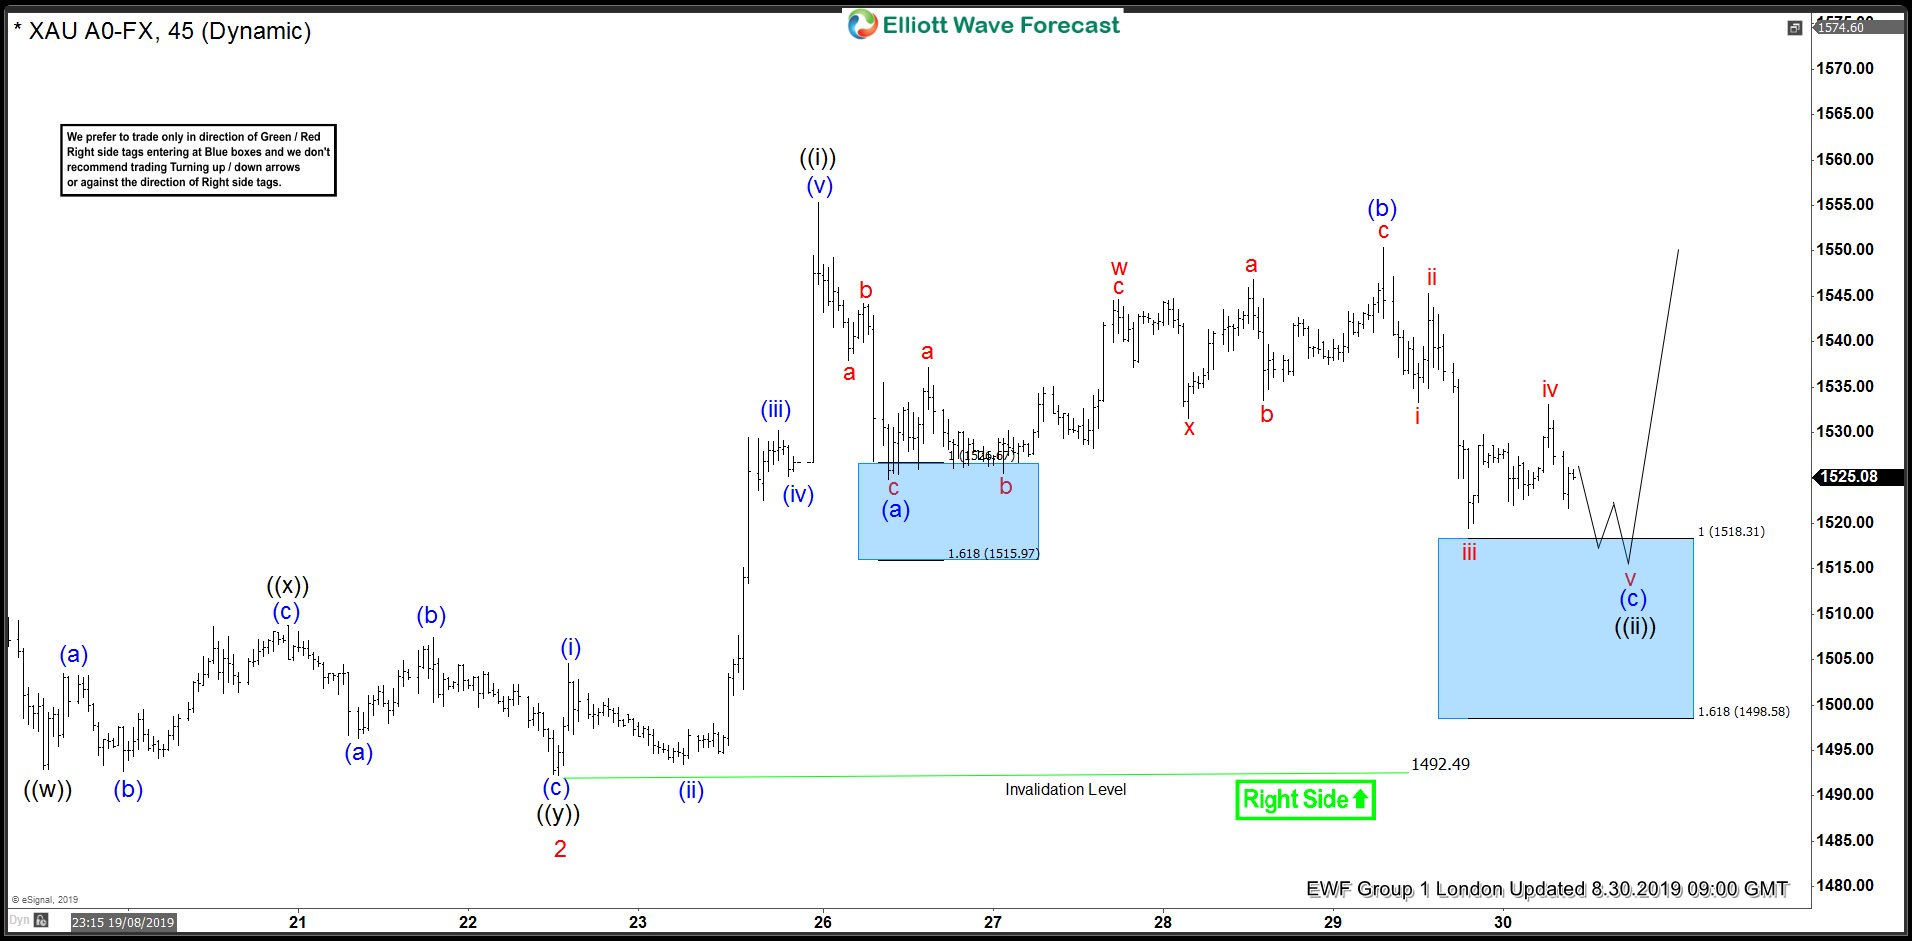
GOLD ( $XAUUSD ) Buying The Dips At The Blue Box
Read MoreHello fellow traders. In this technical blog we’re going to take a quick look at the Elliott Wave charts of GOLD ( $XAUUSD ), published in members area of the website. Break of August 13th peak made cycle from the 08/01 low( 1399.56) incomplete to the upside. Consequently GOLD is bullish against the 1492.49 low […]
-
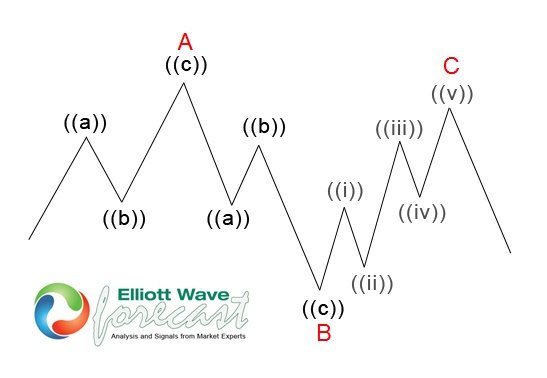
$USDJPY Forecasting The Decline After Running Flat Pattern
Read MoreHello fellow traders. In this technical blog we’re going to take a quick look at the Elliott Wave charts of USDJPY published in members area of the website. As our members know, USDJPY has incomplete bearish sequences in the cycle from the 04/24 peak. That makes the pair bearish against the 109.33 high. Consequently, we […]