
-
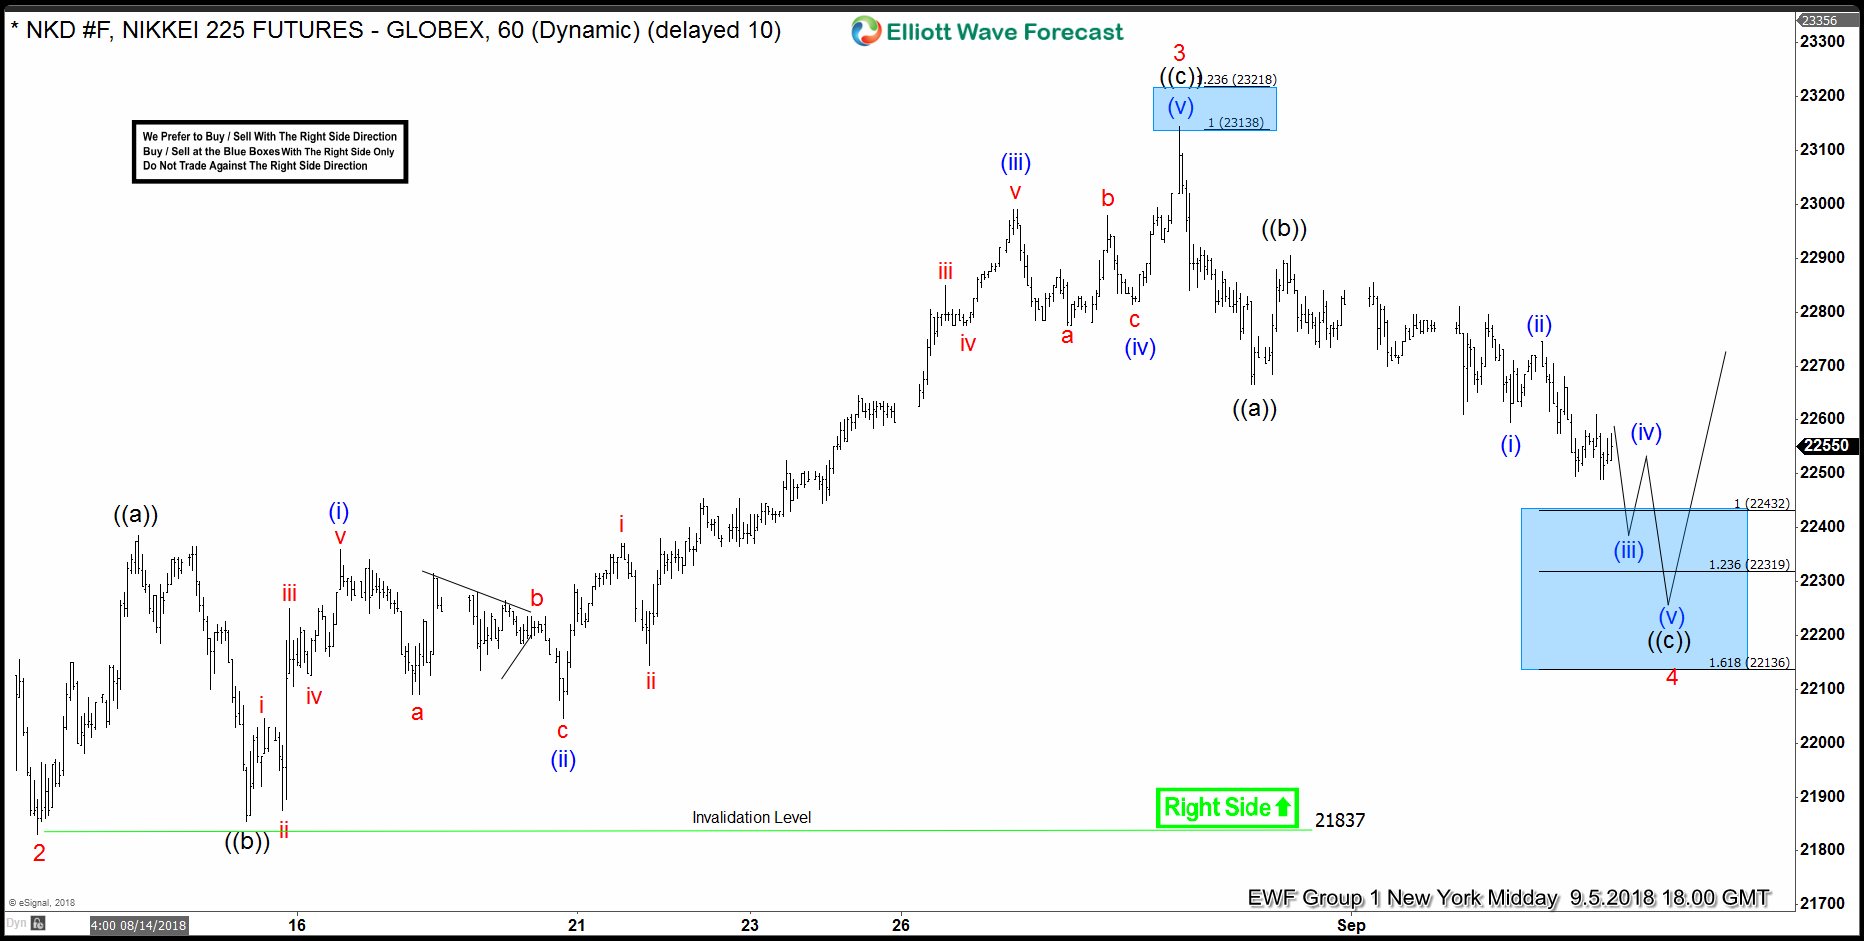

NIKKEI Forecasting The Rally & Buying The Dips
Read MoreHello fellow traders. In this technical blog we’re going to take a quick look at the Elliott Wave charts of NIKKEI NKD #F , published in members area of the website. As our members know, NIKKEI Futures has had incomplete bullish sequences according to Sequence Report. Consequently, we advised our members to avoid selling it […]
-
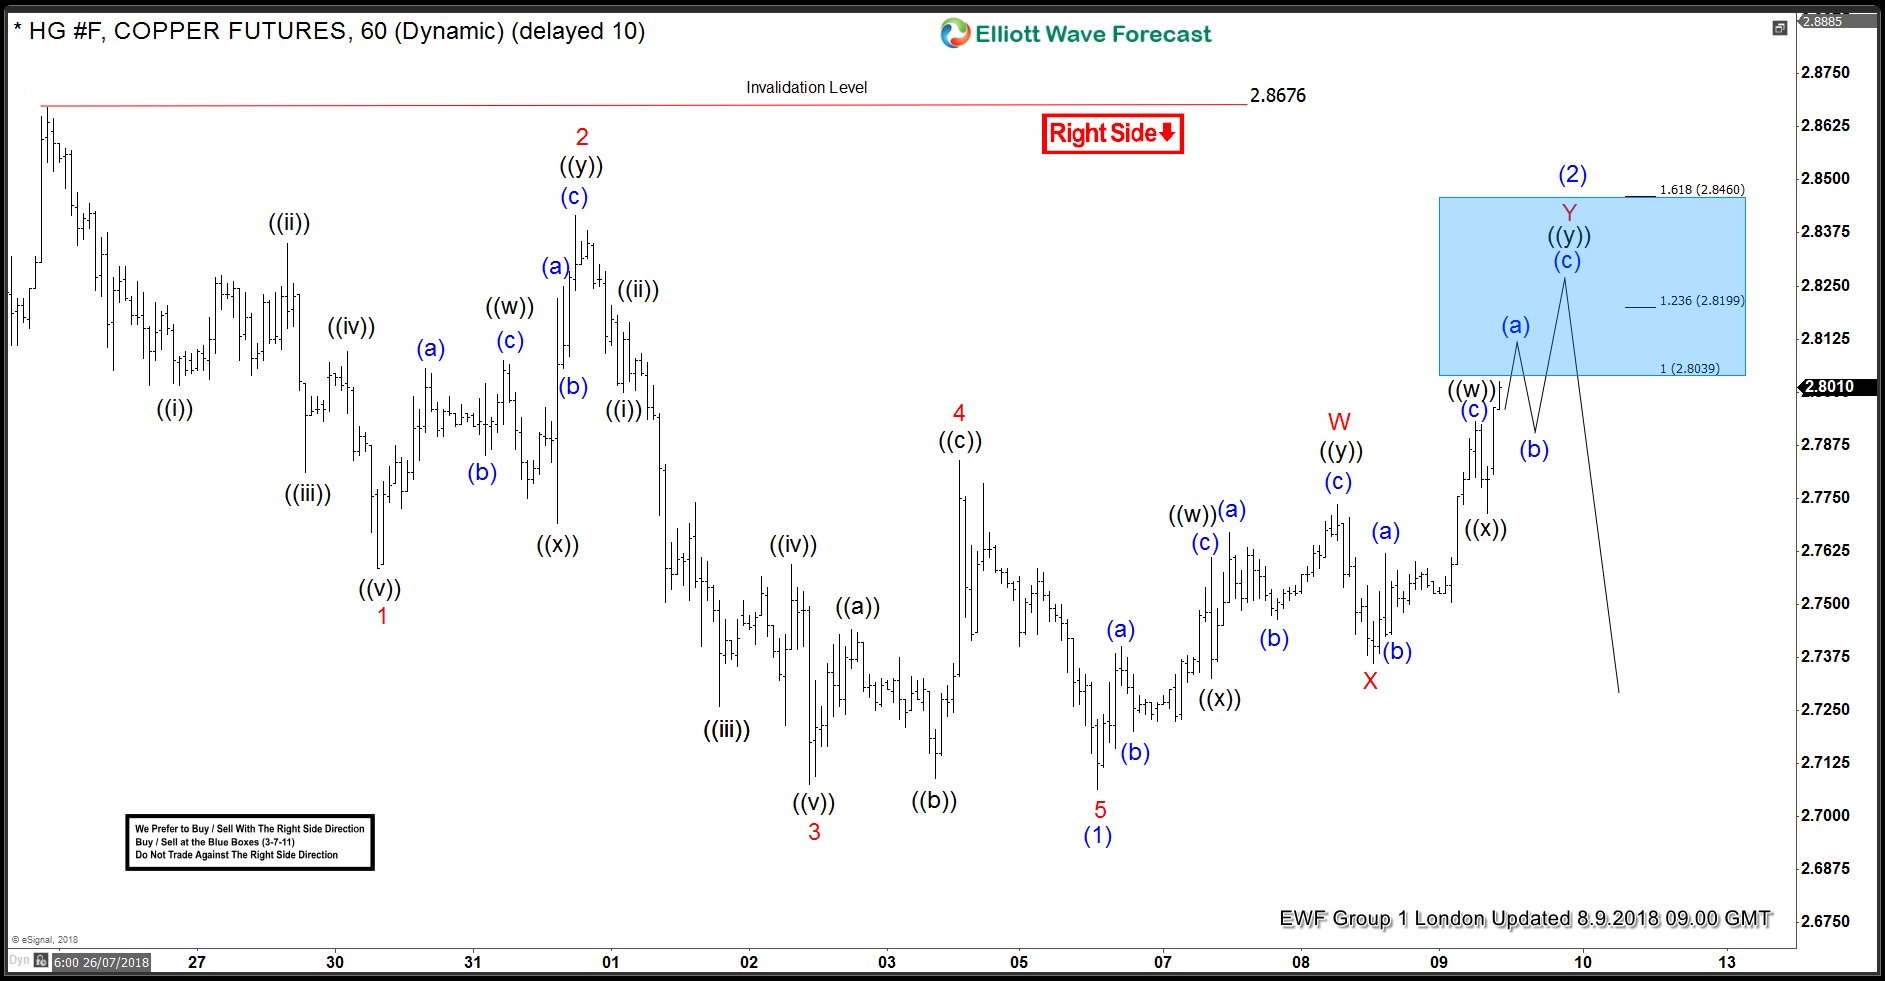
COPPER Forecasting The Decline & Selling The Rallies
Read MoreHello fellow traders. In this technical blog we’re going to take a quick look at the charts of COPPER. As our members know, COPPER has had cycle from the 13th October 2017 in progress as expanded Flat structure. The Commodity was missing another swing down to complete proposed pattern, approximately at 2.622-2.458 ( according to […]
-
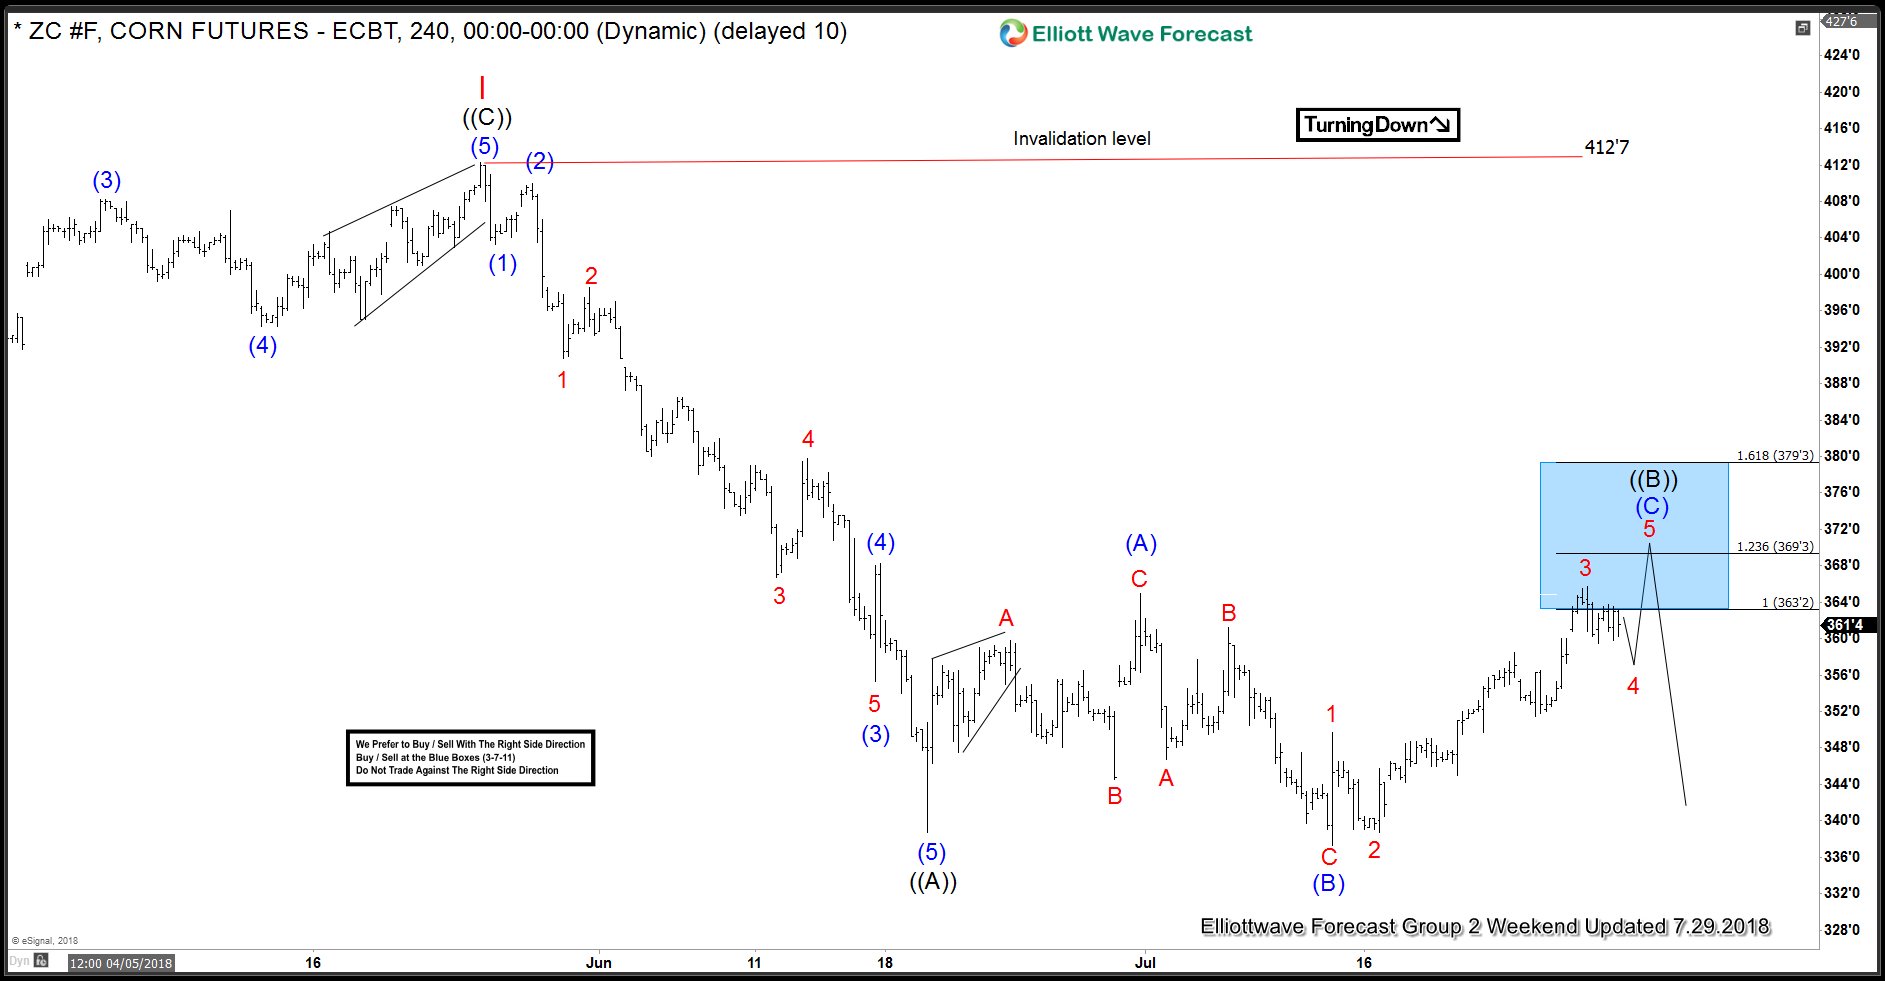
Corn Futures Forecasting The Decline After Elliott Wave Flat
Read MoreHello fellow traders. In this technical blog we’re going to take a quick look at the Elliott Wave charts of Corn Futures published in members area of the website. As our members know, the Commodity has corrected the cycle from the 412’7 peak. Proposed recovery has been unfolding as Expanded Elliott Wave Flat structure. In […]
-
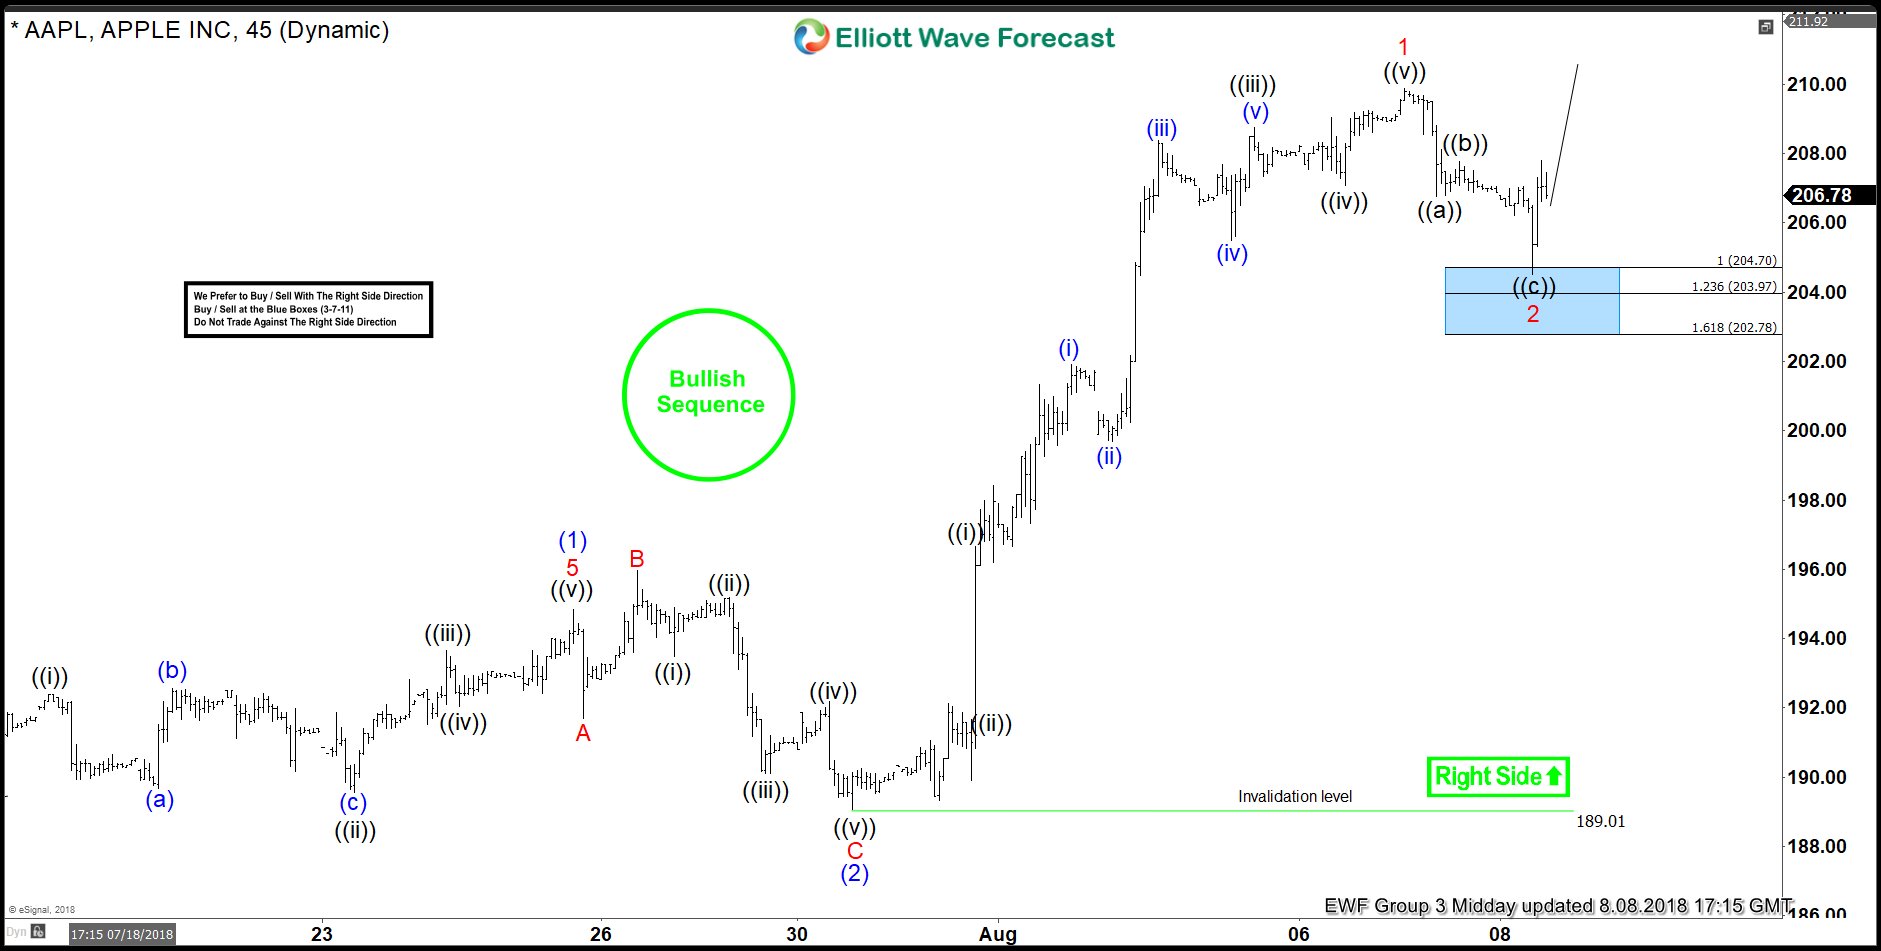
APPLE Buying The Dips in 3-7-11 Swings
Read MoreHello fellow traders. Another trading opportunity we have had lately is long trade in APPLE . In this technical blog we’re going to take a quick look at the Elliott Wave charts of APPLE published in members area of the website. As our members know, the stock has had incomplete bullish sequences in the cycle […]
-
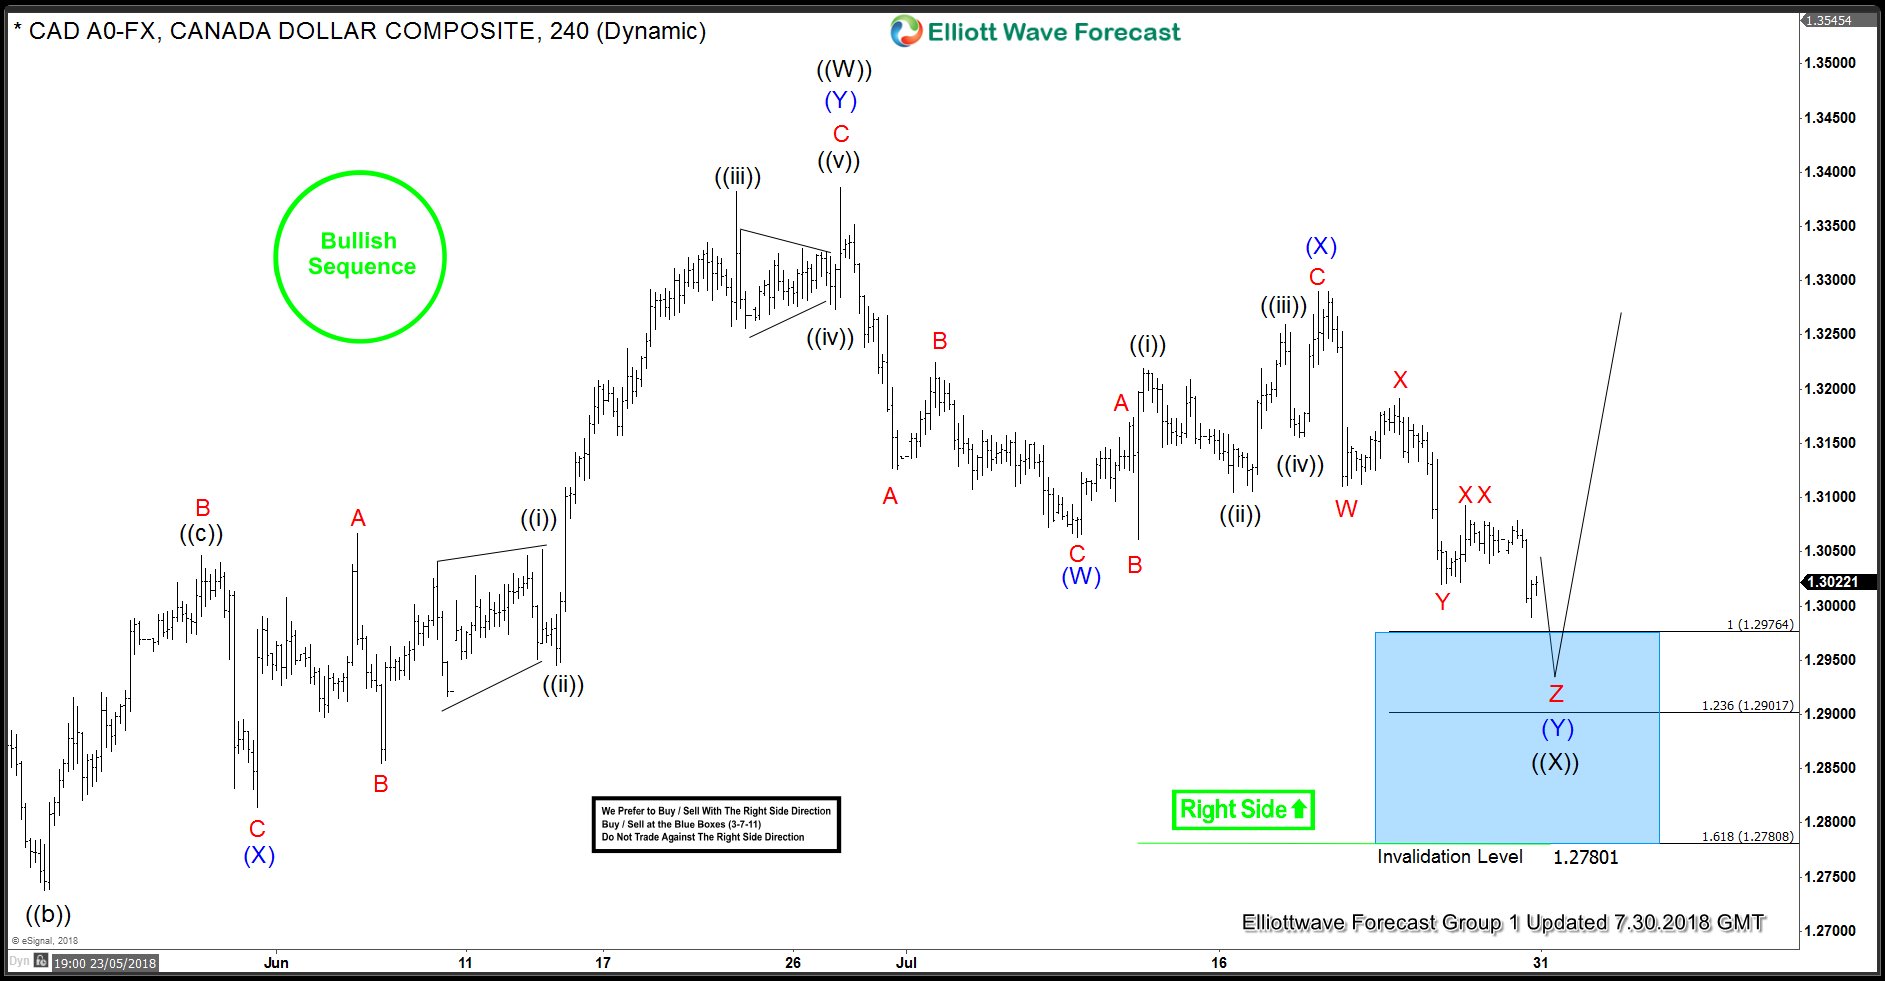
USDCAD: Found Buyers in Blue Box and Rallied
Read MoreHello fellow traders. Another trading opportunity we have had lately is USDCAD. In this technical blog we’re going to take a quick look at the Elliott Wave charts of USDCAD published in members area of the website. As our members and followers know, this pair has incomplete bullish sequences in the cycle from the September […]
-
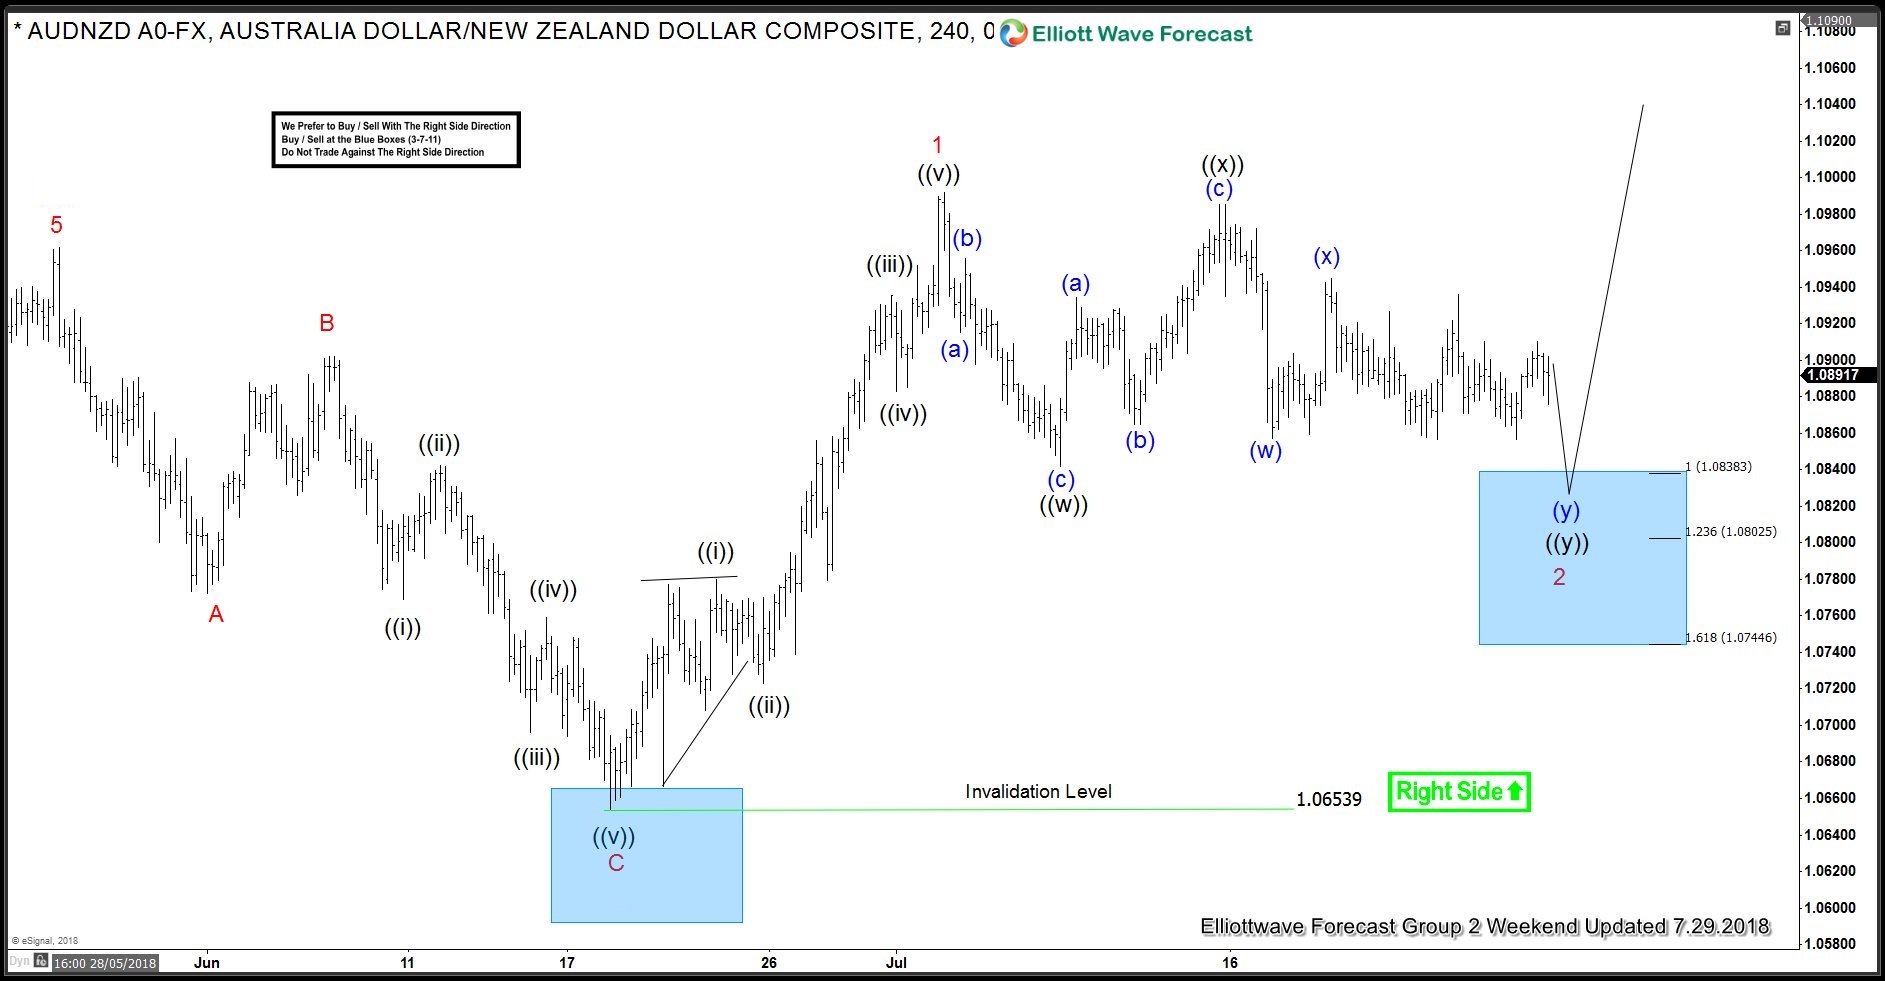
AUDNZD Forecasting The Rally & Buying The Dips
Read MoreHello fellow traders. Another trading opportunity we have had lately is AUDNZD. In this technical blog we’re going to take a quick look at the Elliott Wave charts of AUDNZD published in members area of the website. In further text we’re going to explain the forecast and trading setup. As our members know, AUDNZD have […]