
-
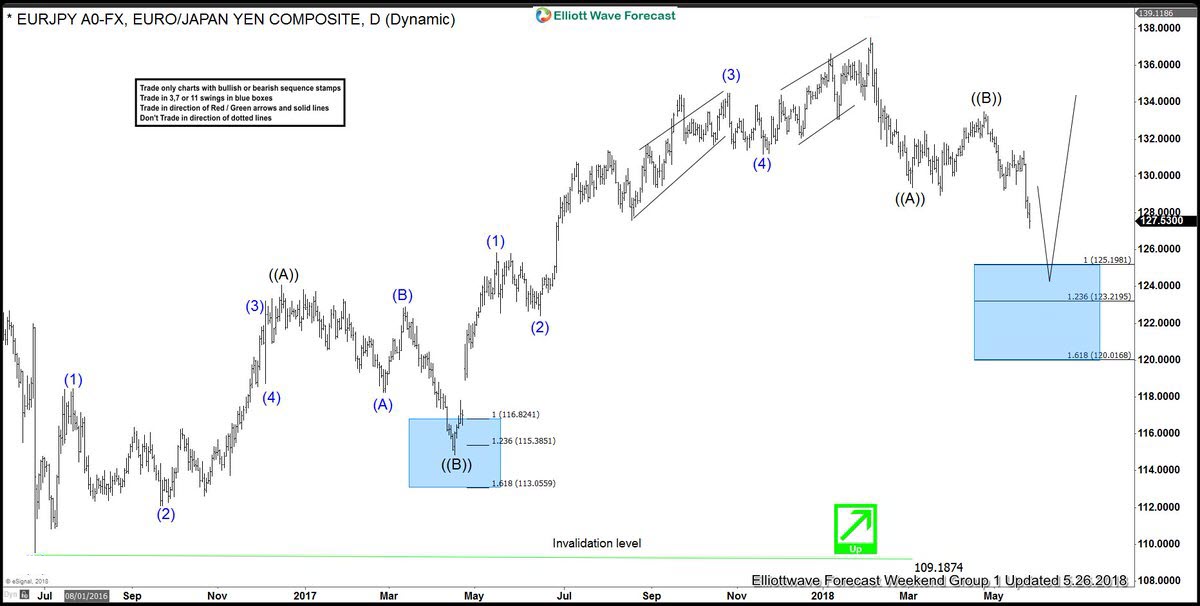

EURJPY Forecasting the Path & Buying the Dips
Read MoreHello Fellow Traders. Another instruments we have traded lately is EURJPY. As our members know, EURJPY has been correcting the cycle from the June 2016 low ( 109.187). We knew that price will find buyers as soon as it reaches extremes per Elliott Wave hedging strategy. We recommended members to wait for extremes to be […]
-
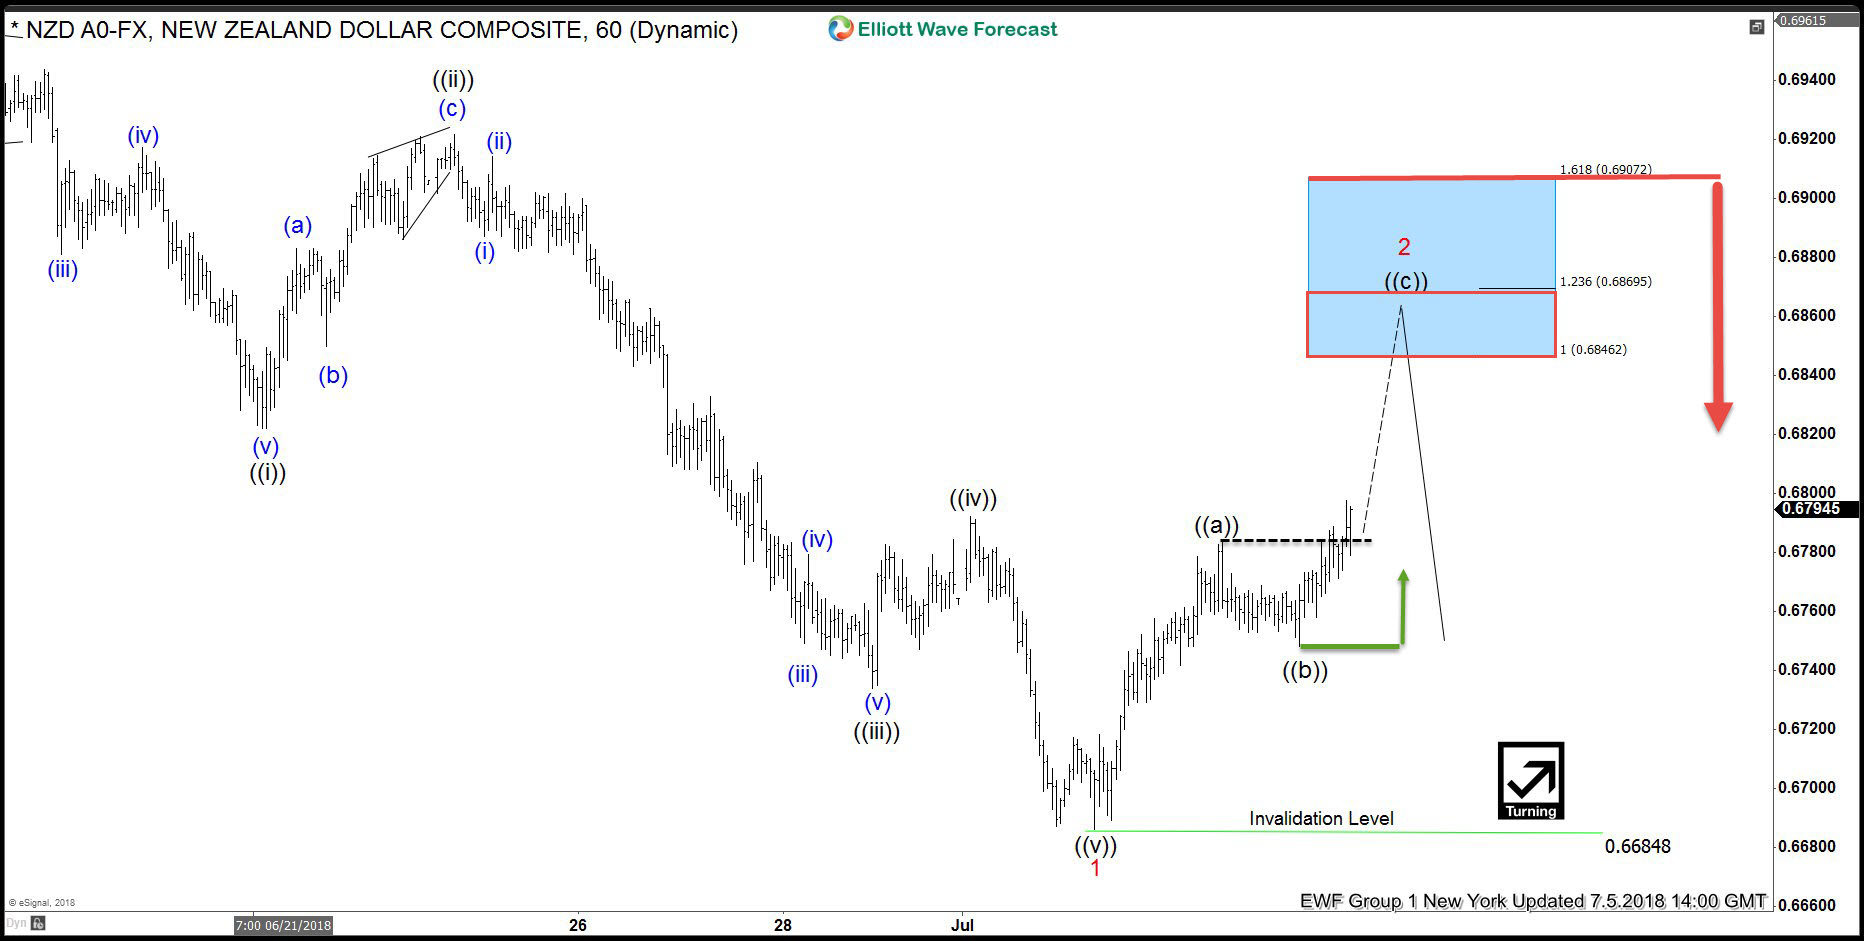
NZDUSD forecasting the path & selling the rallies
Read MoreHello fellow traders. In this technical blog we’re going to take a quick look at the charts of NZDUSD . In further text we’re going to explain the Elliott Wave structure, forecast and trading strategy. As our members know, we were keep saying that NZDUSD has had incomplete bearish sequences in cycle from the July […]
-
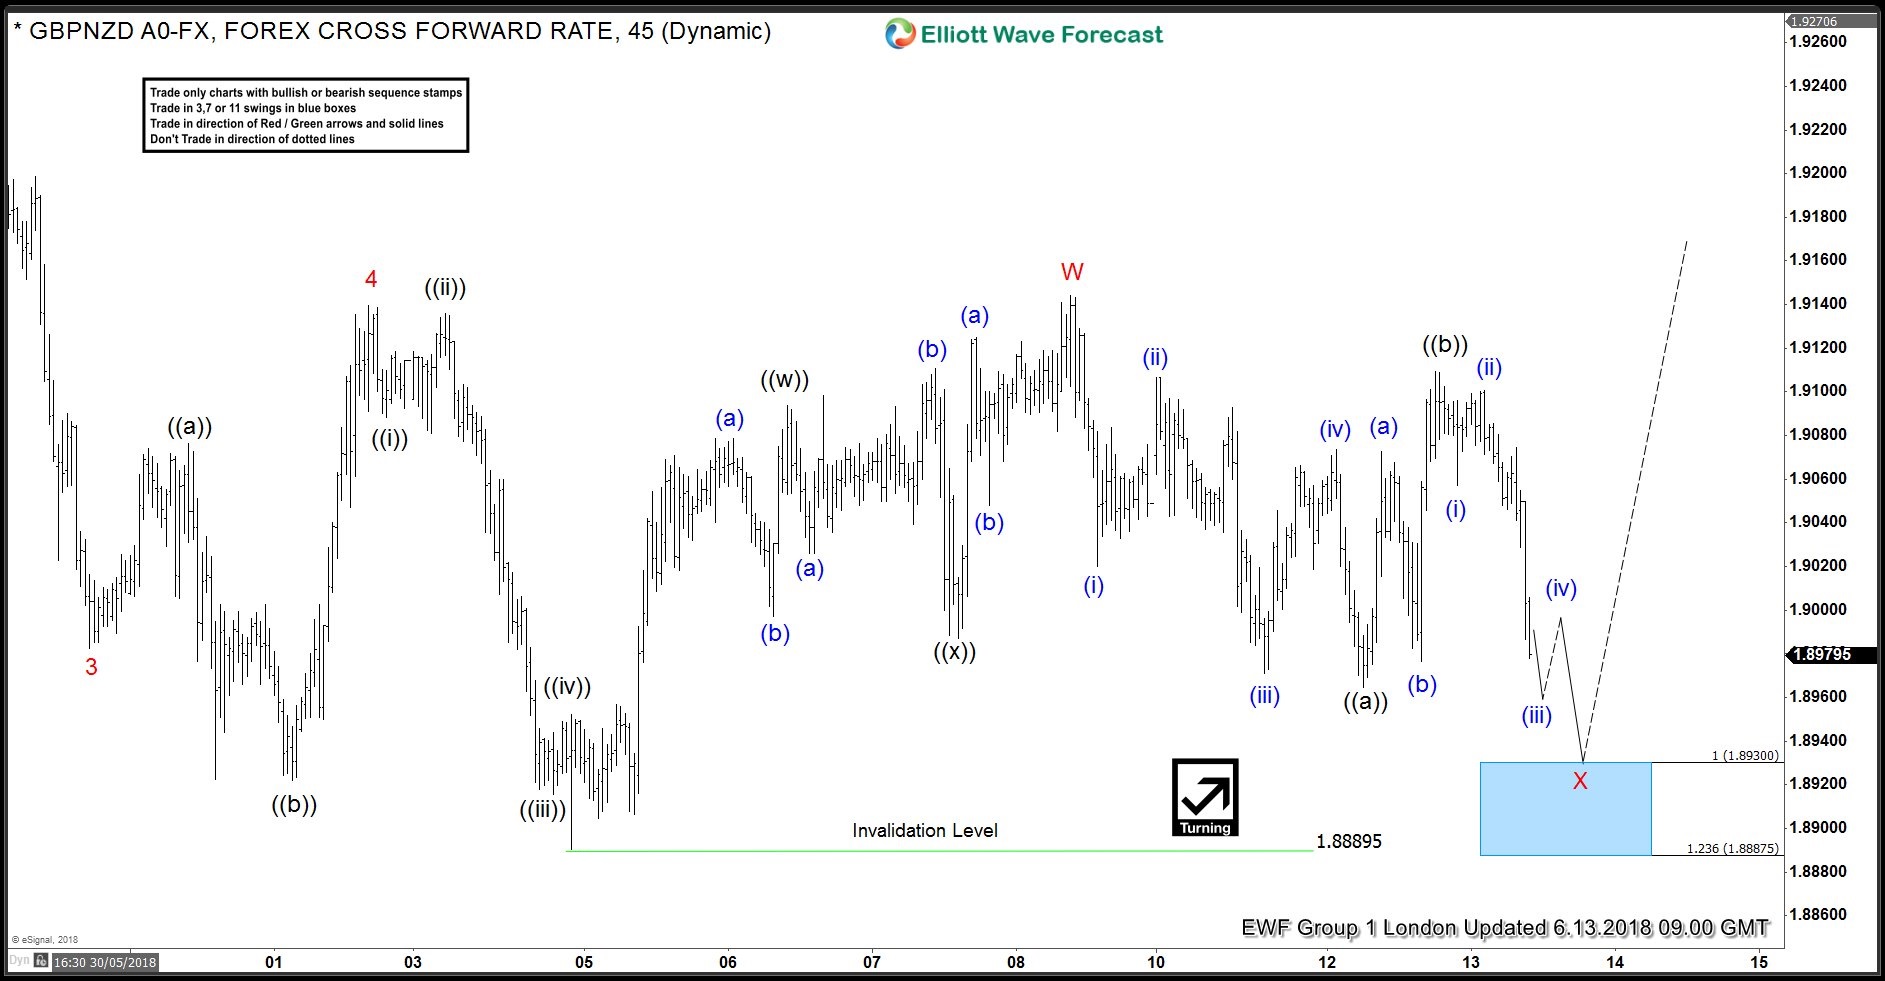
GBPNZD Forecasting the Rally after ZIGZAG
Read MoreIn this technical blog we’re going to take a quick look at the past Elliott Wave charts of GBPNZD published in members area of the website. As our members know, we have been calling for the recovery in the pair since the cycle from the April peak ended at 1.8889 low. In further text we’re […]
-
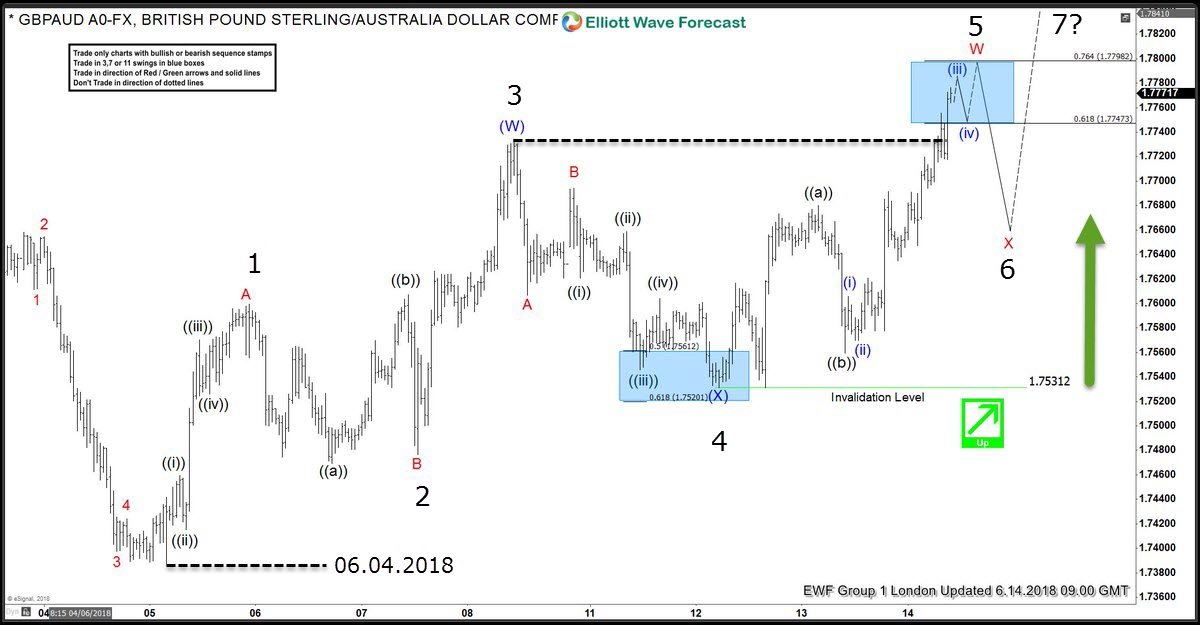
GBPAUD Incomplete Sequences Calling The Rally
Read MoreHello fellow traders. In this technical blog we’re going to take a quick look at the past Elliott Wave charts of GBPAUD published in members area of the website. As our members know GBPAUD has been showing incomplete bullish sequence: 5 swing in the short term cycle from the June 4th low. These types of […]
-
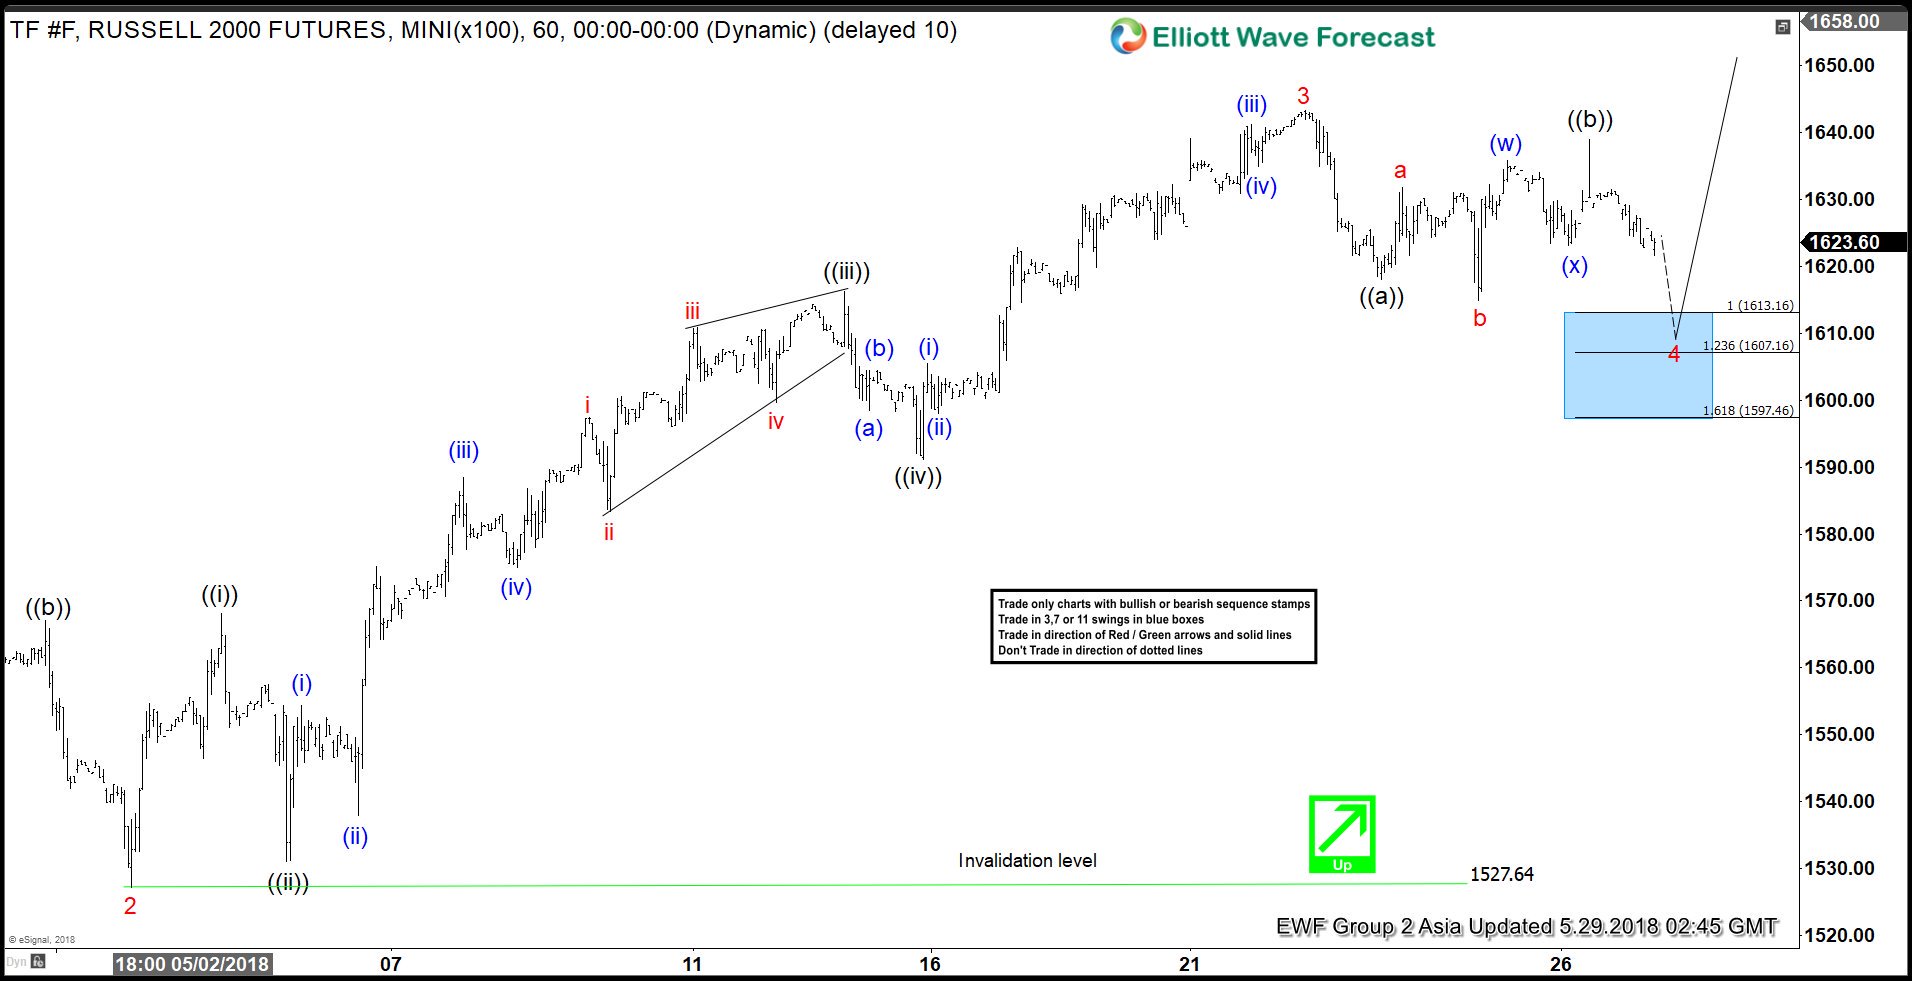
RUSSELL Forecasting The Rally & Buying The Dips
Read MoreHello fellow traders. Another trading opportunity we have had lately is RUSSELL Futures. In this technical blog we’re going to take a quick look at the Elliott Wave charts of RUSSELL published in members area of the website. In further text we’re going to explain the forecast and trading setup. As our members know, RUSSELL […]
-
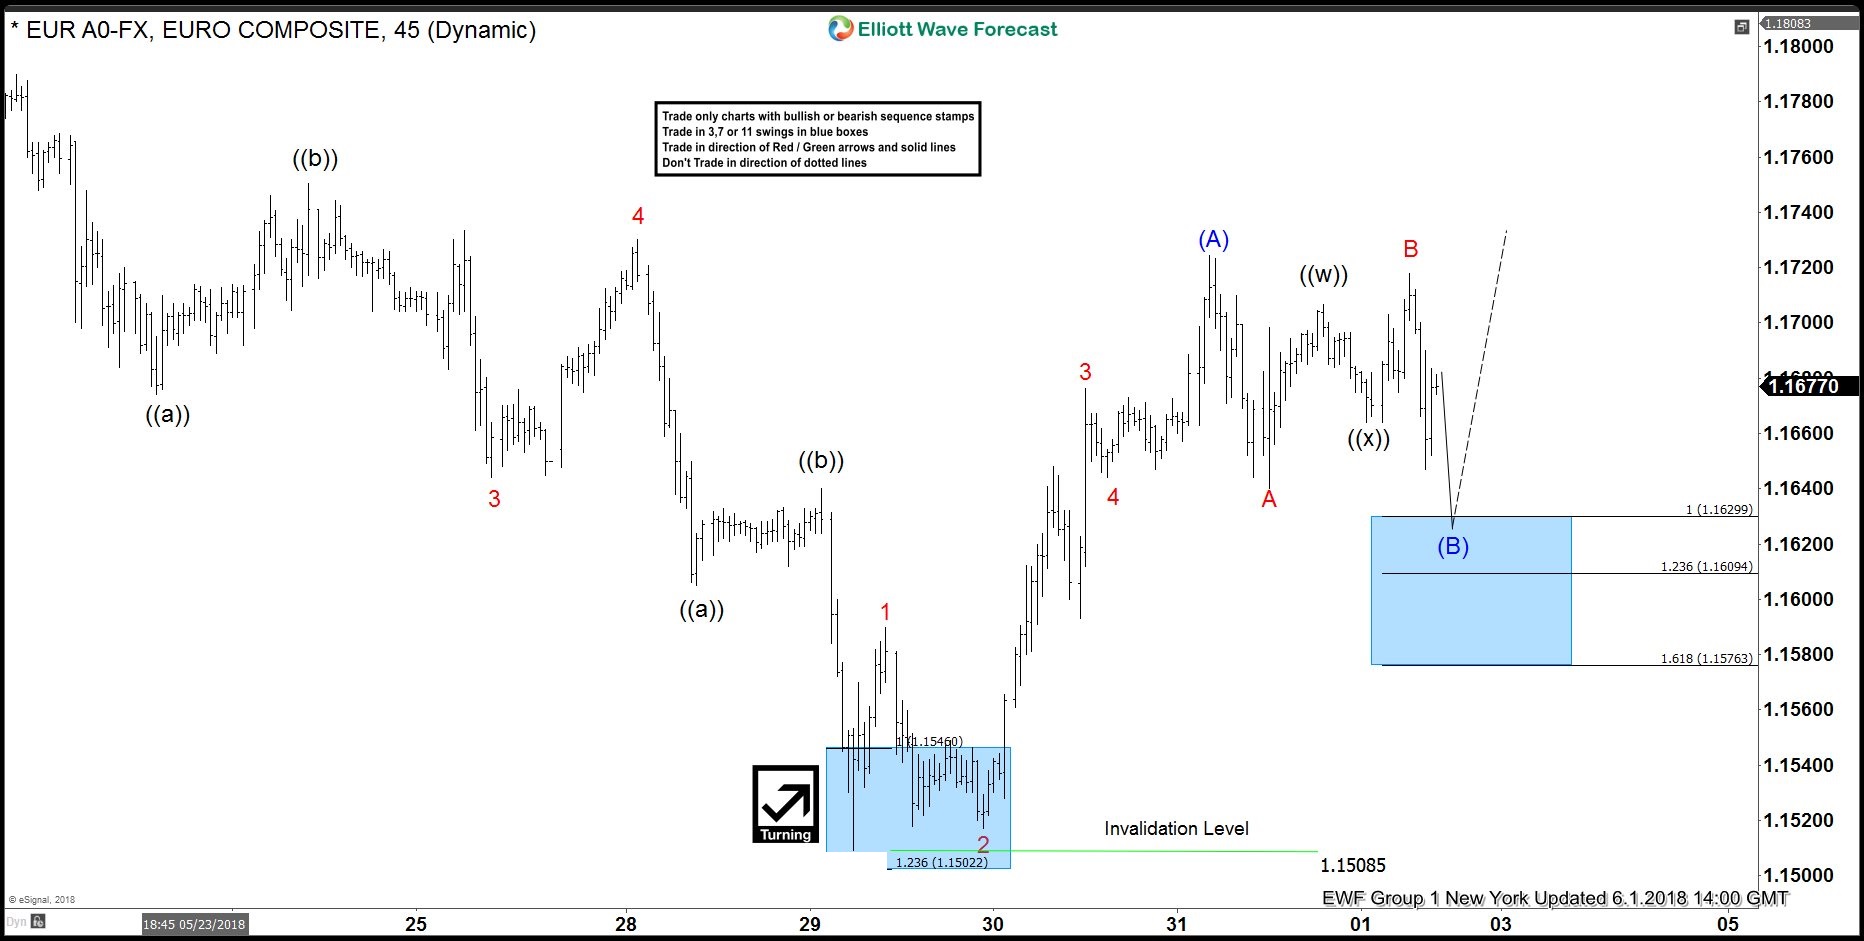
EURUSD Forecasting The Rally
Read MoreHello fellow traders. In this technical blog we’re going to take a quick look at the past Elliott Wave charts of EURUSD published in members area of the website. As our members know February cycle has ended at 1.15085 low and now we’re getting larger recovery in the pair. In further text we’re going to […]