
-
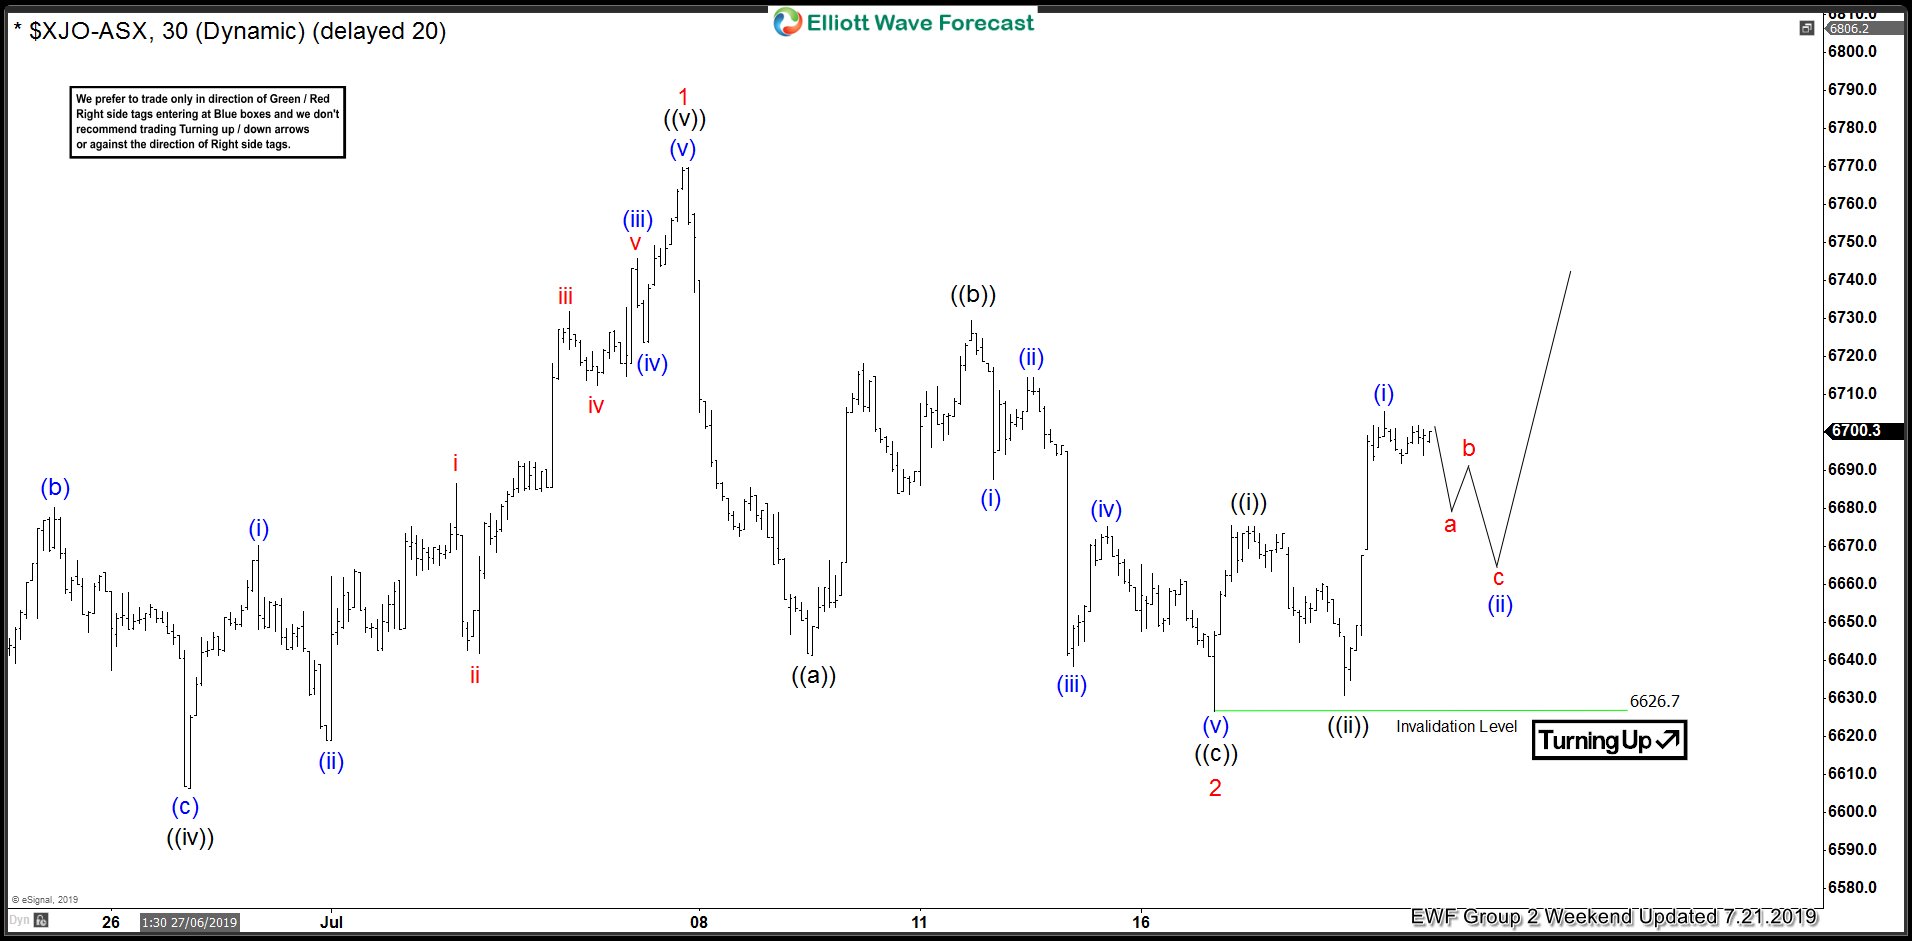
$ASX Forecasting The Rally After Elliott Wave Zig Zag Pattern
Read MoreHello fellow traders. In this technical blog we’re going to take a quick look at the Elliott Wave charts of ASX. As our members know ASX is another Index that is showing incomplete bullish sequences in the cycle from the December 2018 low. Rally from the 5413.6 low is showing incomplete impulsive structure, calling for […]
-
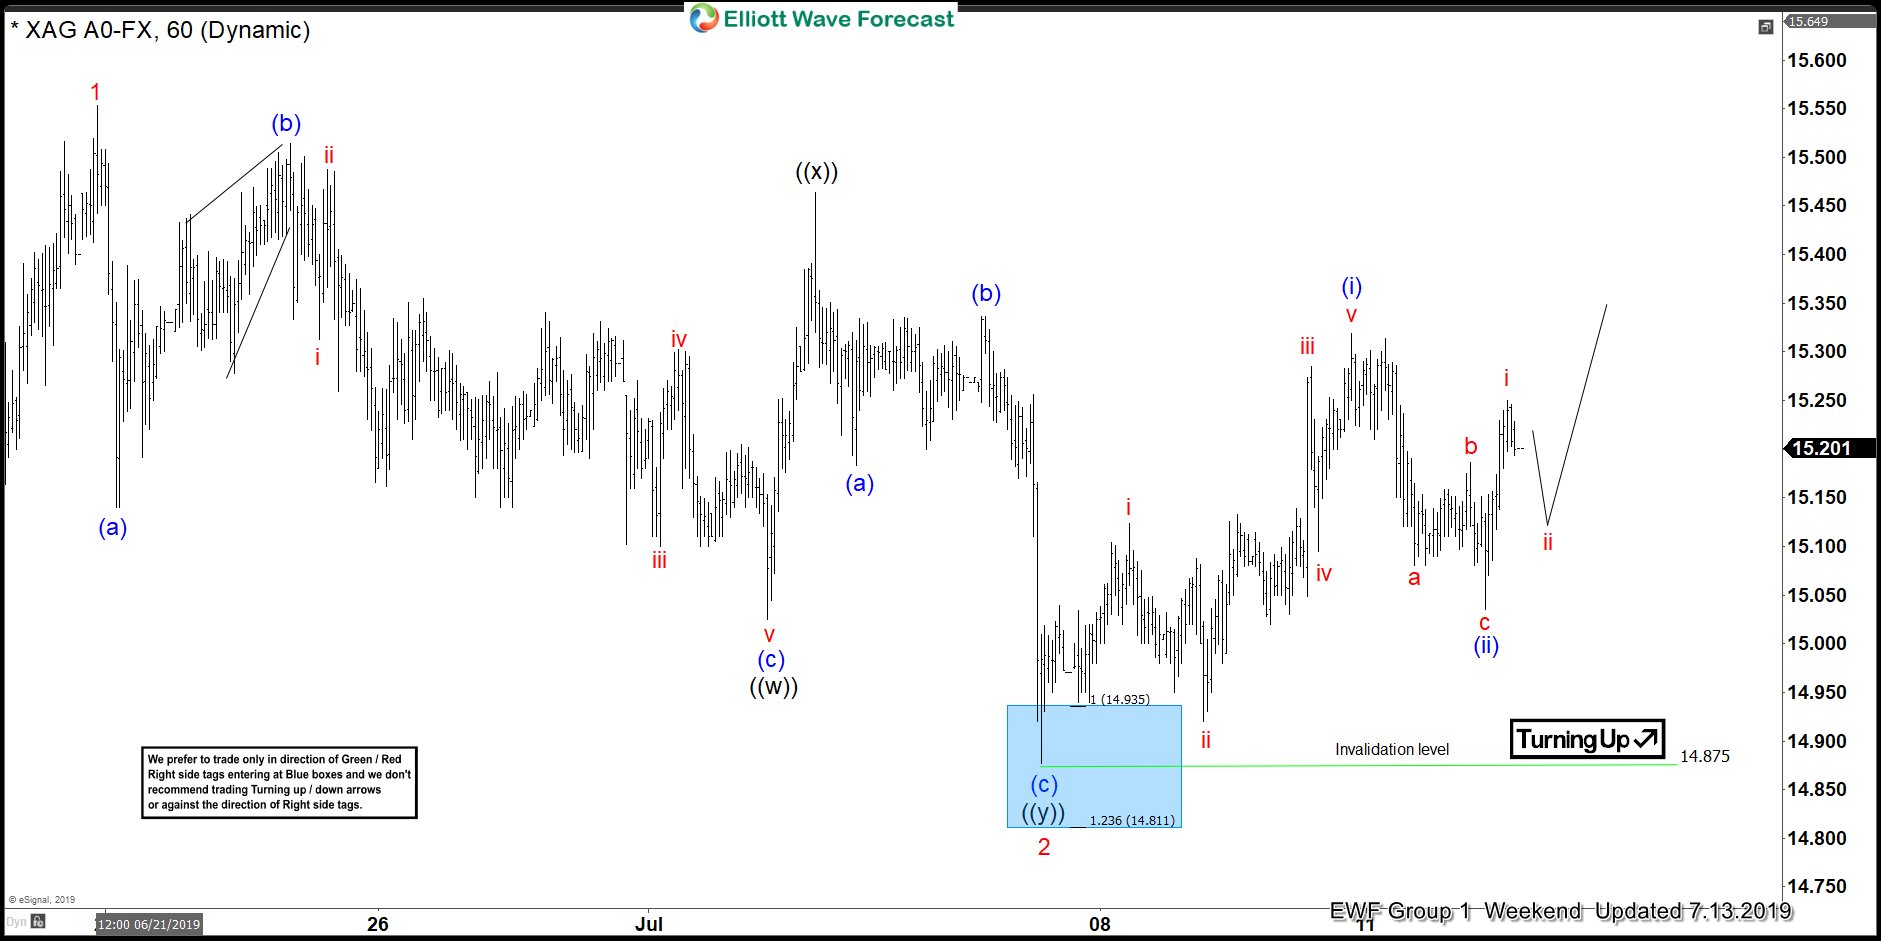
SILVER ( $XAGUSD ) Forecasting The Rally
Read MoreHello fellow traders. Recently we were forecasting the rally in commodities like SILVER and GOLD. As our members know, GOLD has been showing an incomplete sequence from August 16, 2018 low. Consequently, we were expecting SILVER to follow the same path due to strong correlation they have. We advised members to avoid selling those commodities […]
-
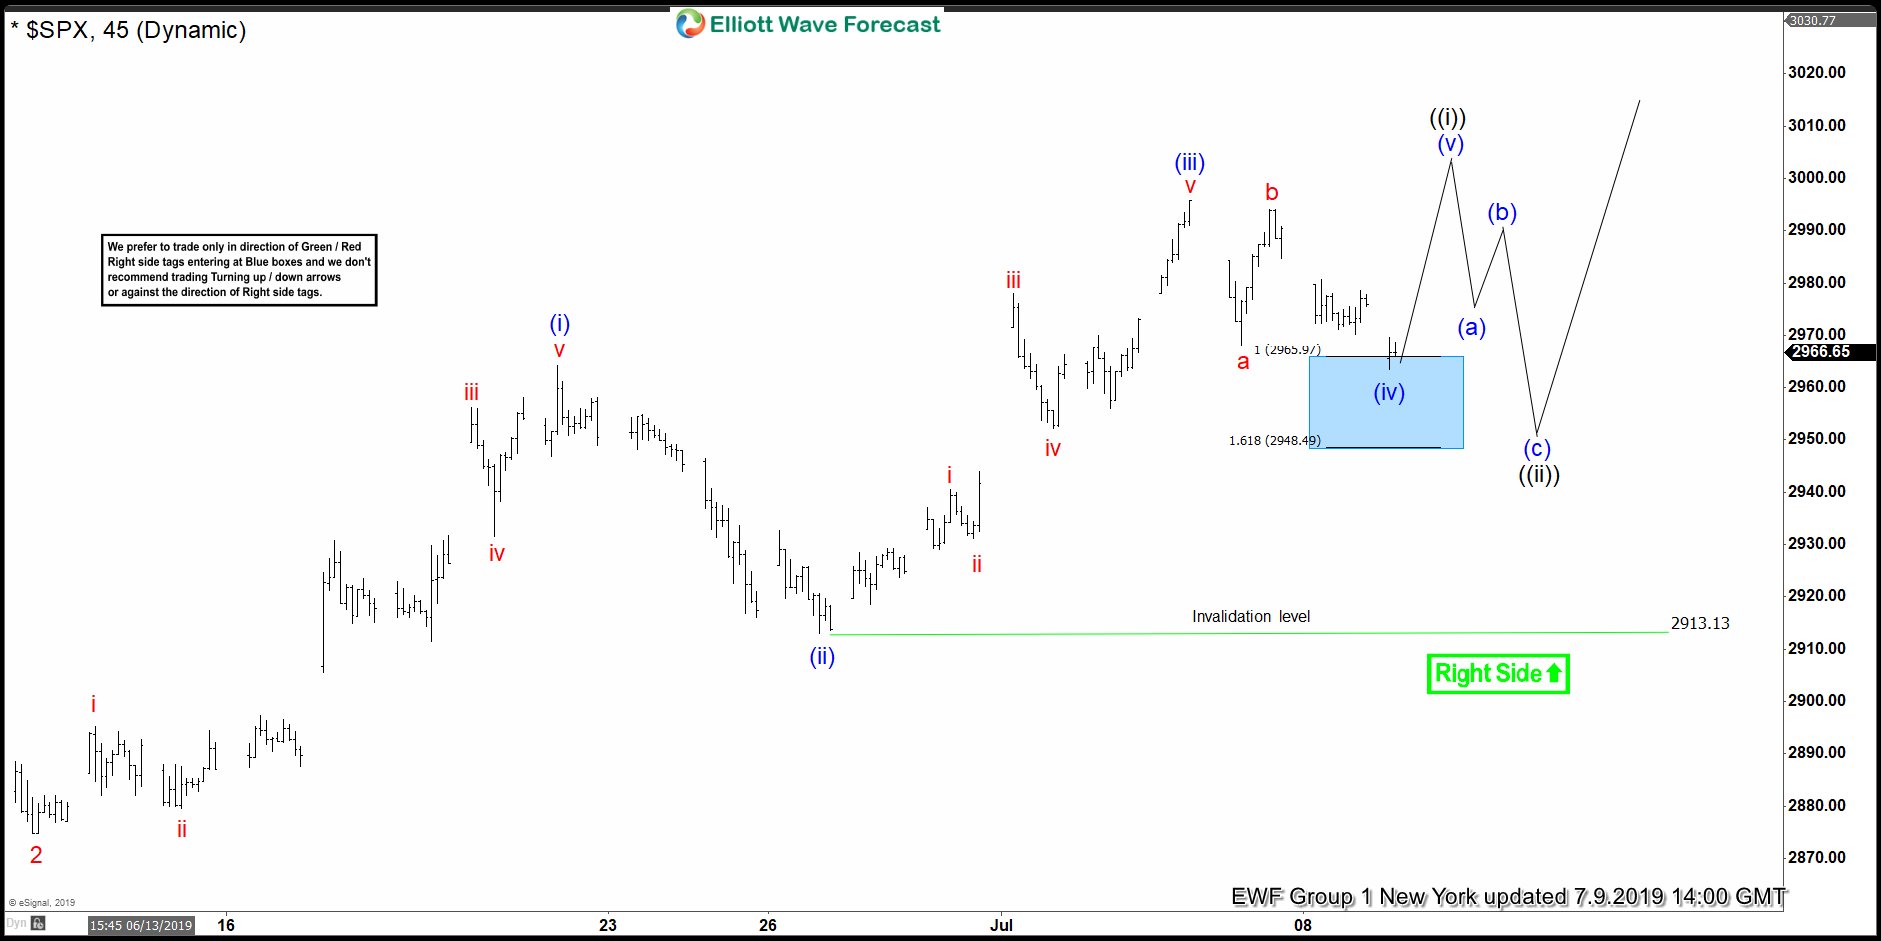
SPX Buying the dips In The Blue Box
Read MoreIn this technical blog we’re going to take a quick look at the Elliott Wave charts of SPX, published in members area of the website. SPX has incomplete bullish sequence in the cycle from June 3rd low (2730.28). The Elliott wave structure has been calling for further strength in index. Consequently, we advised members to […]
-
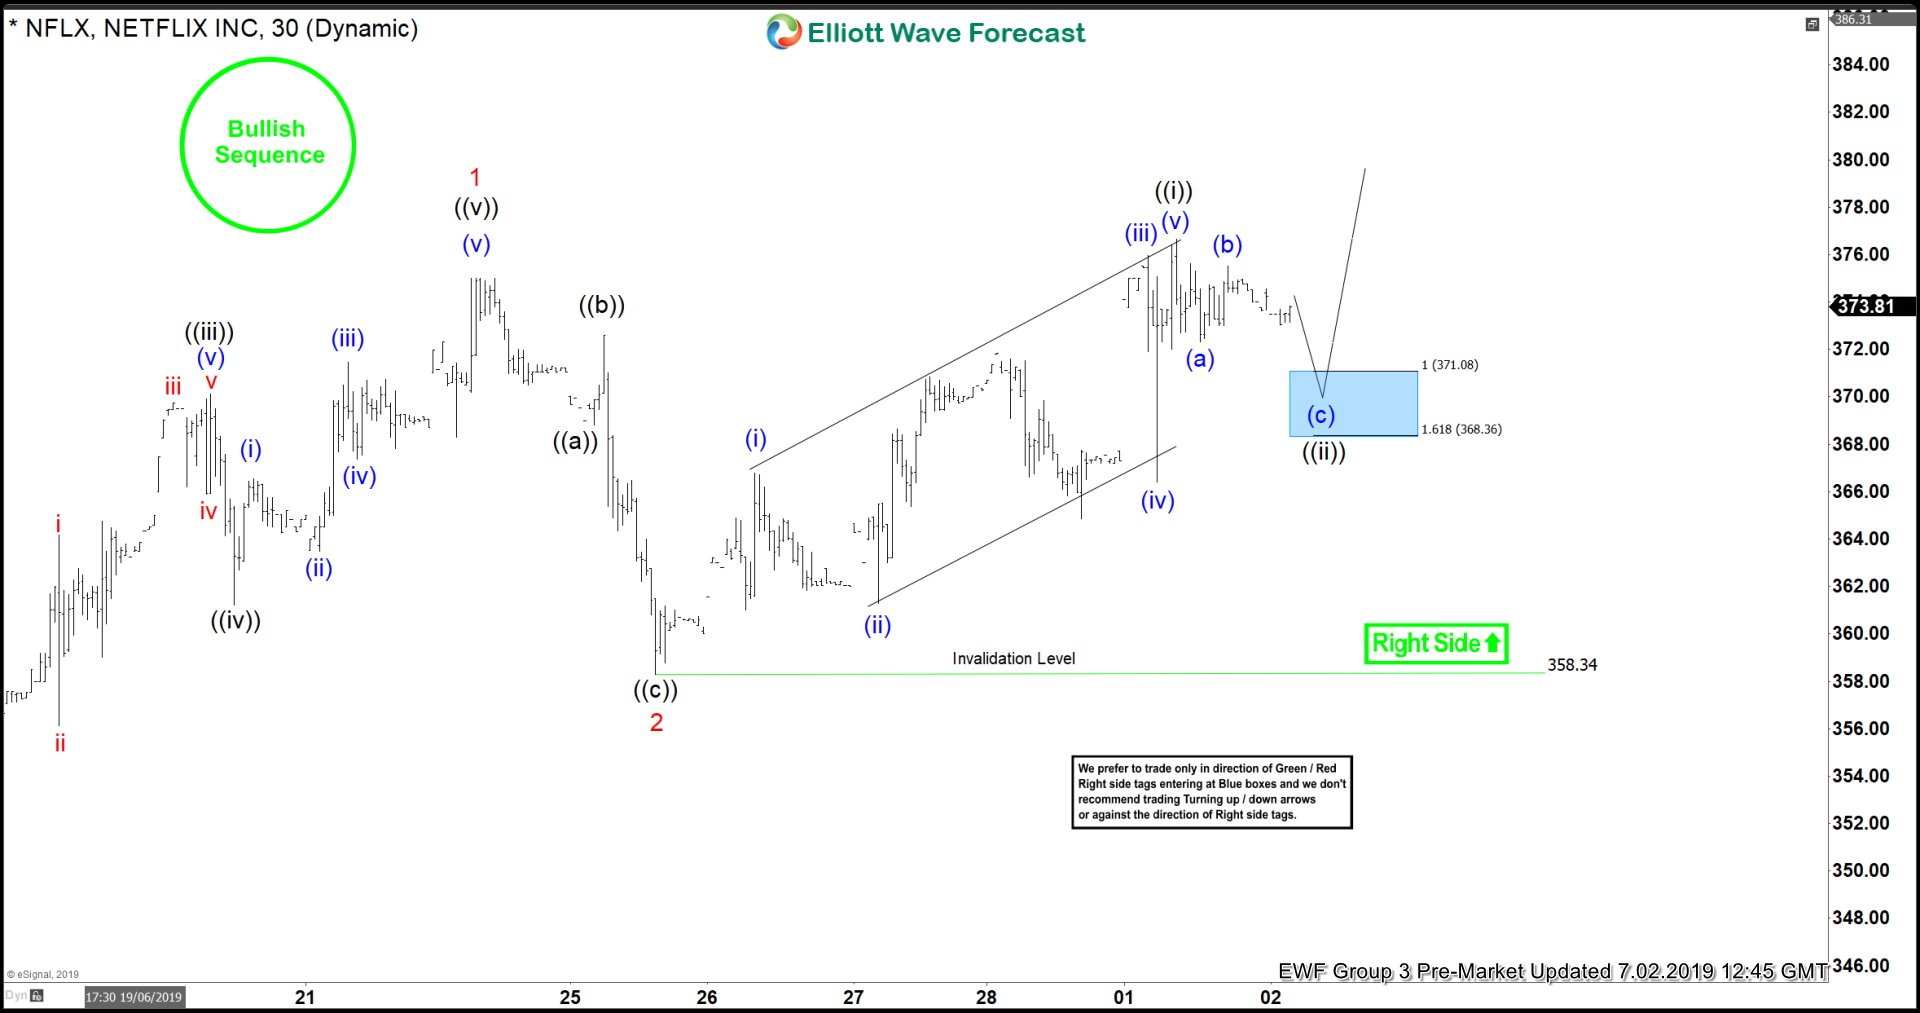
NETFLIX Forecasting The Rally And Buying The Dips In Blue Box
Read MoreHello fellow traders. In this technical blog we’re going to take a quick look at the Elliott Wave charts of NETFLIX , published in members area of the website. As our members know, NETFLIX has incomplete bullish sequence in the cycle from June 14th low. The Elliott wave structure has been calling for further strength. […]
-
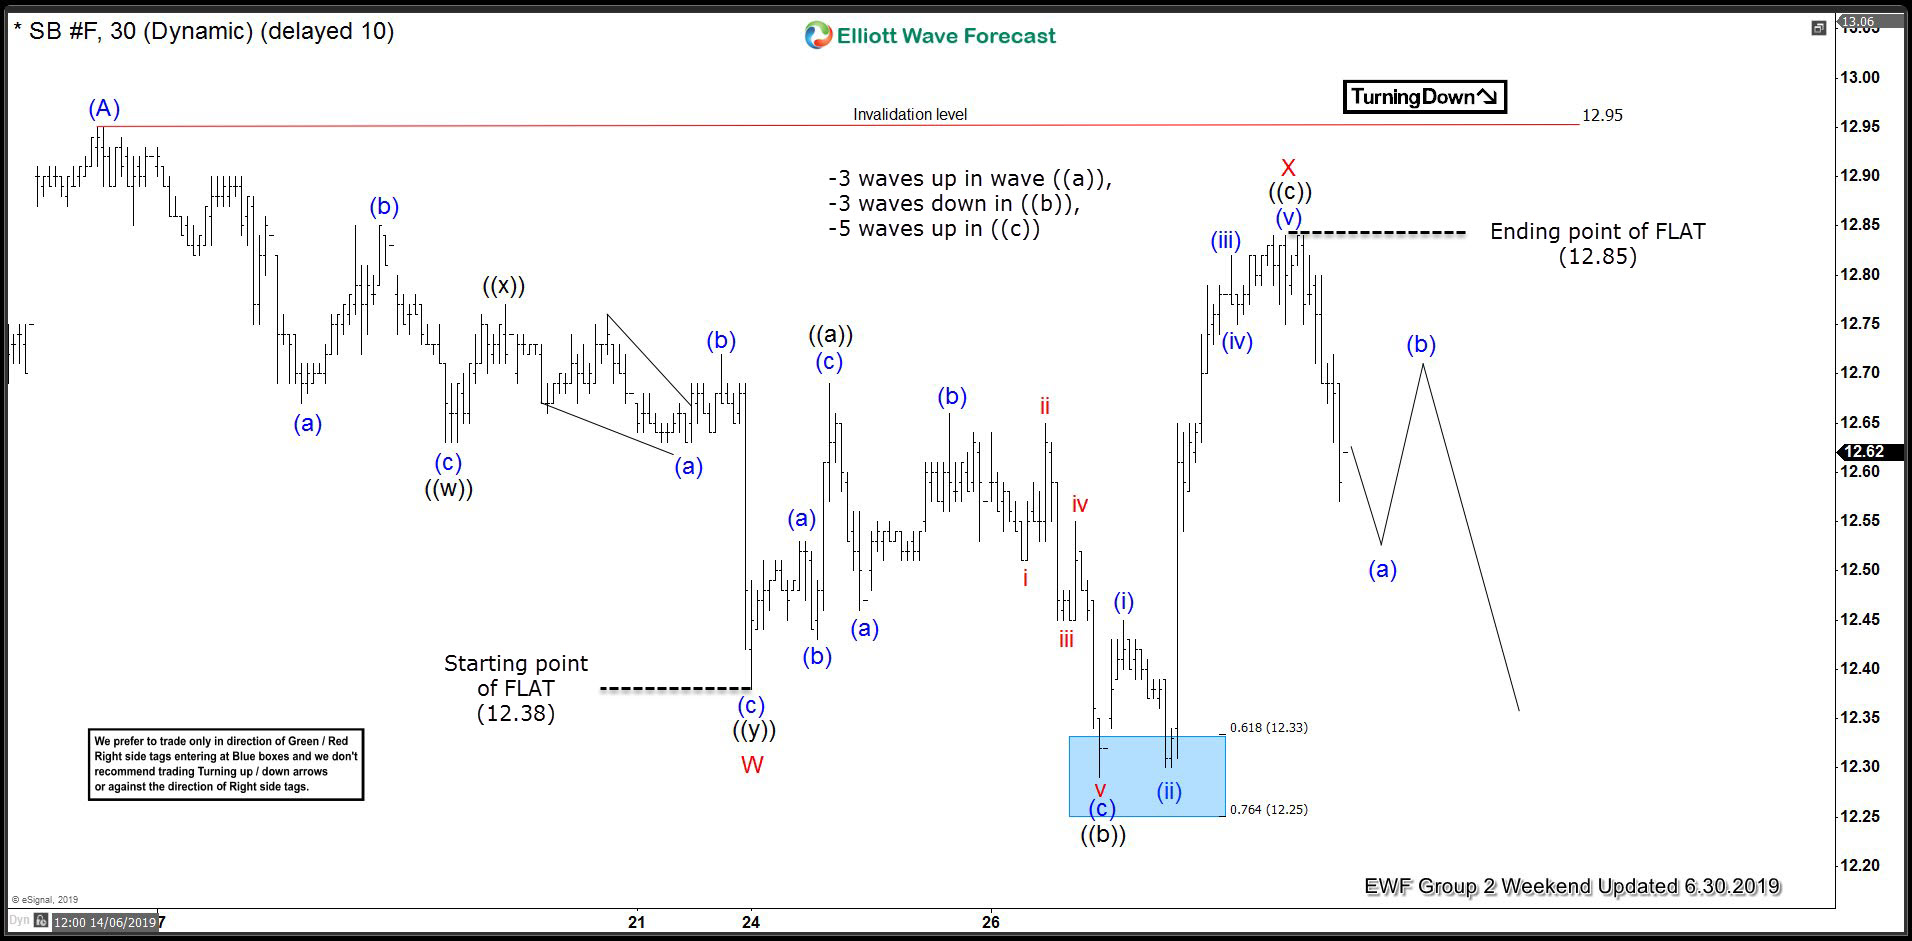
SUGAR ( $SB_F ) Forecasting The Decline After Elliott Wave Flat
Read MoreHello fellow traders. In this technical blog we’re going to take a quick look at the Elliott Wave charts of SUGAR ( $SB_F ) published in members area of the website. As our members know, the commodity made Elliott Wave Flat structure against the 12.95 high and gave us forecasted decline. In further text we’re […]
-
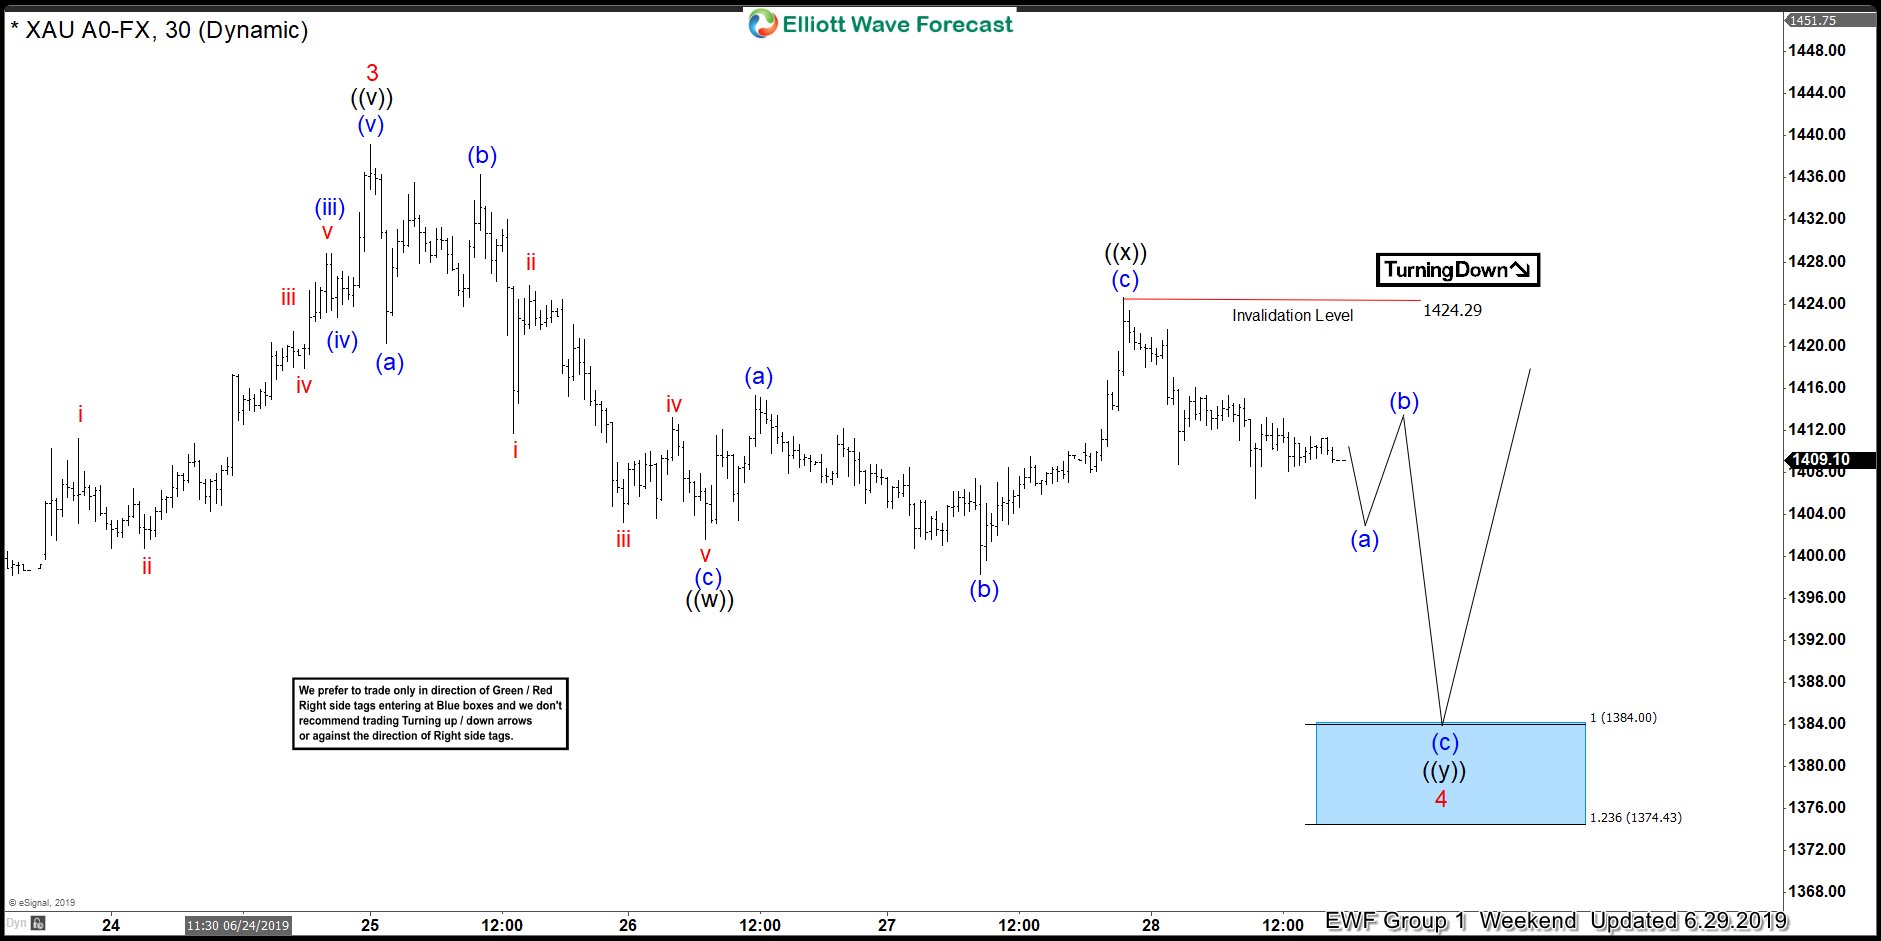
GOLD ( $XAUUSD ) Buying The Dips At The Blue Box
Read MoreHello fellow traders. In this technical blog we’re going to take a quick look at the Elliott Wave charts of GOLD . As our members know GOLD has incomplete bullish sequences within August 2018 cycle. When the price broke 02/20 peak, GOLD became bullish against the 1265.92 low. Since then we favor the long side. […]