-

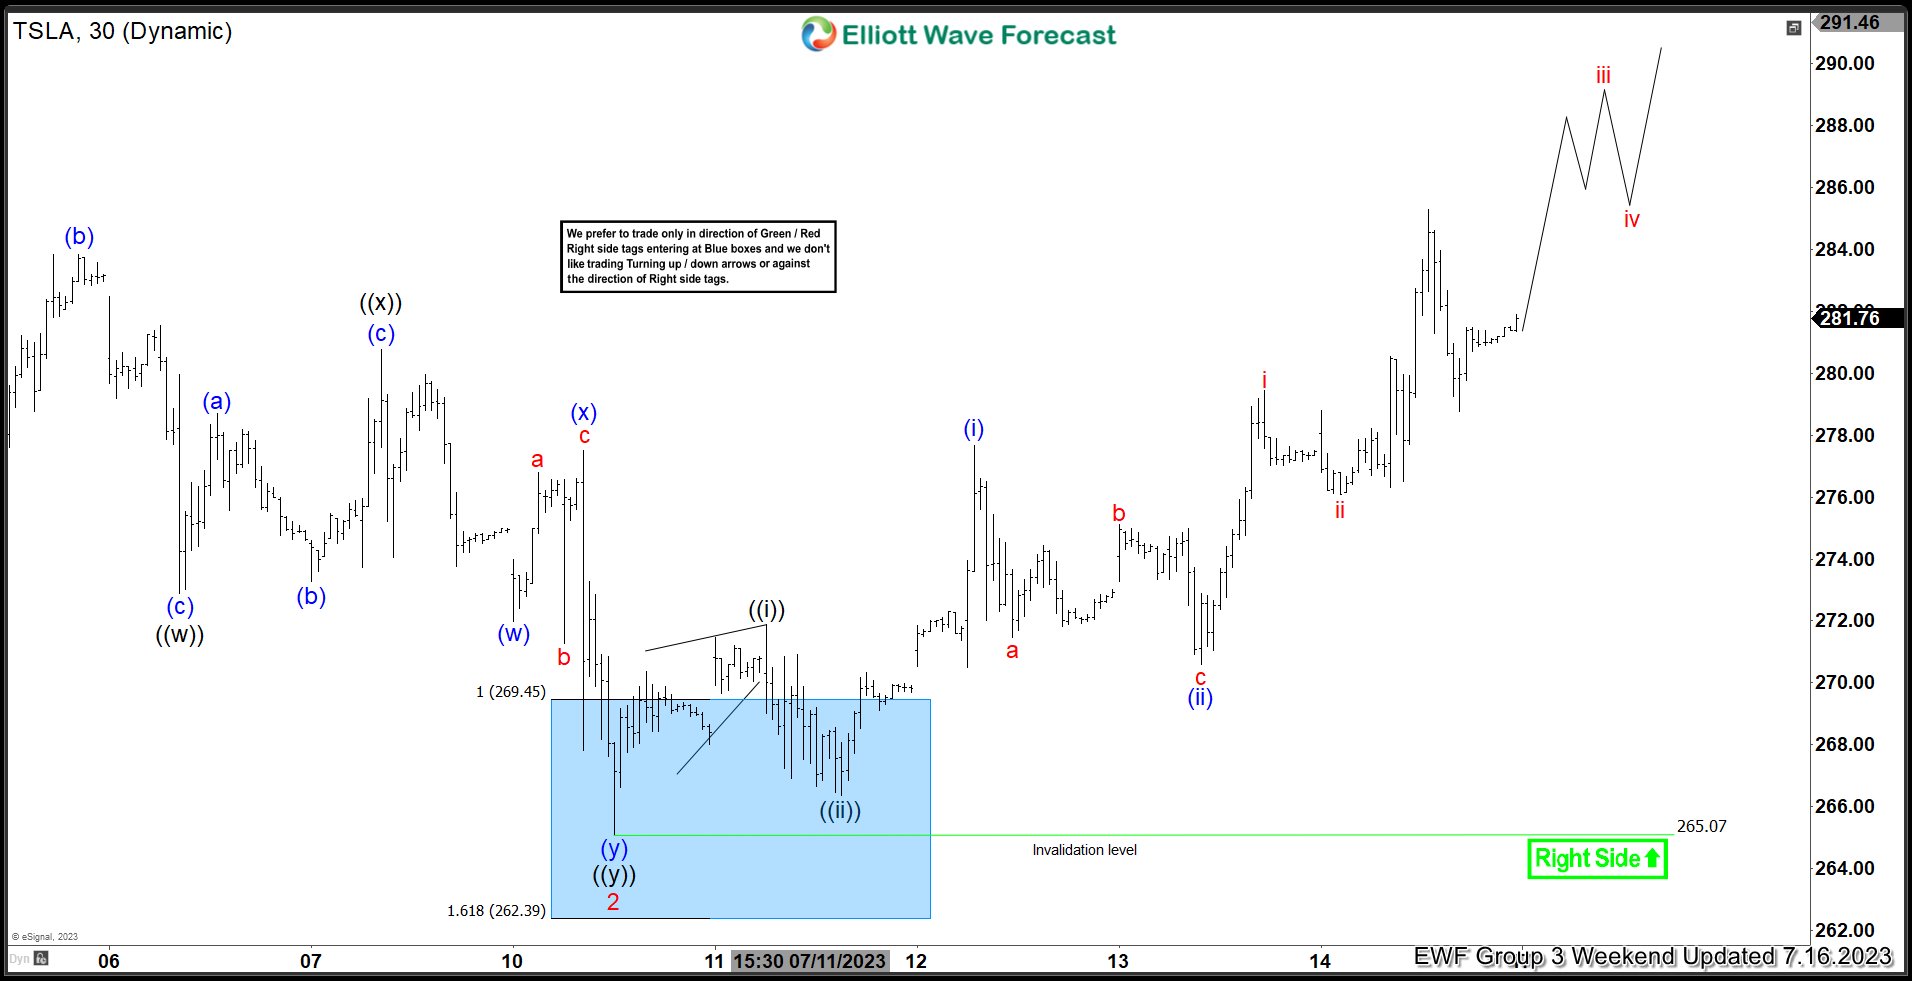
Tesla Inc. ($TSLA) Blue Box Area Wins Again. What’s Next?
Read MoreHello everyone. In today’s article, we will look at the past performance of the 1 Hour Elliott Wave chart of Tesla Inc. ($TSLA) The rally from 4.27.2023 low unfolded as a 5 wave impulse with an incomplete bullish sequence from 6.26.2023 low. So, we advised members to buy the pullback in 7 swings (WXY) at […]
-

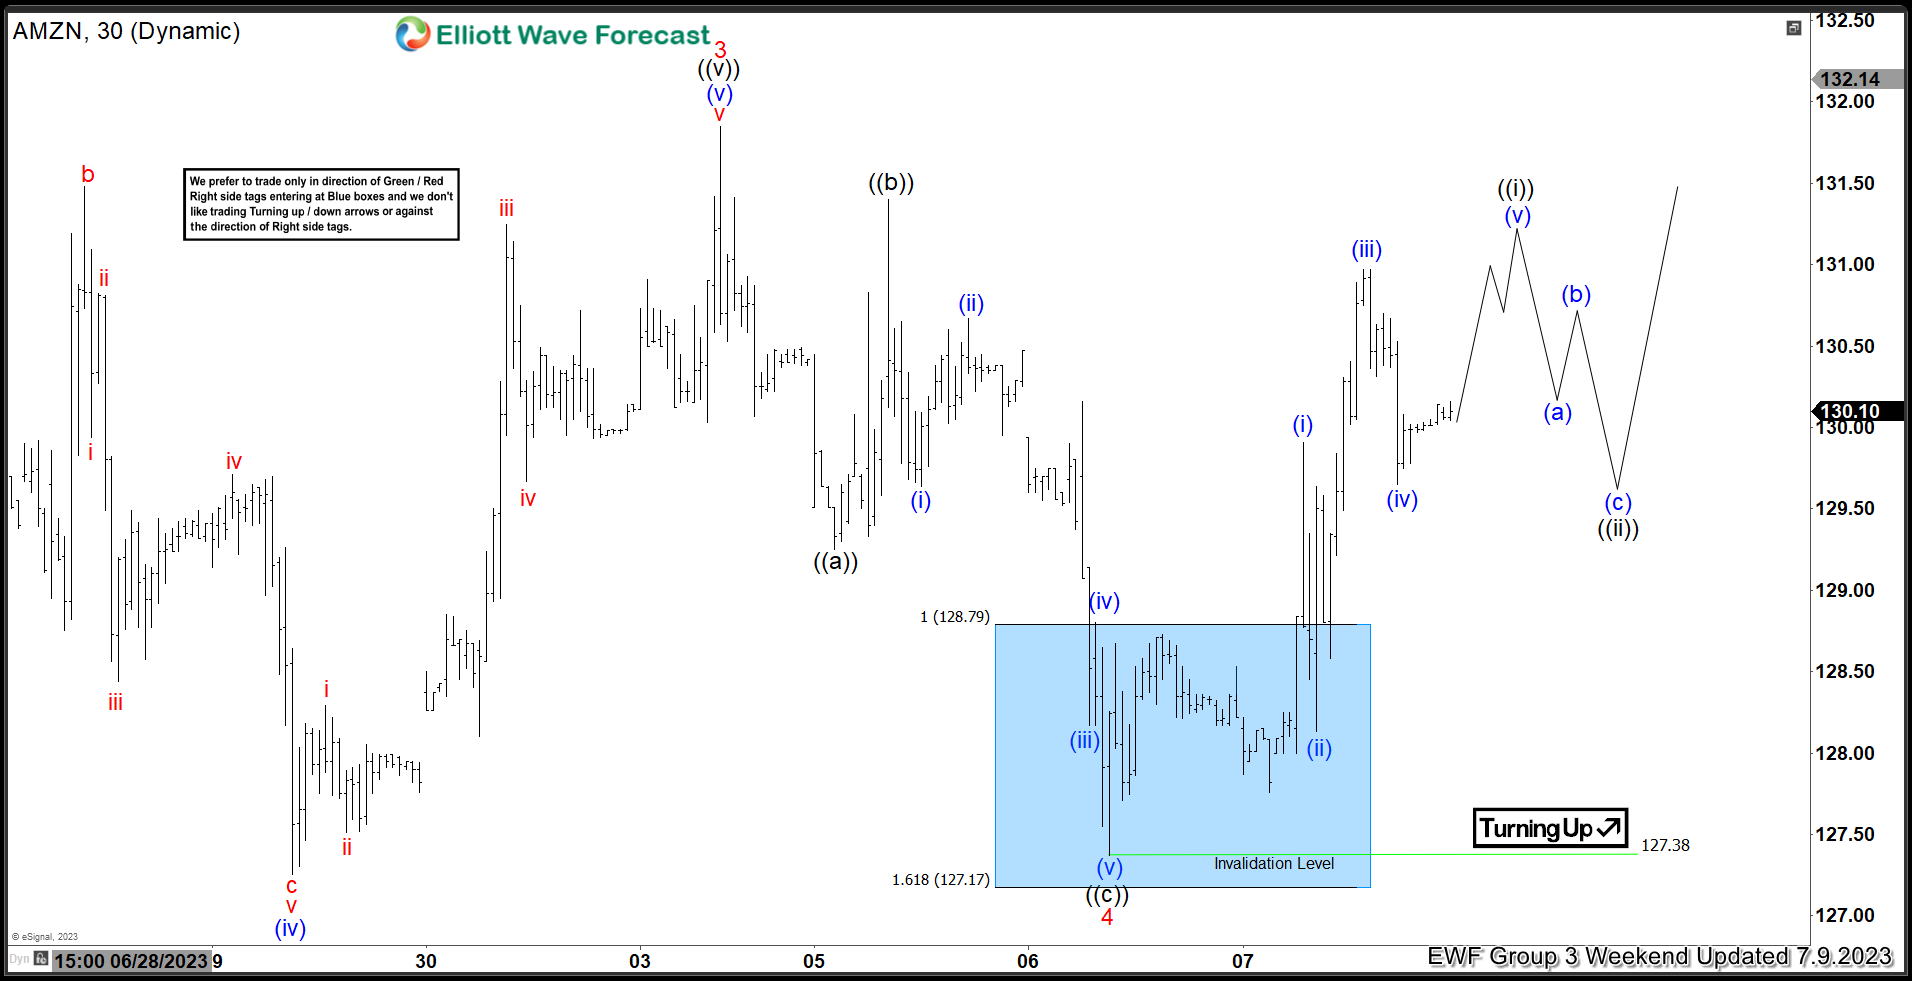
Amazon.com Inc. ($AMZN) Reacts Higher From The Blue Box Area.
Read MoreHello everyone. In today’s article, we will look at the past performance of the 1 Hour Elliott Wave chart of Amazon.com Inc. ($AMZN) The rally from 6.26.2023 low unfolded as a 5 wave impulse with an incomplete bullish sequence from 6.29.2023 low. So, we advised members to buy the pullback in 3 swings at the […]
-

AbbVie Inc. ($ABBV) Is Poised To Rally Soon From a Blue Box Area.
Read MoreHello Traders! Today, we will look at the Daily Elliott Wave structure of AbbVie Inc. ($ABBV) and explain why the stock should soon reach a Blue Box area and react higher. AbbVie Inc. is a pharmaceutical company headquartered in North Chicago, Illinois. It is ranked 6th on the list of largest biomedical companies by revenue. The company’s primary product is Humira (adalimumab) ($21 […]
-

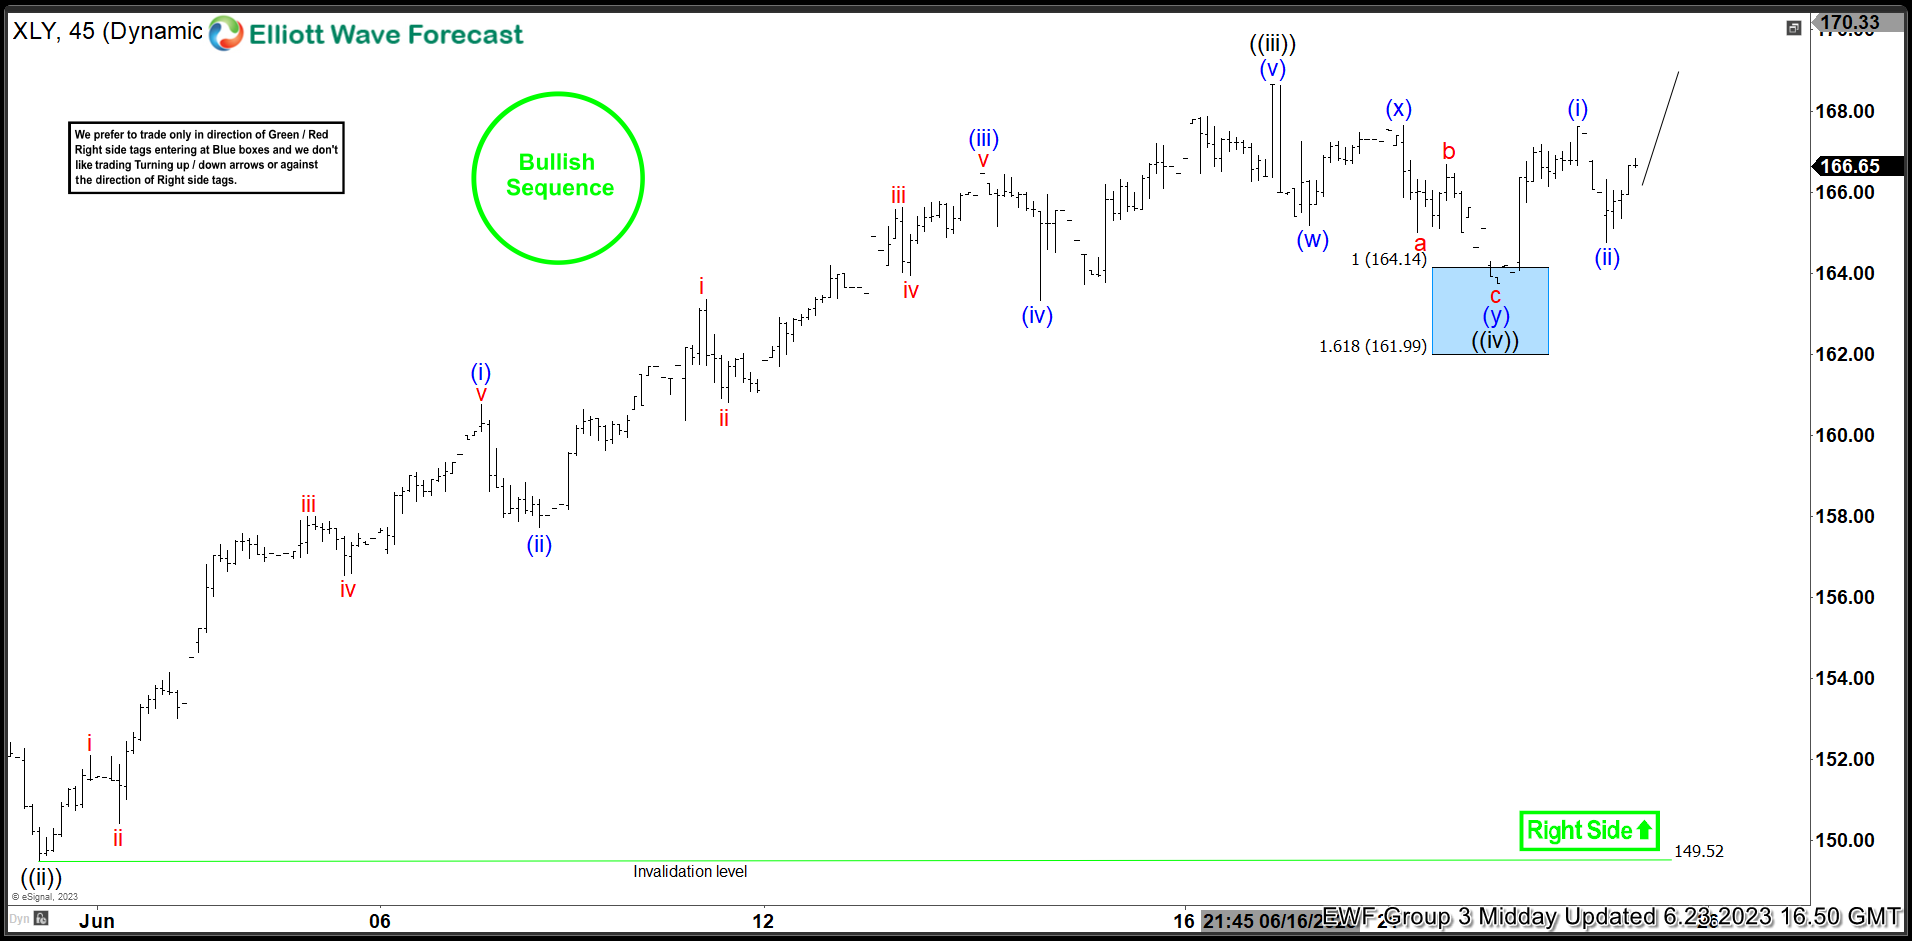
SPDR Consumer Discretionary ETF ($XLY) Blue Box Area Wins Again.
Read MoreHello everyone. In today’s article, we will look at the past performance of the 1 Hour Elliott Wave chart of SPDR Consumer Discretionary ETF ($XLY). The rally from 5.31.2023 low unfolded as a 5 wave impulse with an incomplete bullish sequence from 5.25.2023 low. So, we advised members to buy the pullback in 3 swings […]
-

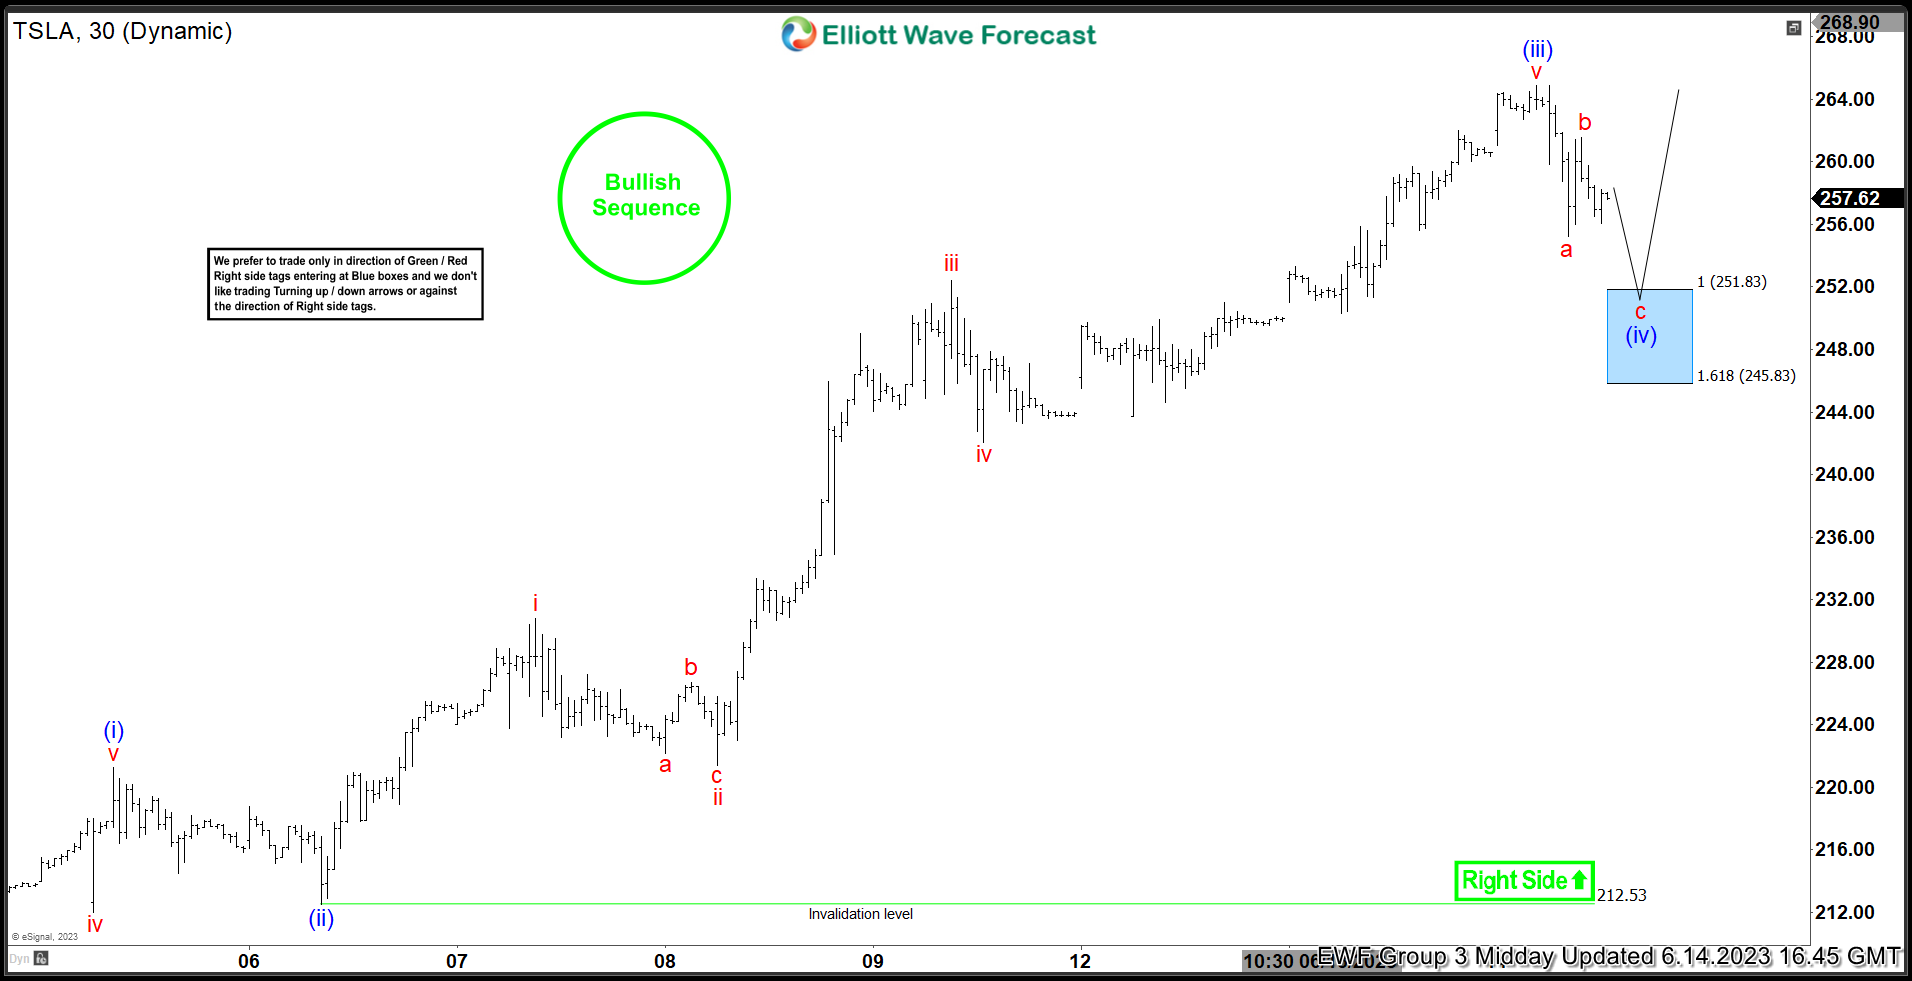
Tesla Inc. ($TSLA) Reacts Higher From The Blue Box Area.
Read MoreHello everyone. In today’s article, we will look at the past performance of the 1 Hour Elliott Wave chart of Tesla Inc. ($TSLA) The rally from 6.06.2023 low unfolded as a 5 wave impulse with an incomplete bullish sequence from 5.31.2023 low. So, we advised members to buy the pullback in 3 swings at the […]
-

Elliott Wave Suggests GameStop Corp. ($GME) is Poised To Rally.
Read MoreHello Traders and Investors. In today’s article, we will take a look at the Elliott Wave structure of GameStop ($GME) and explain why a tremendous rally might be happening to the stock in the near term. Before we dive into the chart, I want to explain that the overall structure looks like a nest. A nest […]
