
-
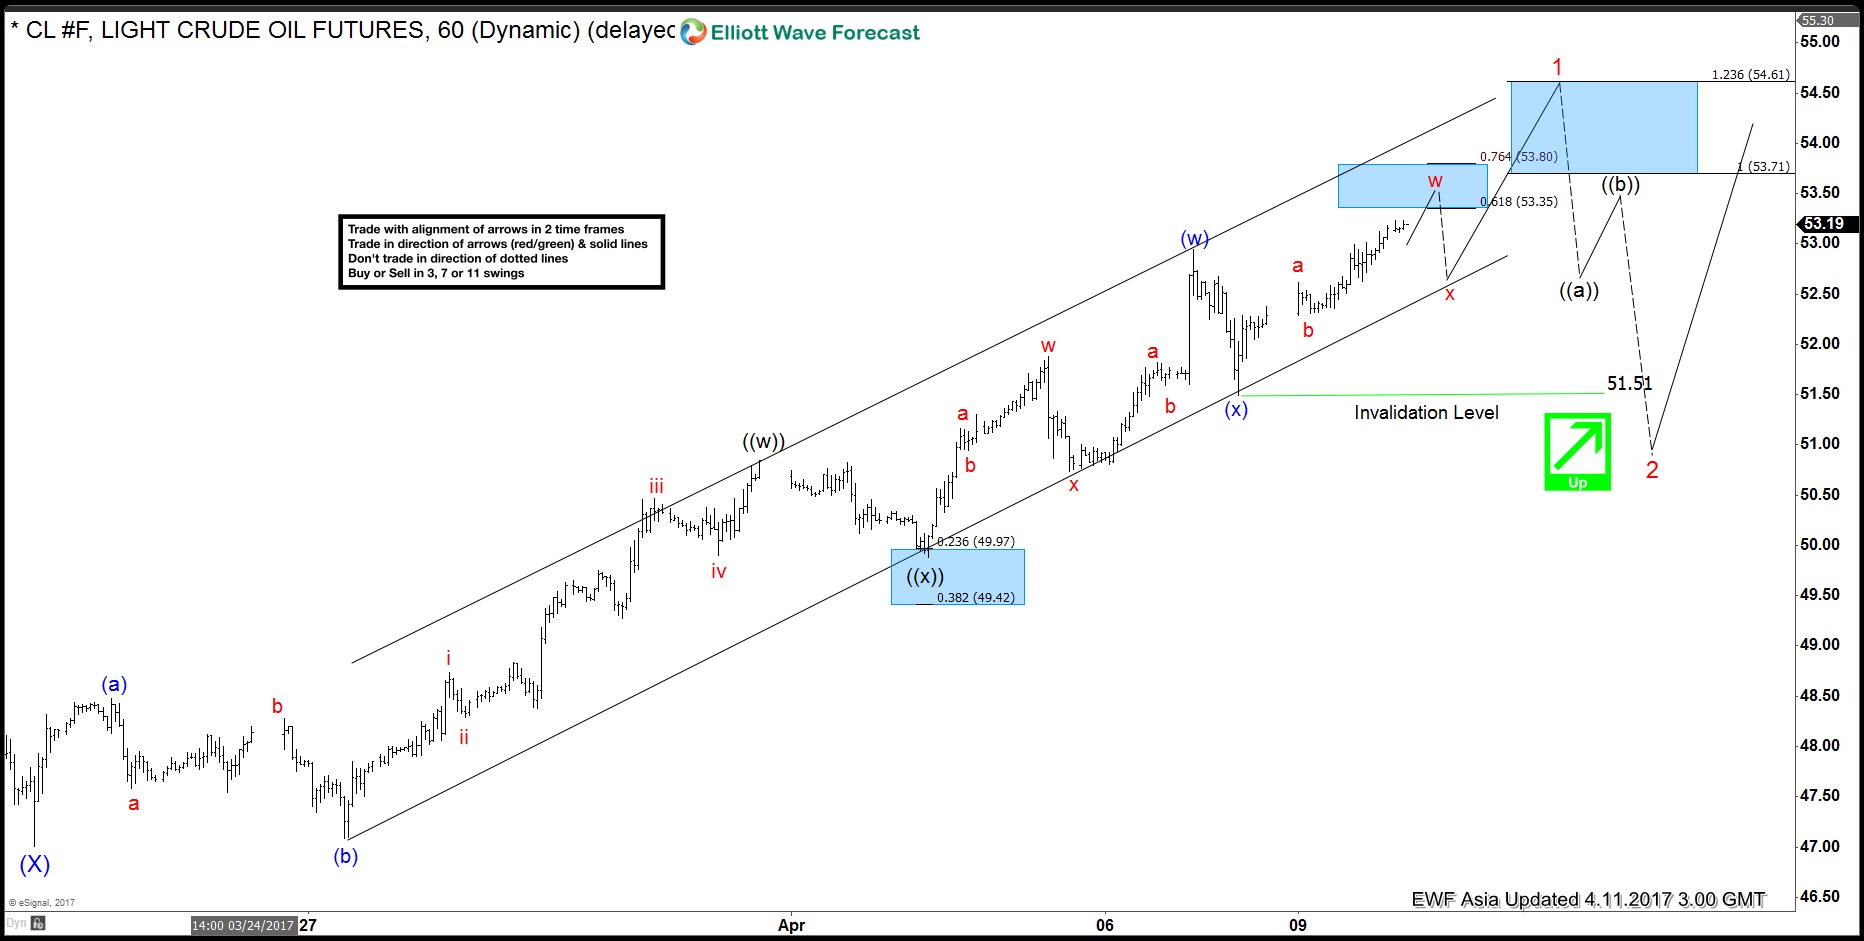
CL_F Elliott Wave View: Ending a cycle – Elliott Wave Forecast
Read MoreShort term Elliott Wave view in Crude Oil (CL_F) suggests that cycle from 3/22 low (47.01) is unfolding as a double three Elliott wave structure where Minute wave ((w)) ended at 50.85 and Minute wave ((x)) ended at 49.88. Minute wave ((y)) is in progress and the internal is unfolding also as a double three Elliott wave […]
-
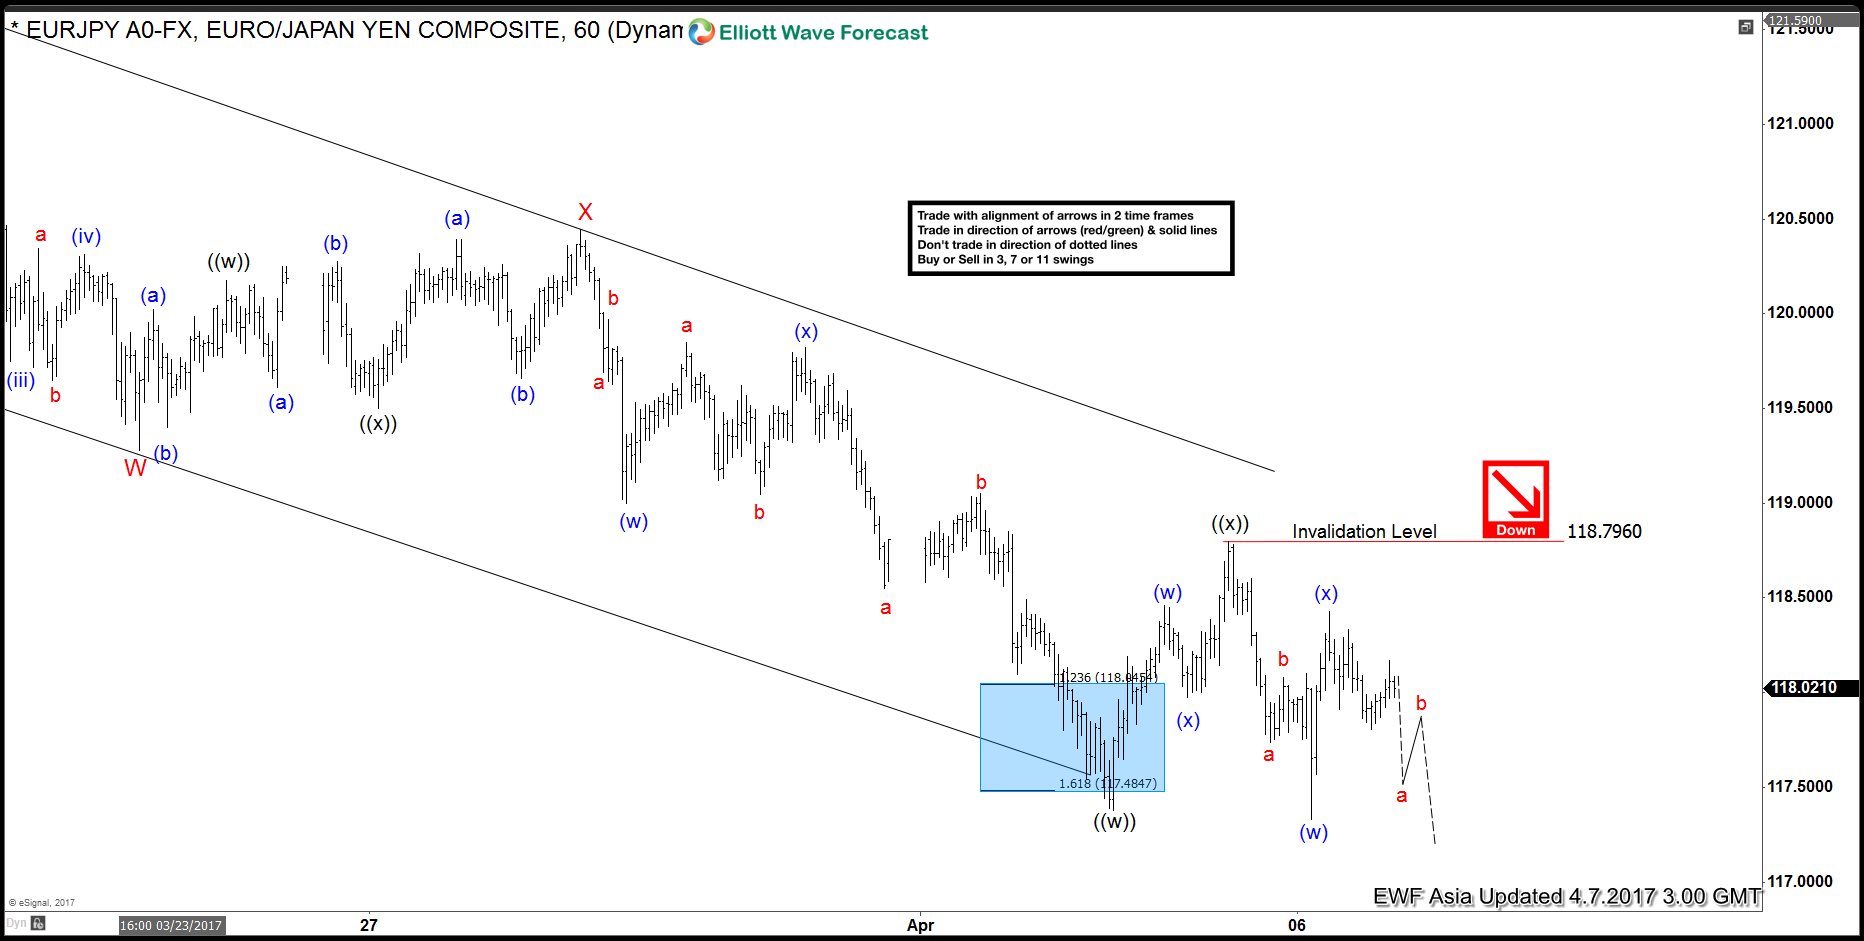
EURJPY Elliott wave View: Further downside
Read MoreShort term Elliott Wave view in EURJPY suggests that cycle from 3/12 peak (122.89) is unfolding as a double three Elliott wave structure where Minor wave W ended at 119.28 and Minor wave X ended at 120.45. Minor wave Y is in progress and the internal is unfolding also as a double three Elliott wave […]
-
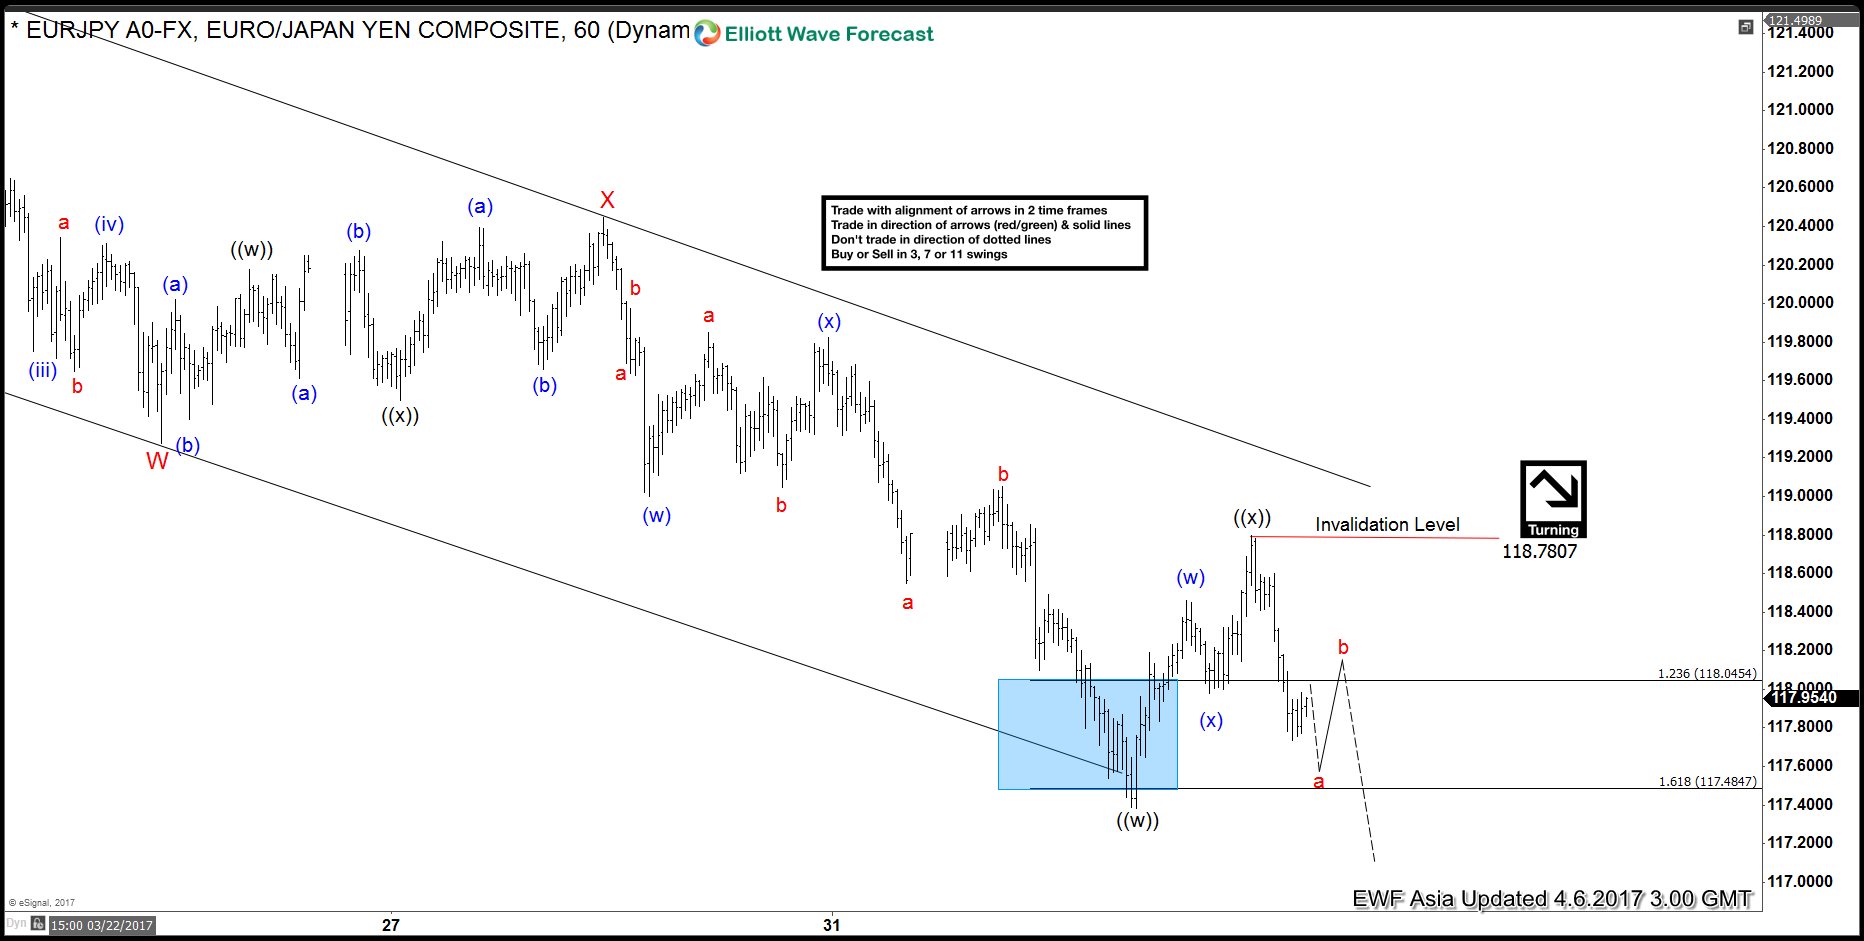
EURJPY Elliott wave View: Continuation lower
Read MoreShort term Elliott Wave view in EURJPY suggests that cycle from 3/12 peak (122.89) is unfolding as a double three Elliott wave structure where Minor wave W ended at 119.28 and Minor wave X ended at 120.45. Minor wave Y is in progress and the internal is unfolding also as a double three Elliott wave […]
-
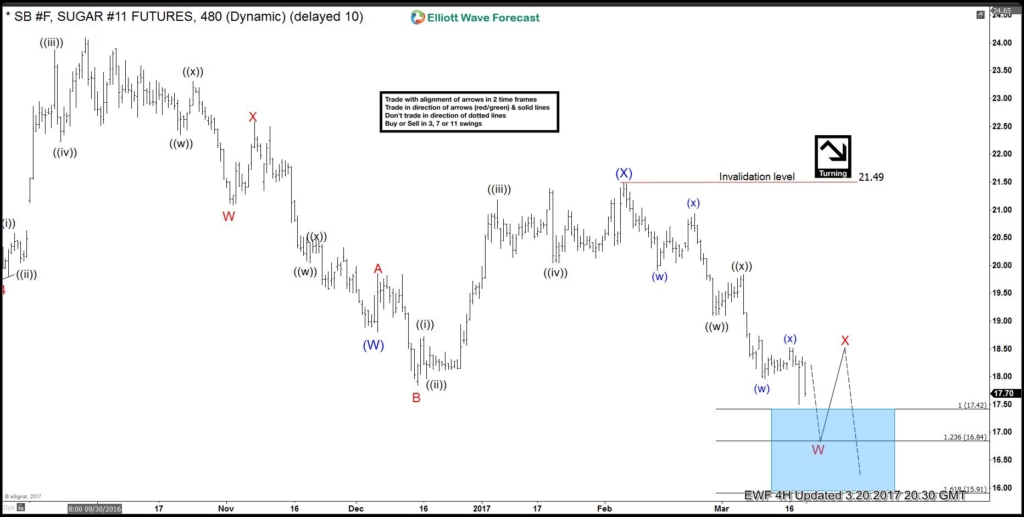
Charting the Decline in Raw Sugar (SB_F)
Read MoreThe sentiment for Raw Sugar (SB_F) has turned sour recently. After bottoming at 10.16 cents in 2015, Raw sugar futures have rallied strongly until it peaked at 24 cents last Fall. In fact, Raw Sugar was one of the best performing commodities in 2016, rising around 30% (see table below as of November last year) […]
-
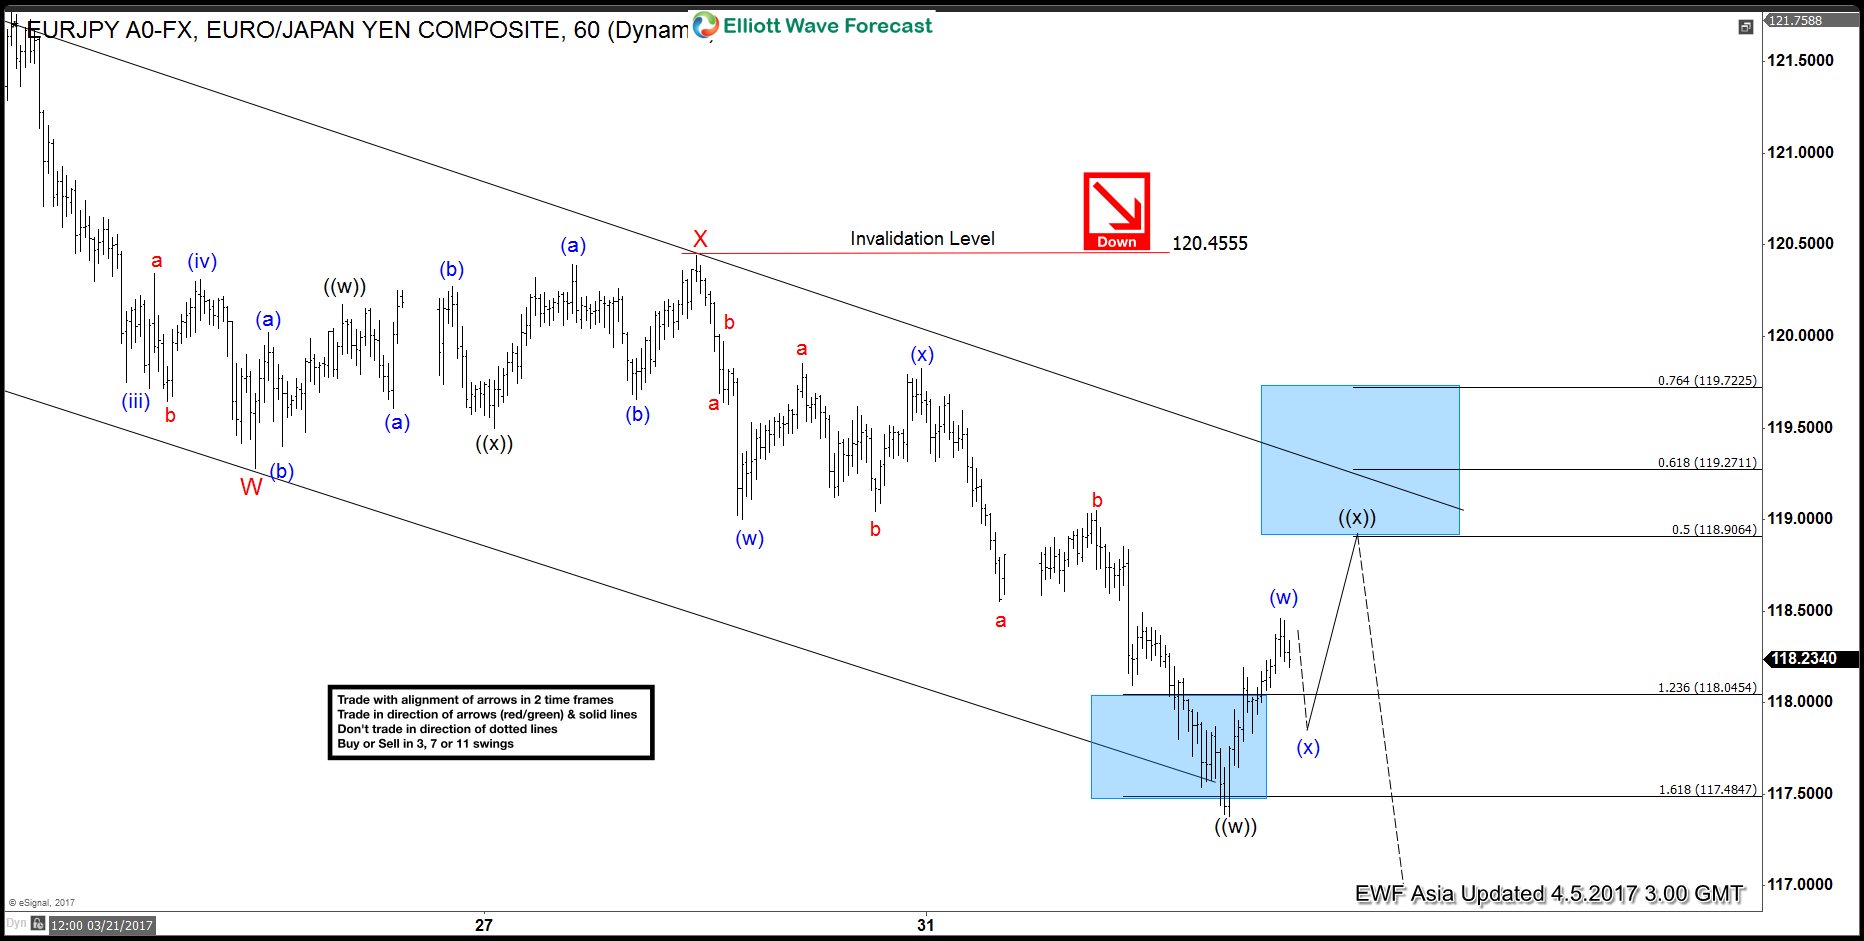
EURJPY Elliott wave View: Correction in progress
Read MoreShort term Elliott Wave view in EURJPY suggests that cycle from 3/12 peak (122.89) is unfolding as a double three Elliott wave structure where Minor wave W ended at 119.28 and Minor wave X ended at 120.45. Minor wave Y is in progress and the internal is unfolding also as a double three Elliott wave […]
-
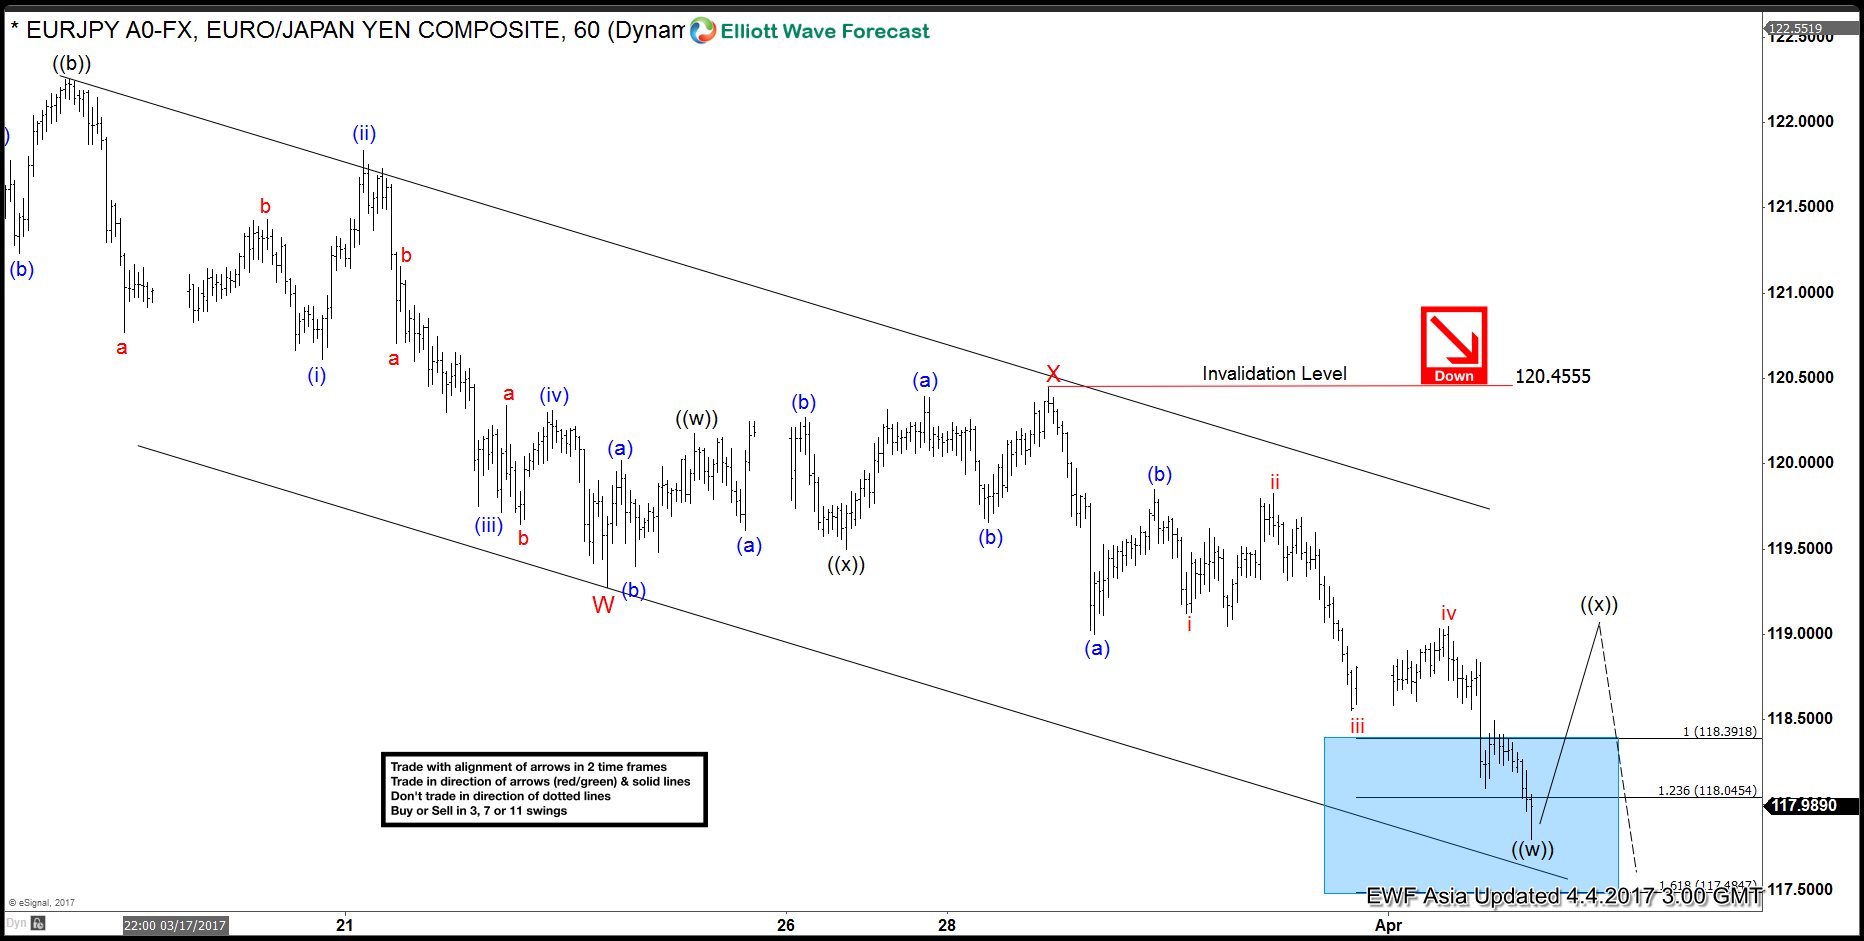
EURJPY Elliott wave View: More downside
Read MoreShort term Elliott Wave view in EURJPY suggests that cycle from 3/12 peak (122.89) is unfolding as a double three Elliott wave structure where Minor wave W ended at 119.28 and Minor wave X ended at 120.45. Minor wave Y is in progress and the internal is unfolding also as a double three Elliott wave […]