
-
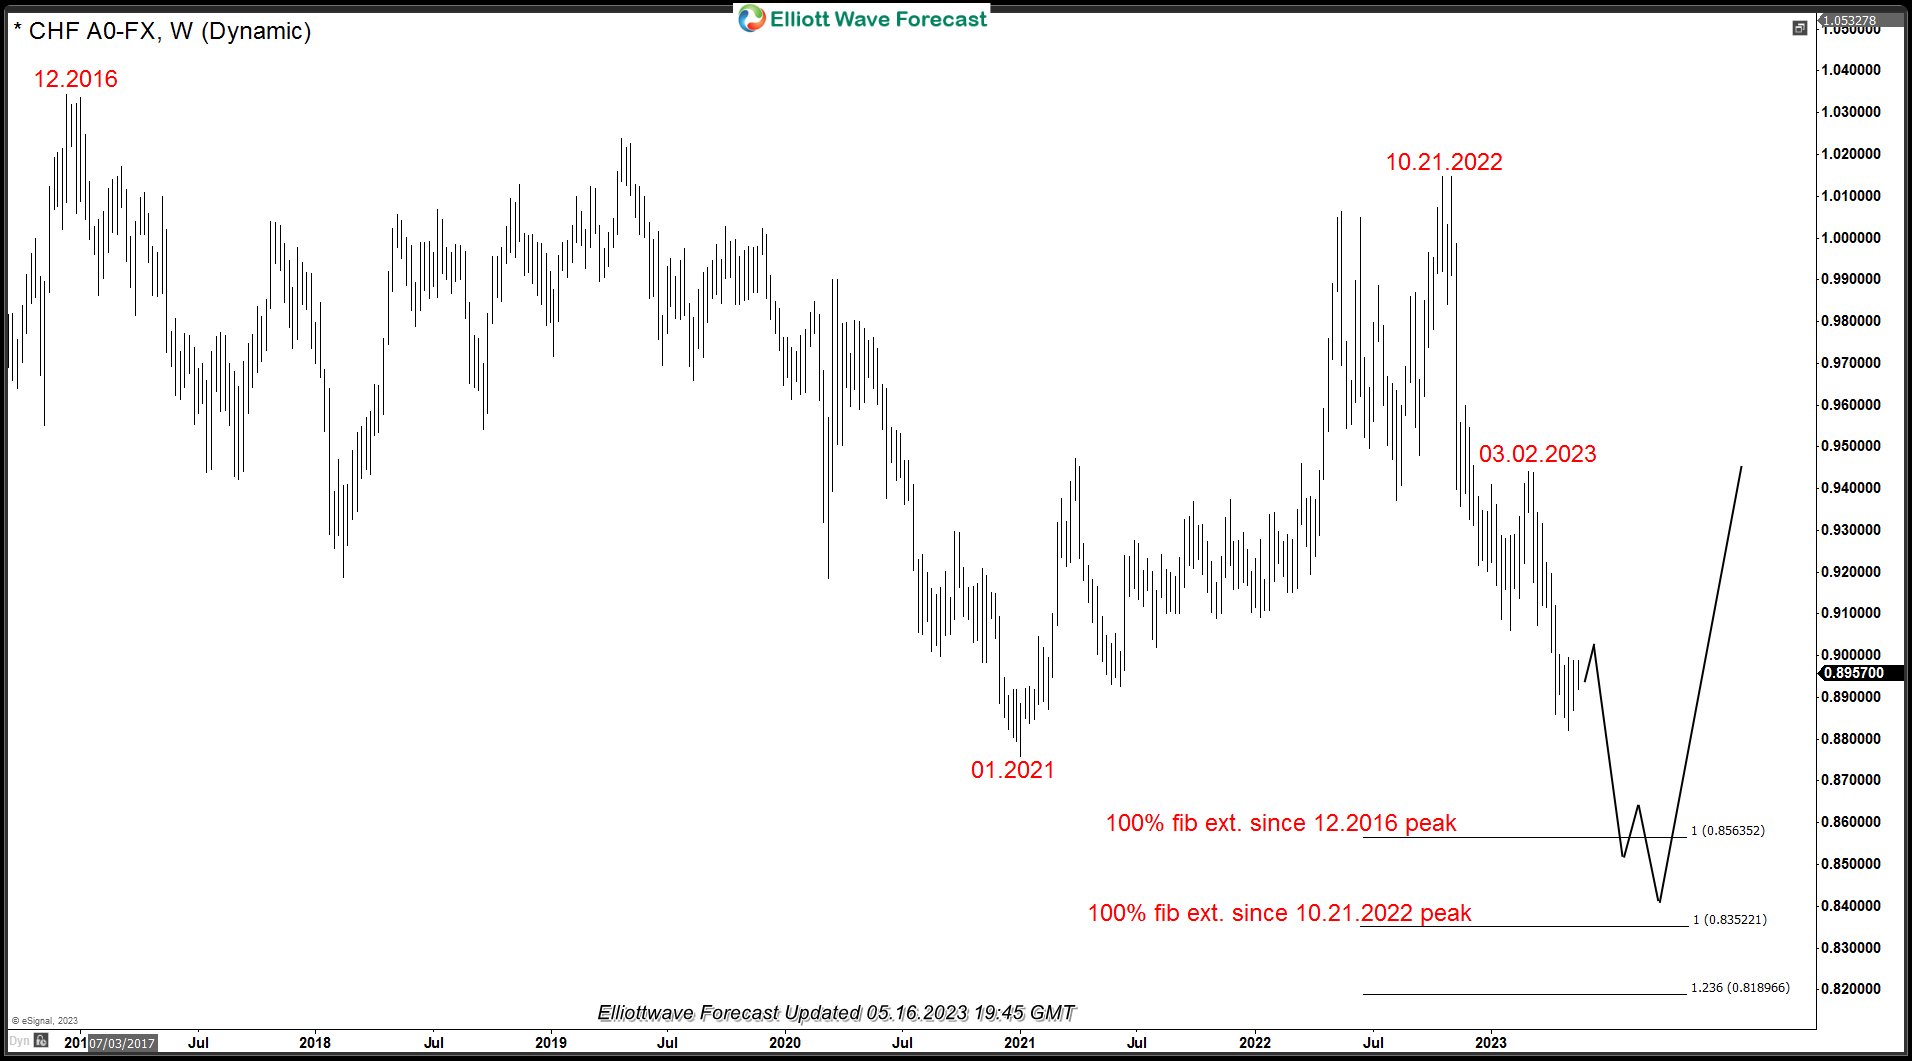
USDCHF: Elliott Wave Bearish Sequence & Next Extreme Areas
Read MoreUSDCHF has seen a strong decline since October 2022 peak with shallow bounces in-between. In today’s blog, we will take a look at the Elliott wave structure of the decline from October 21, 2022 peak, market sequence and next extreme areas which should be potential entry areas for both sellers and buyers. We will also […]
-

Palladium Futures: Incomplete Bearish Sequence & Next Buying Area
Read MoreIn this article, we look at incomplete sequences in Palladium Futures and USDMXN and how we can combine the two to forecast the swings in Palladium and look for possible trading opportunities as well. We explain the long-term and mid-term Elliott wave view for Palladium and combine it with the cycles and sequences in USDMXN […]
-
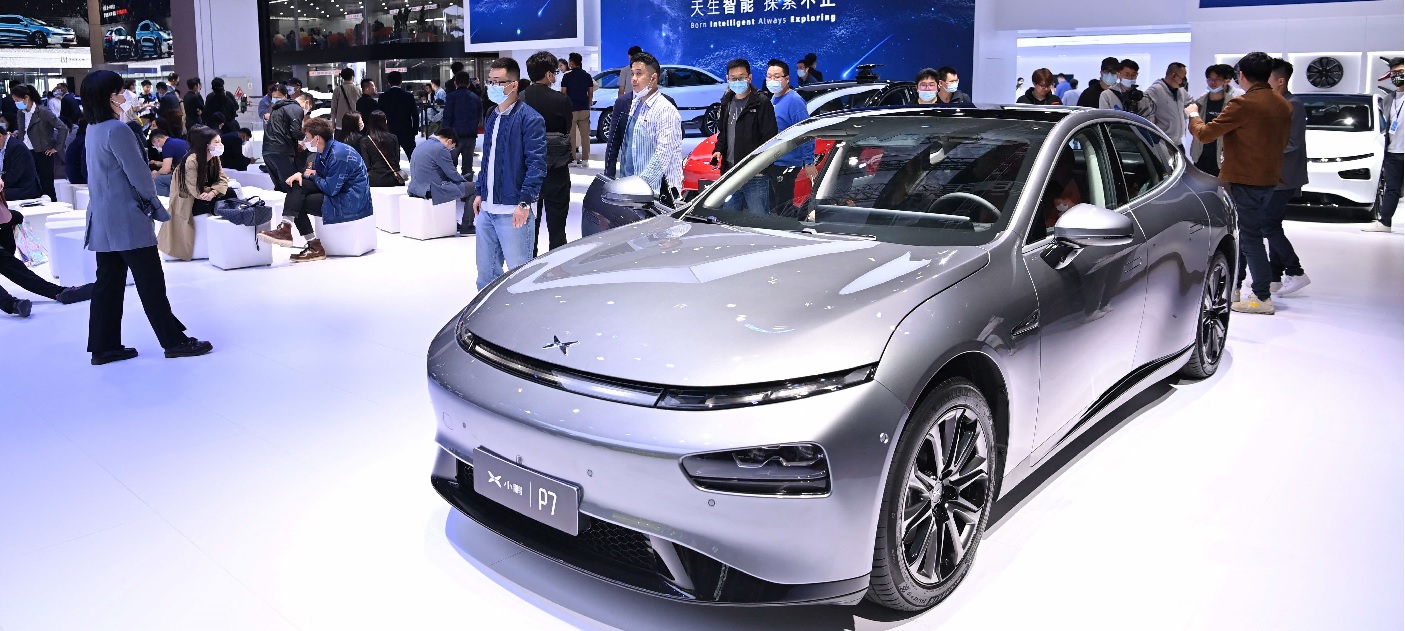
XPEV Elliott Wave Analysis: More Selling or Buyers to Appear Soon?
Read MoreXPeng, Inc. (XPEV) designs, develops, manufactures, and markets smart electric vehicles. It produces environmental friendly vehicles, namely SUVs (the G3), and a four-door sports sedan (the P7). The company was founded by Xiao Peng He, Heng Xia, and Tao He in 2015 and is headquartered in Guangzhou, China. It put in a strong rally since […]
-
![[Webinar Recording] Are Tech Stocks The Next Generational Opportunity?](https://elliottwave-forecast.com/wp-content/uploads/2023/03/Tech-Stocks-Webinar.png)
[Webinar Recording] Are Tech Stocks The Next Generational Opportunity?
Read MoreTech stocks have long been the driving force of innovation and growth in the stock market. With advancements in fields such as artificial intelligence, 5G networks, and cloud computing, the tech industry is poised for even more growth and disruption in the coming years. The next generation of technology presents an exciting opportunity for investors […]
-
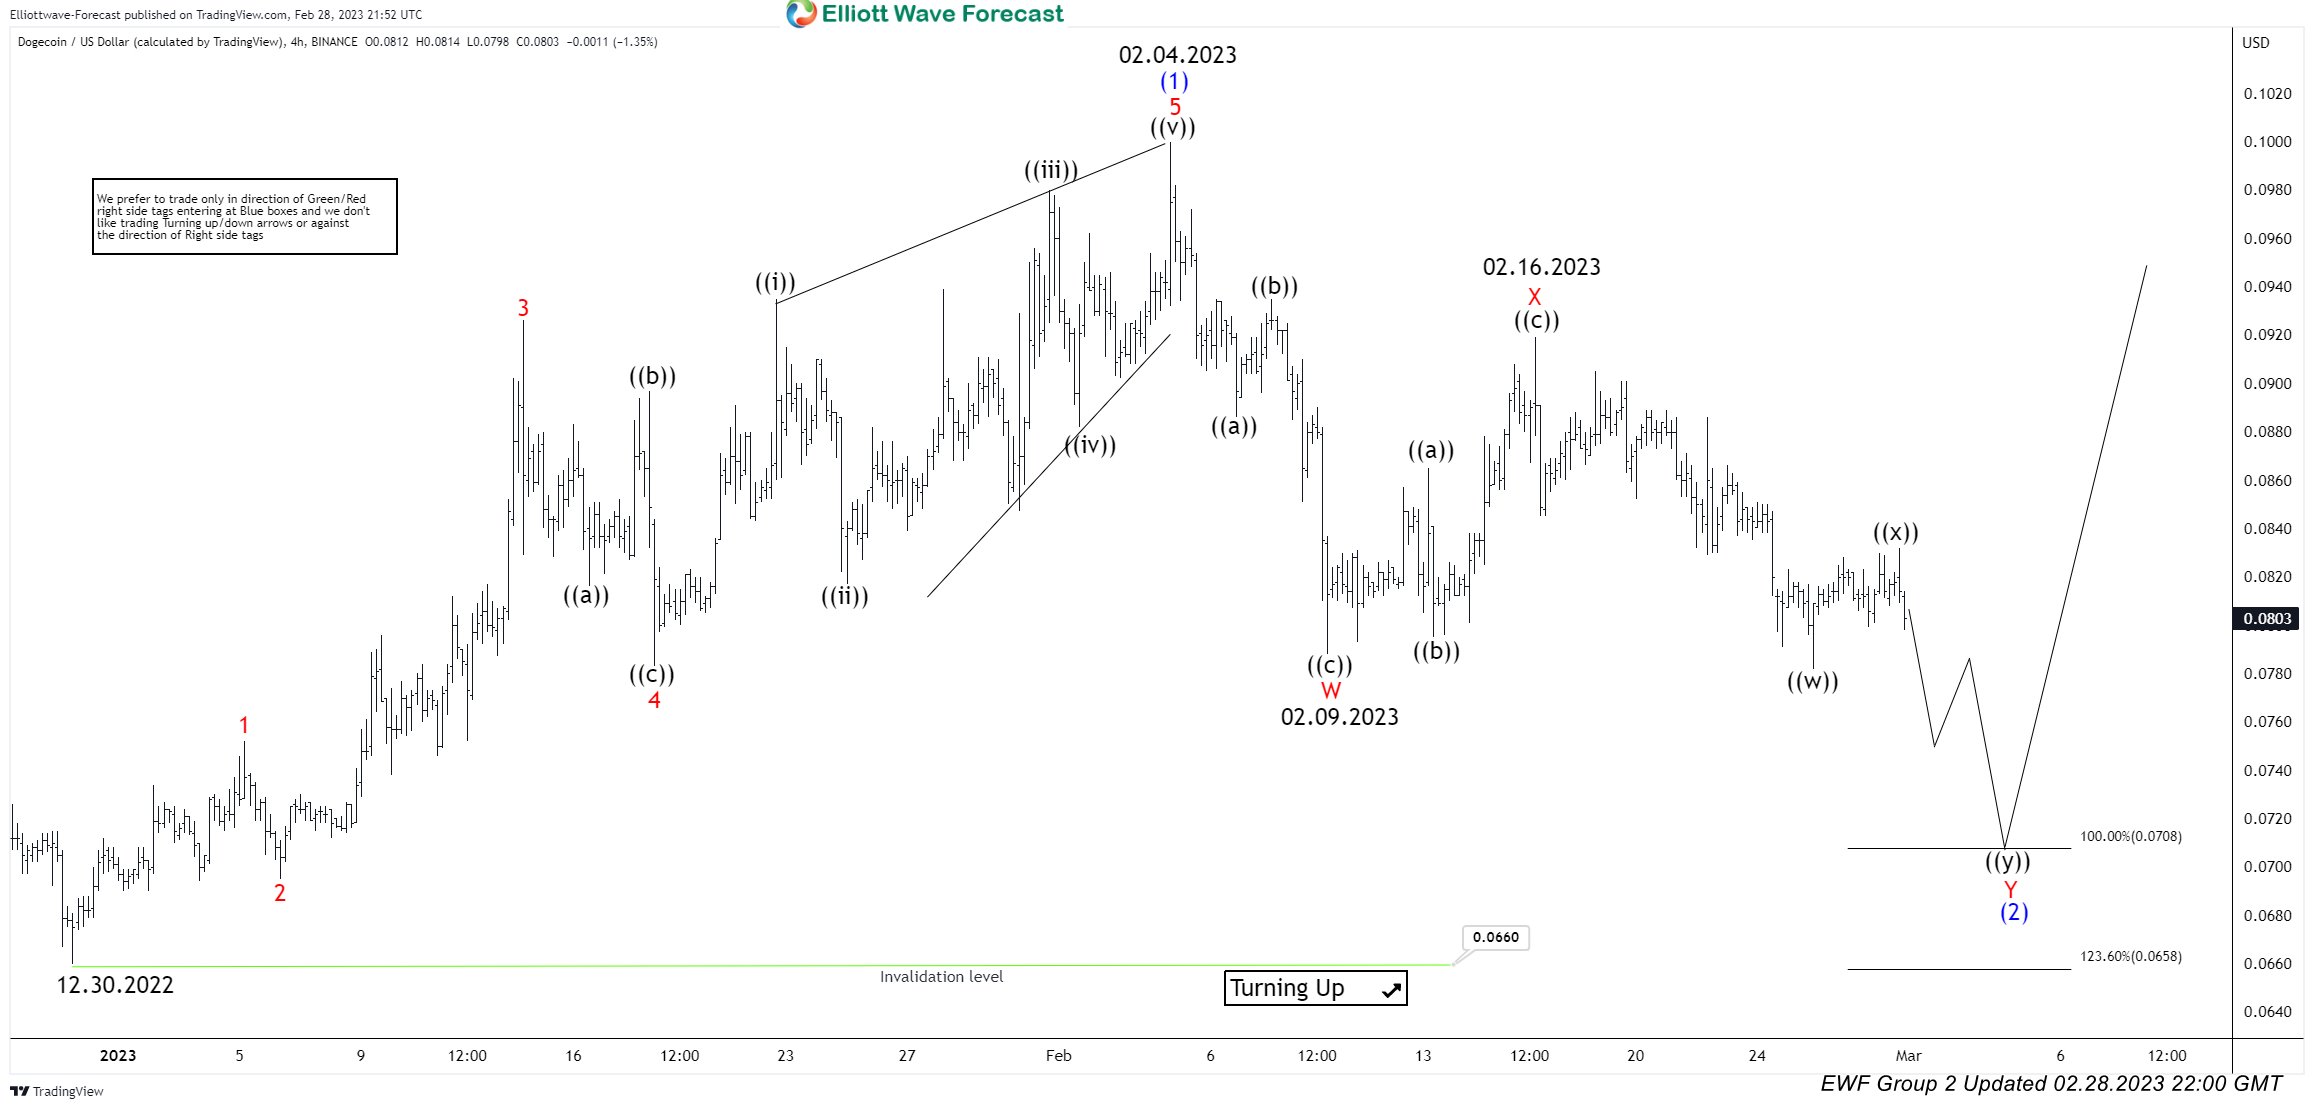
Dogecoin (DOGE.X) Calling Decline & Incomplete Elliott Wave Sequence
Read MoreDogecoin (DOGE.X) is a cryptocurrency created by software engineers Billy Markus and Jackson Palmer, who decided to create a payment system as a “joke”. It is considered both the first “meme coin”, and, more specifically, the first “dog coin”. It is an open-source peer-to-peer digital currency, favoured by Shiba Inus worldwide. At its heart, Dogecoin is the […]
-
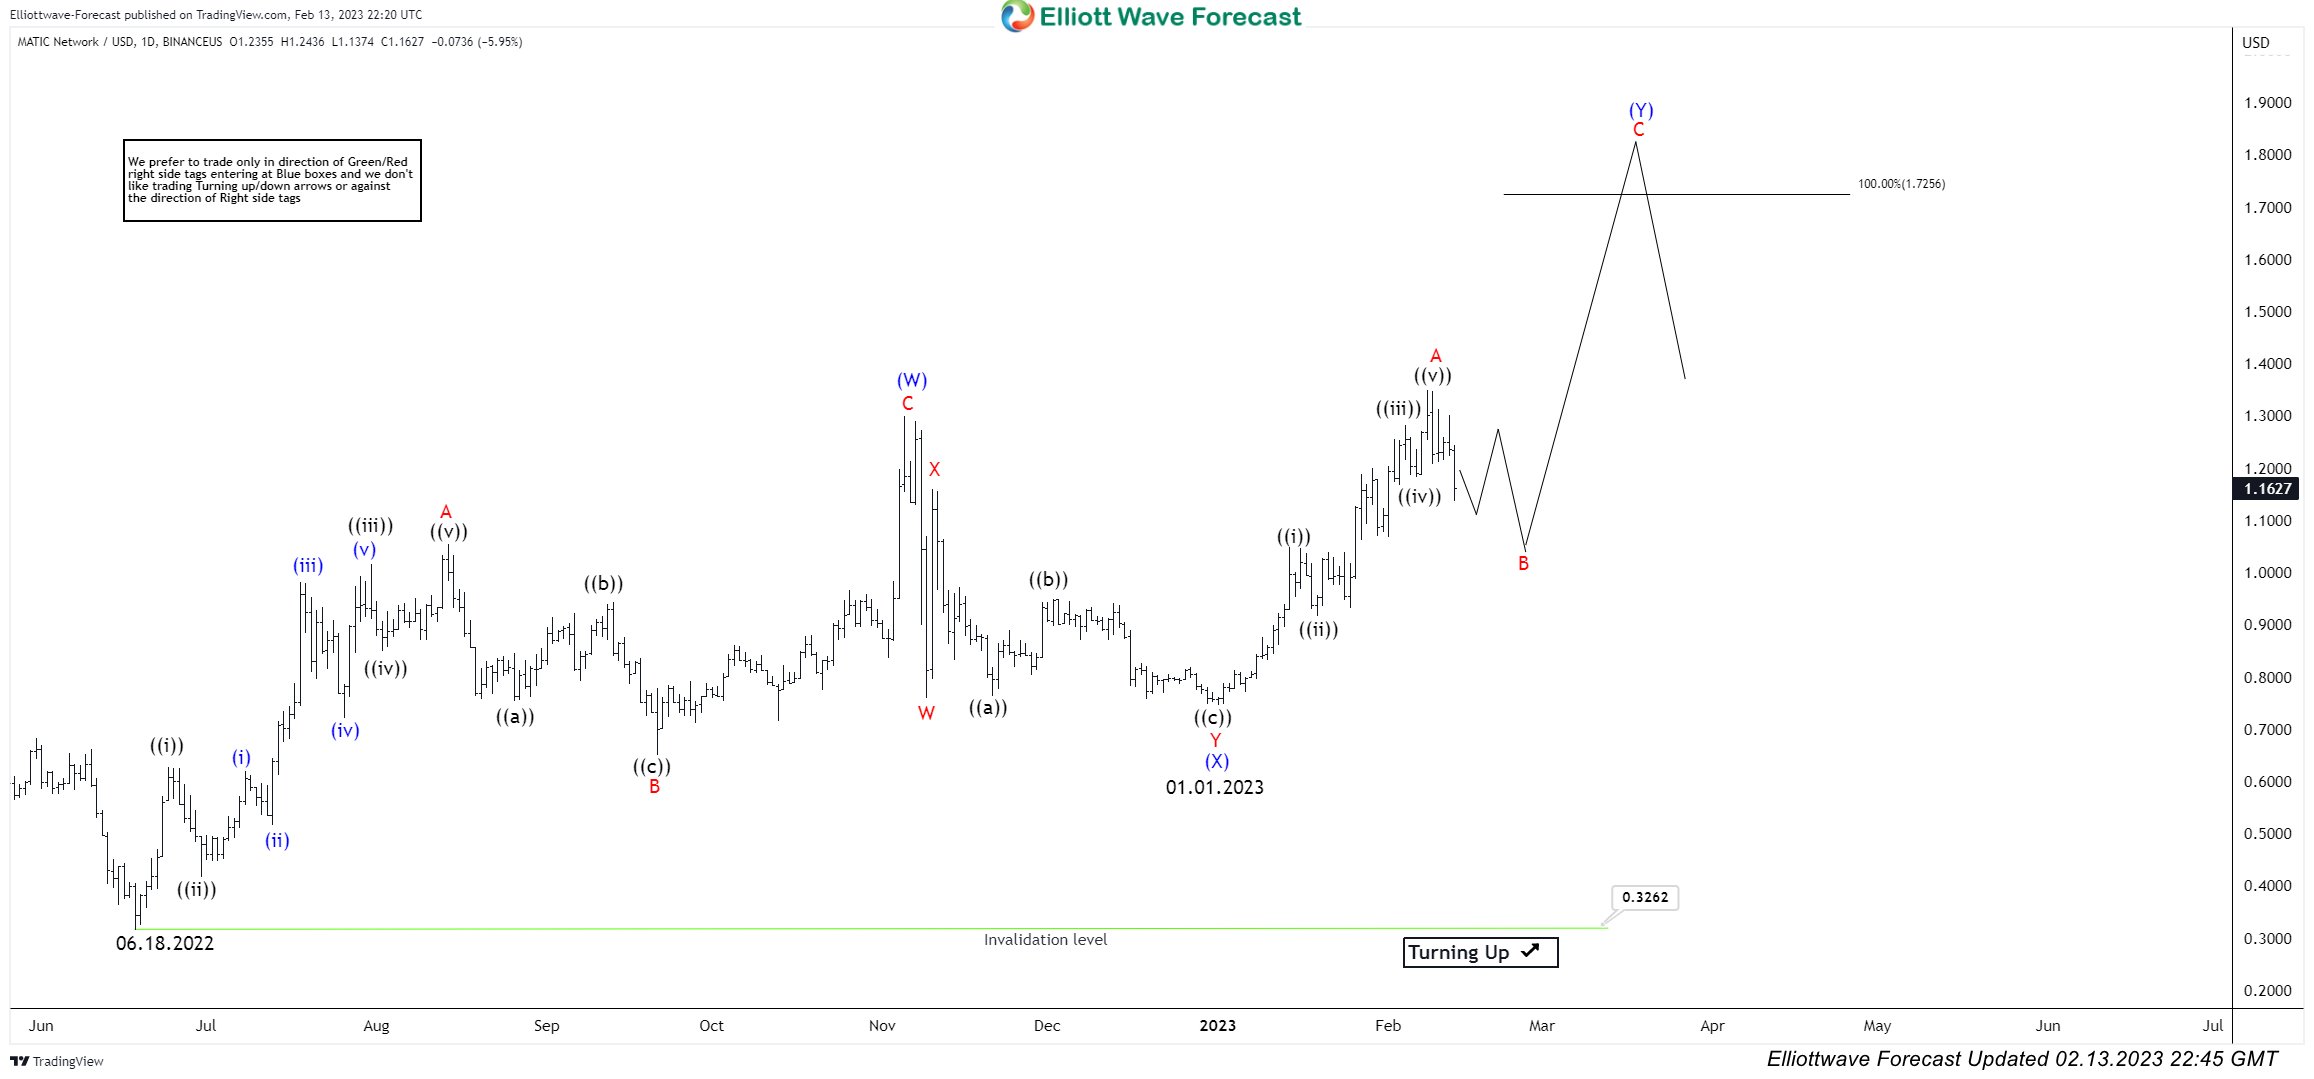
Increased coverage of Cryptocurrencies: ADA, MATIC and DOGE
Read MoreWe at Elliottwave-Forecast.Com have been providing coverage of Bitcoin (BTCUSD), Ethereum (ETHUSD) and Litecoin (LTCUSD) for the last few years. We always received a lot of requests both from memebrs and non-members to increase our coverage of cryptocurrencies by adding more coins. We have listened to the feedback and added three new cryptocurrencies in our […]