-

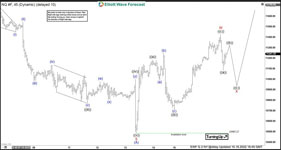
Nasdaq ($NQ_F) Forecasting The Rally After 3 Waves Pullback
Read MoreIn this article we’re going to take a quick look at the Elliott Wave charts of $NQ_F, published in members area of the website. As our members know Nasdaq ended cycle from the 13740.55 high as 5 waves, and now in a recovery to correct this decline. According to Elliott wave theory, after a 5 waves impulsive […]
-

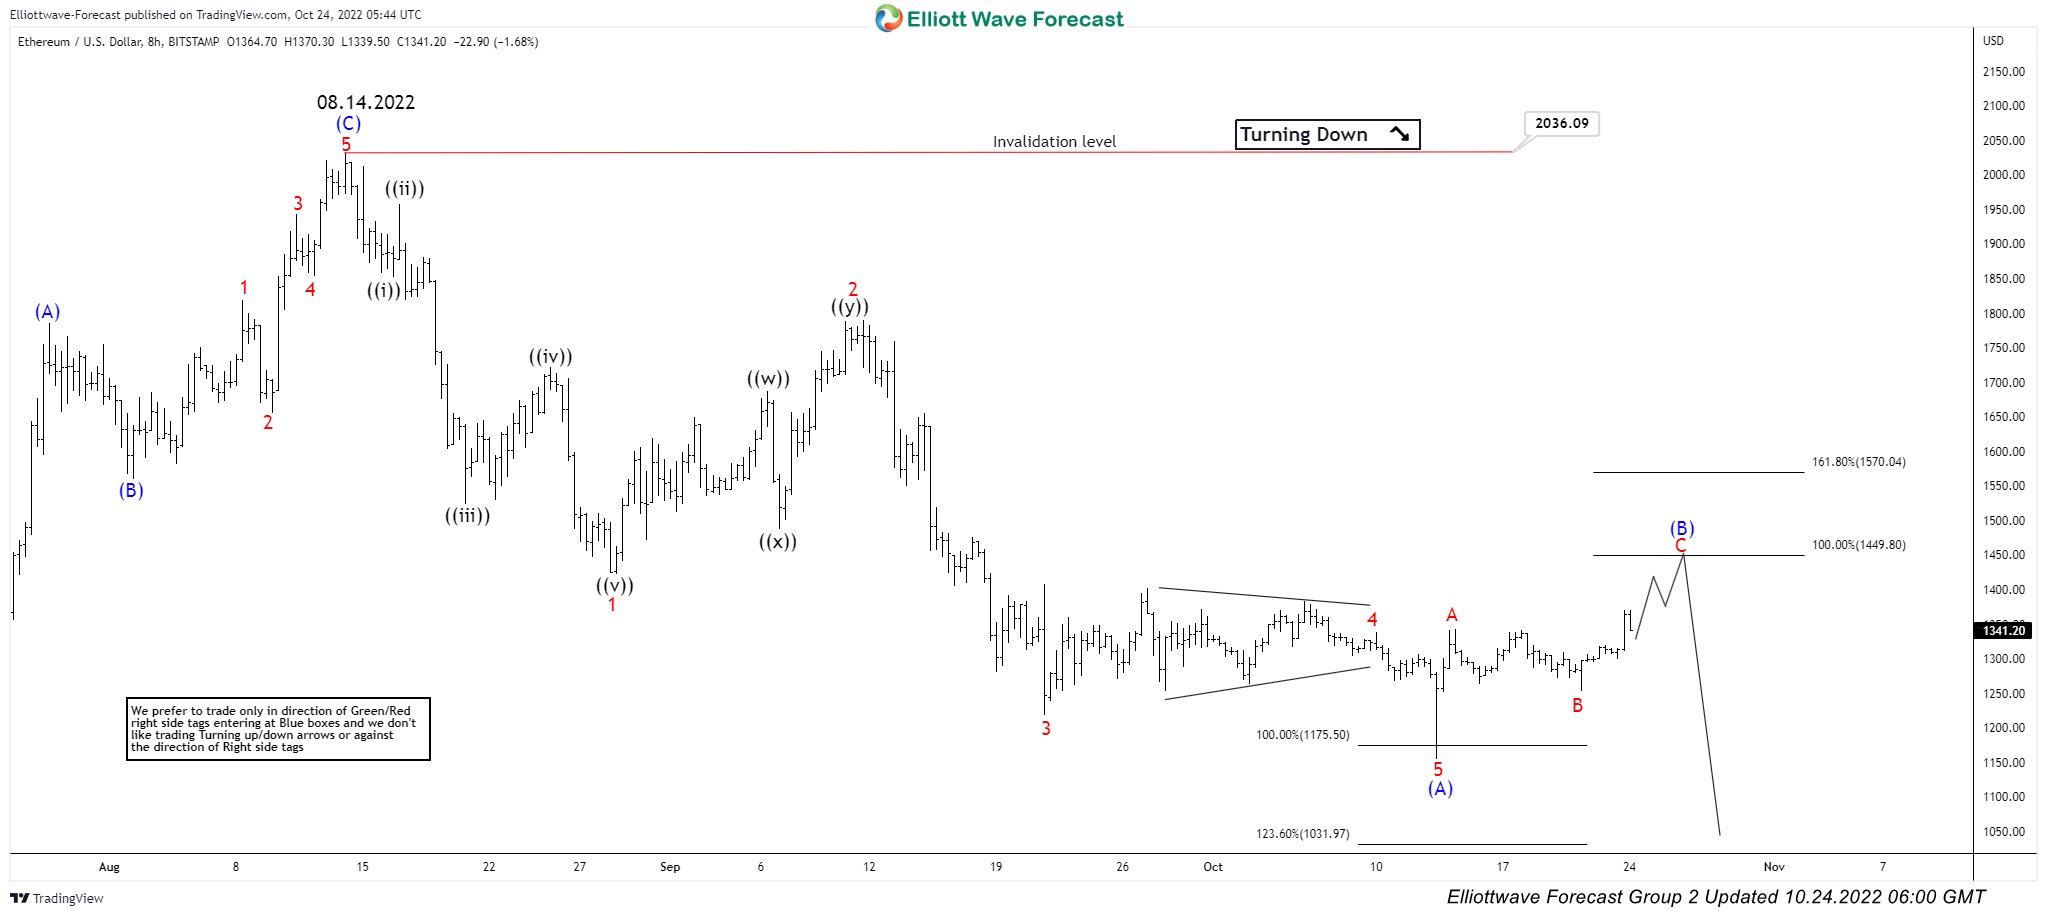
ETHUSD Impulsive Decline Calls for More Downside
Read MoreETHUSD (Ethereum) is one of the three crypto-currencies covered as a regular instrument at Elliottwave-Forecast. Other two crypto-currencies we cover on a regular basis are BTCUSD (Bitcoin) and LTCUSD (Litecoin). In today’s article, we will be looking at Ethereum which has been dropping since forming a high on 08.14.2022. It dropped 43% from 2036 to […]
-

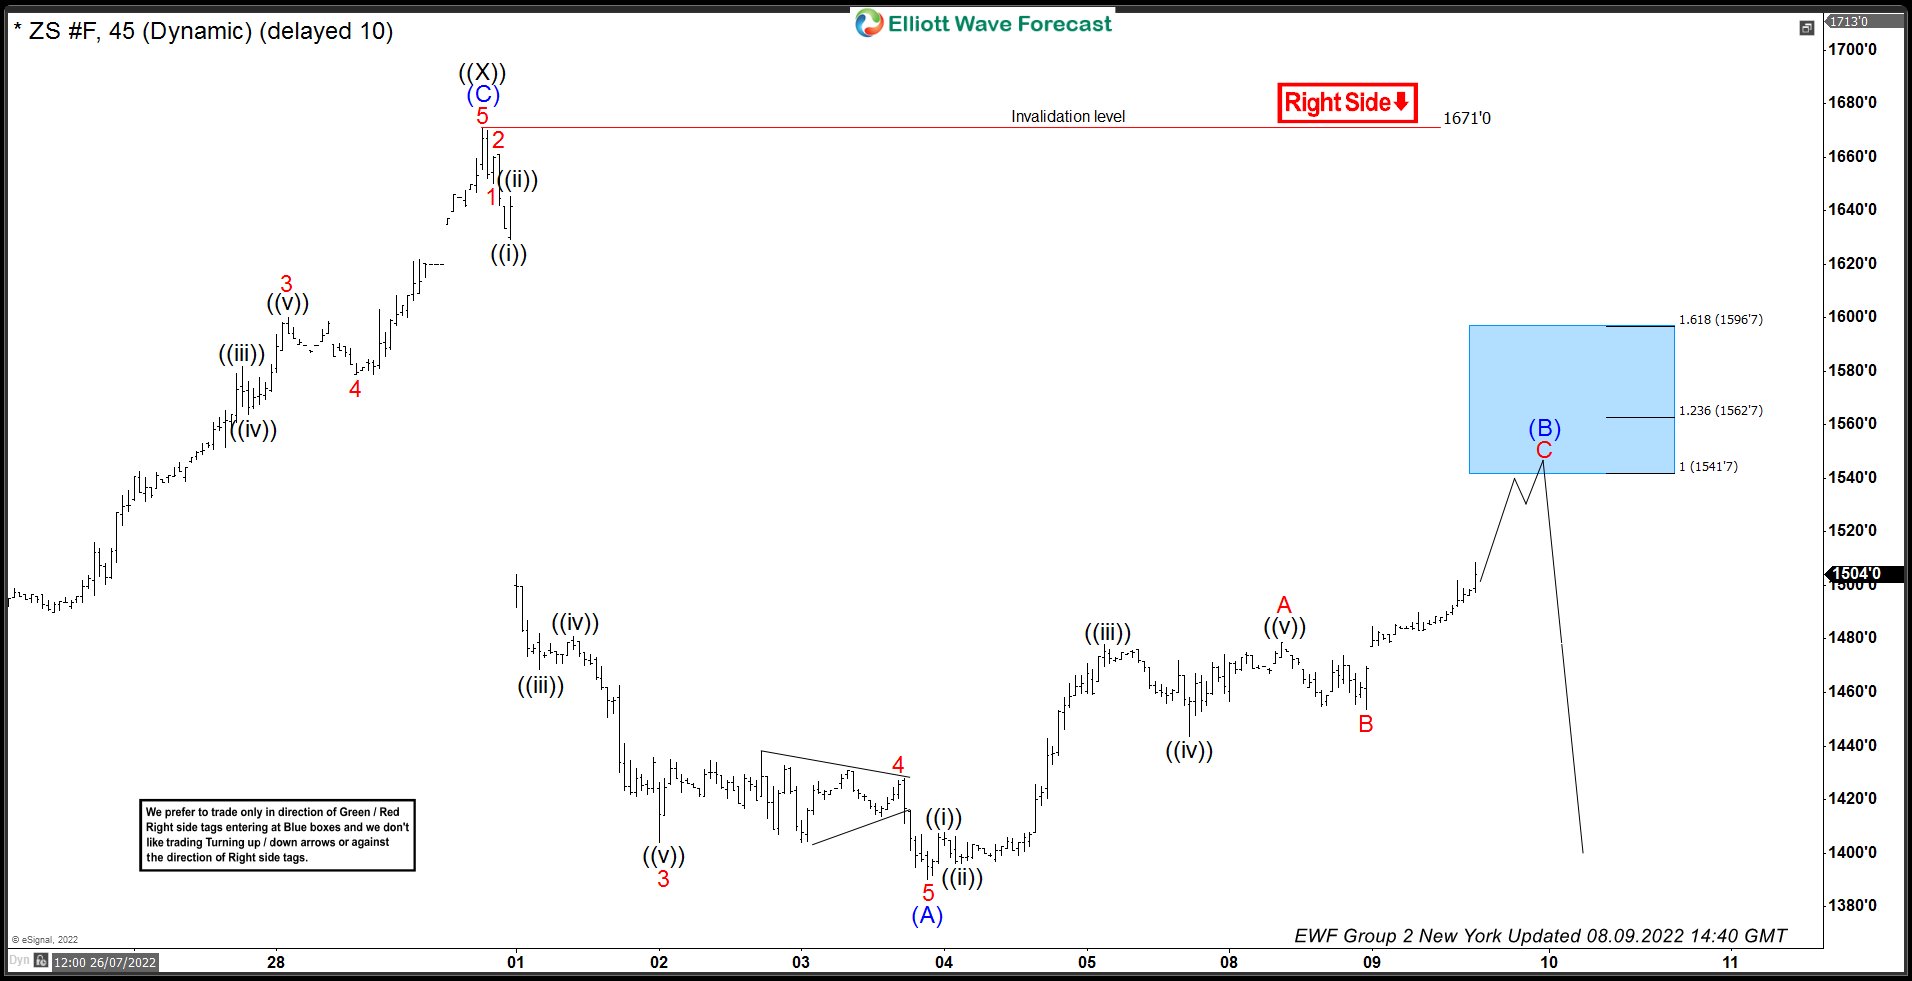
ZS_F Forecasting The Rally And Selling In Blue Box
Read MoreIn this technical blog we’re going to take a quick look at the Elliott Wave charts of ZS_F (Soybean futures) published in members area of the website. As our members knew, we’ve been favoring the short side in ZS_F (Soybean futures) due to incomplete bearish sequence down from June 9, 2022 peak against July 29, 2022 peak. […]
-

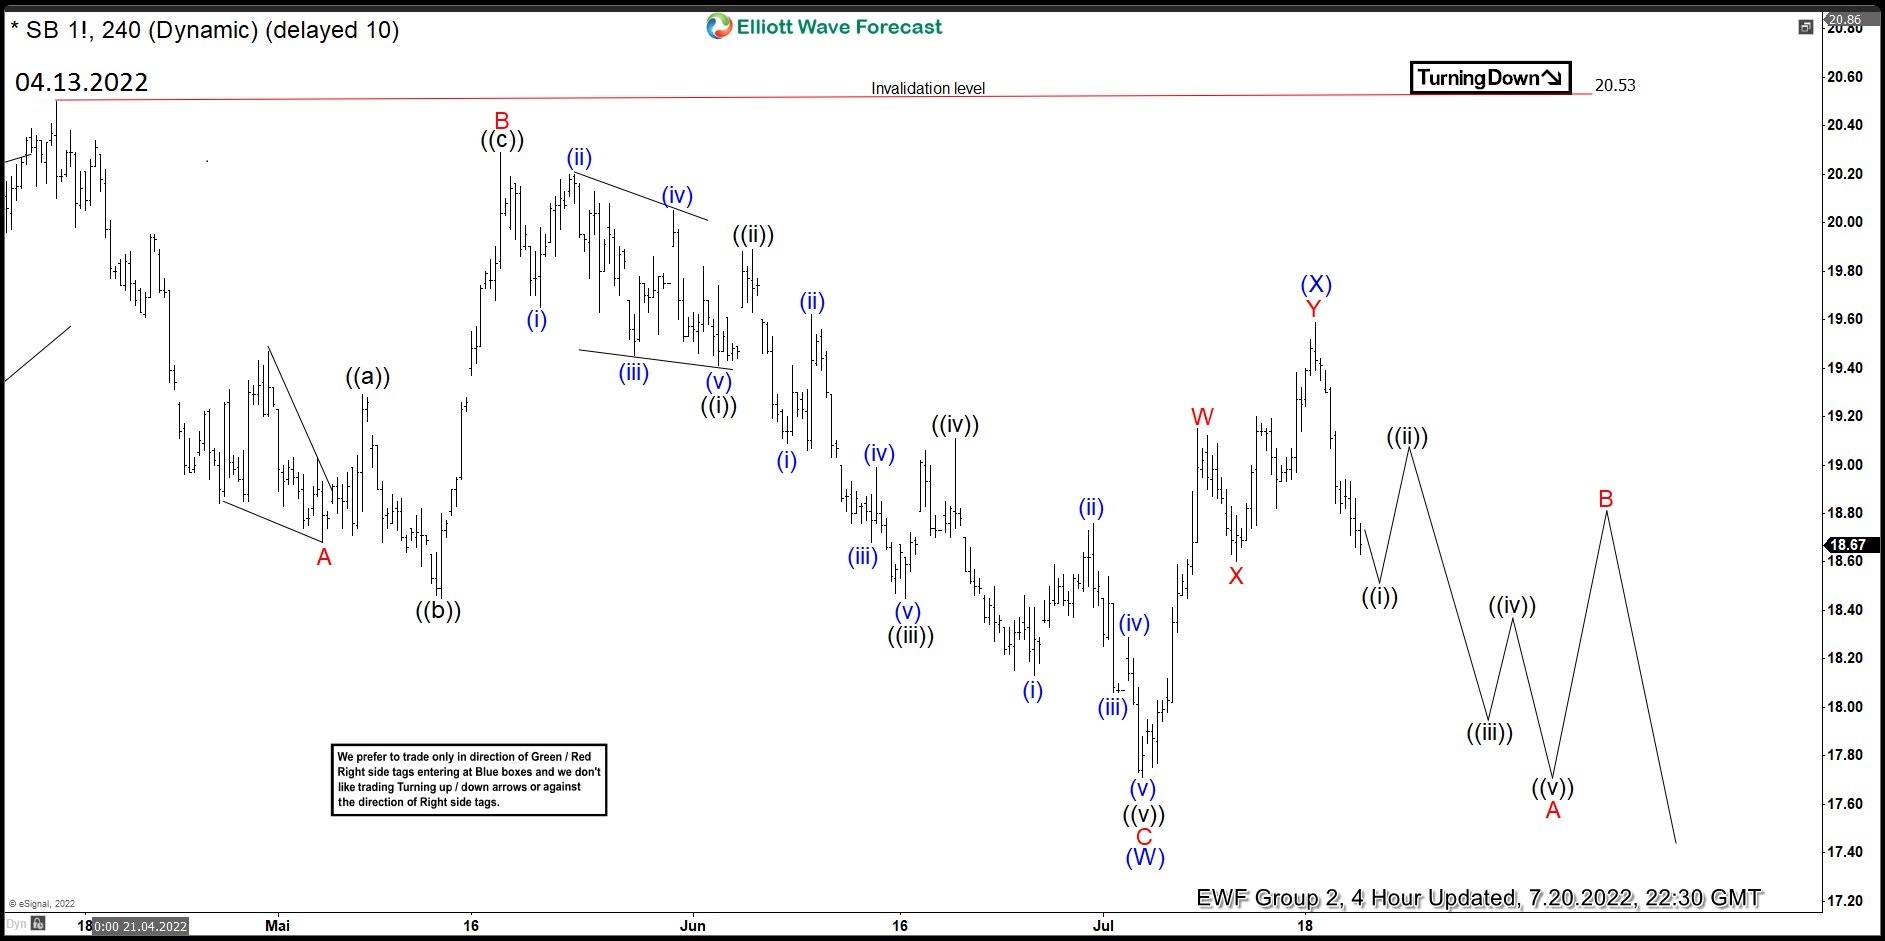
Sugar – Forecasting Elliott Wave Path and Calling The Decline
Read MoreIn this technical blog we’re going to take a quick look at the Elliott Wave charts of Sugar (SB_F) published in members area of the website. SB_F ended a cycle from 04.13.2022 peak as a Zigzag Elliott wave structure. and bounced. Based in correlation with other commodities and US Dollar Index calling for more upside, we called […]
-

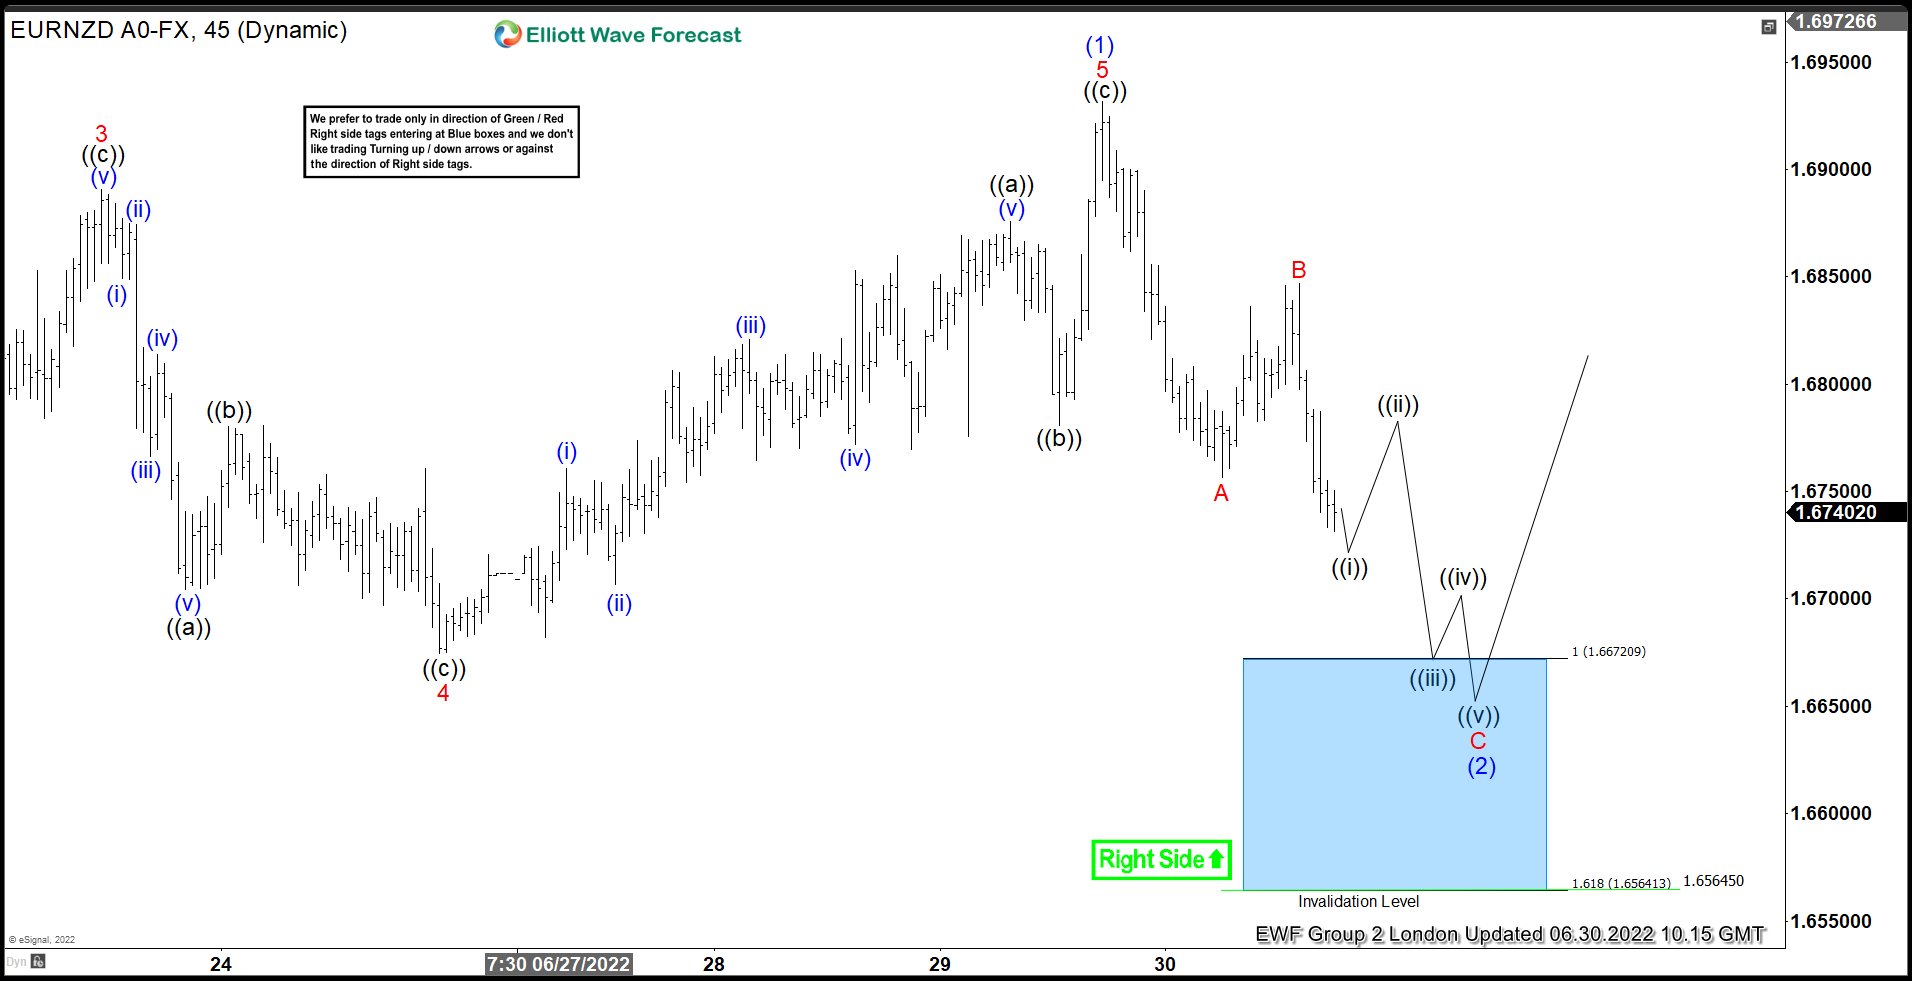
EURNZD Buying The Dips At The Blue Box Area
Read MoreIn this technical blog we’re going to take a quick look at the Elliott Wave charts of EURNZD published in members area of the website. As our members knew, we’ve been favoring the long side in EURNZD since it broke above May 12, 2022 high. Break of May 12, 2022 high created an incomplete bullish sequence in […]
-

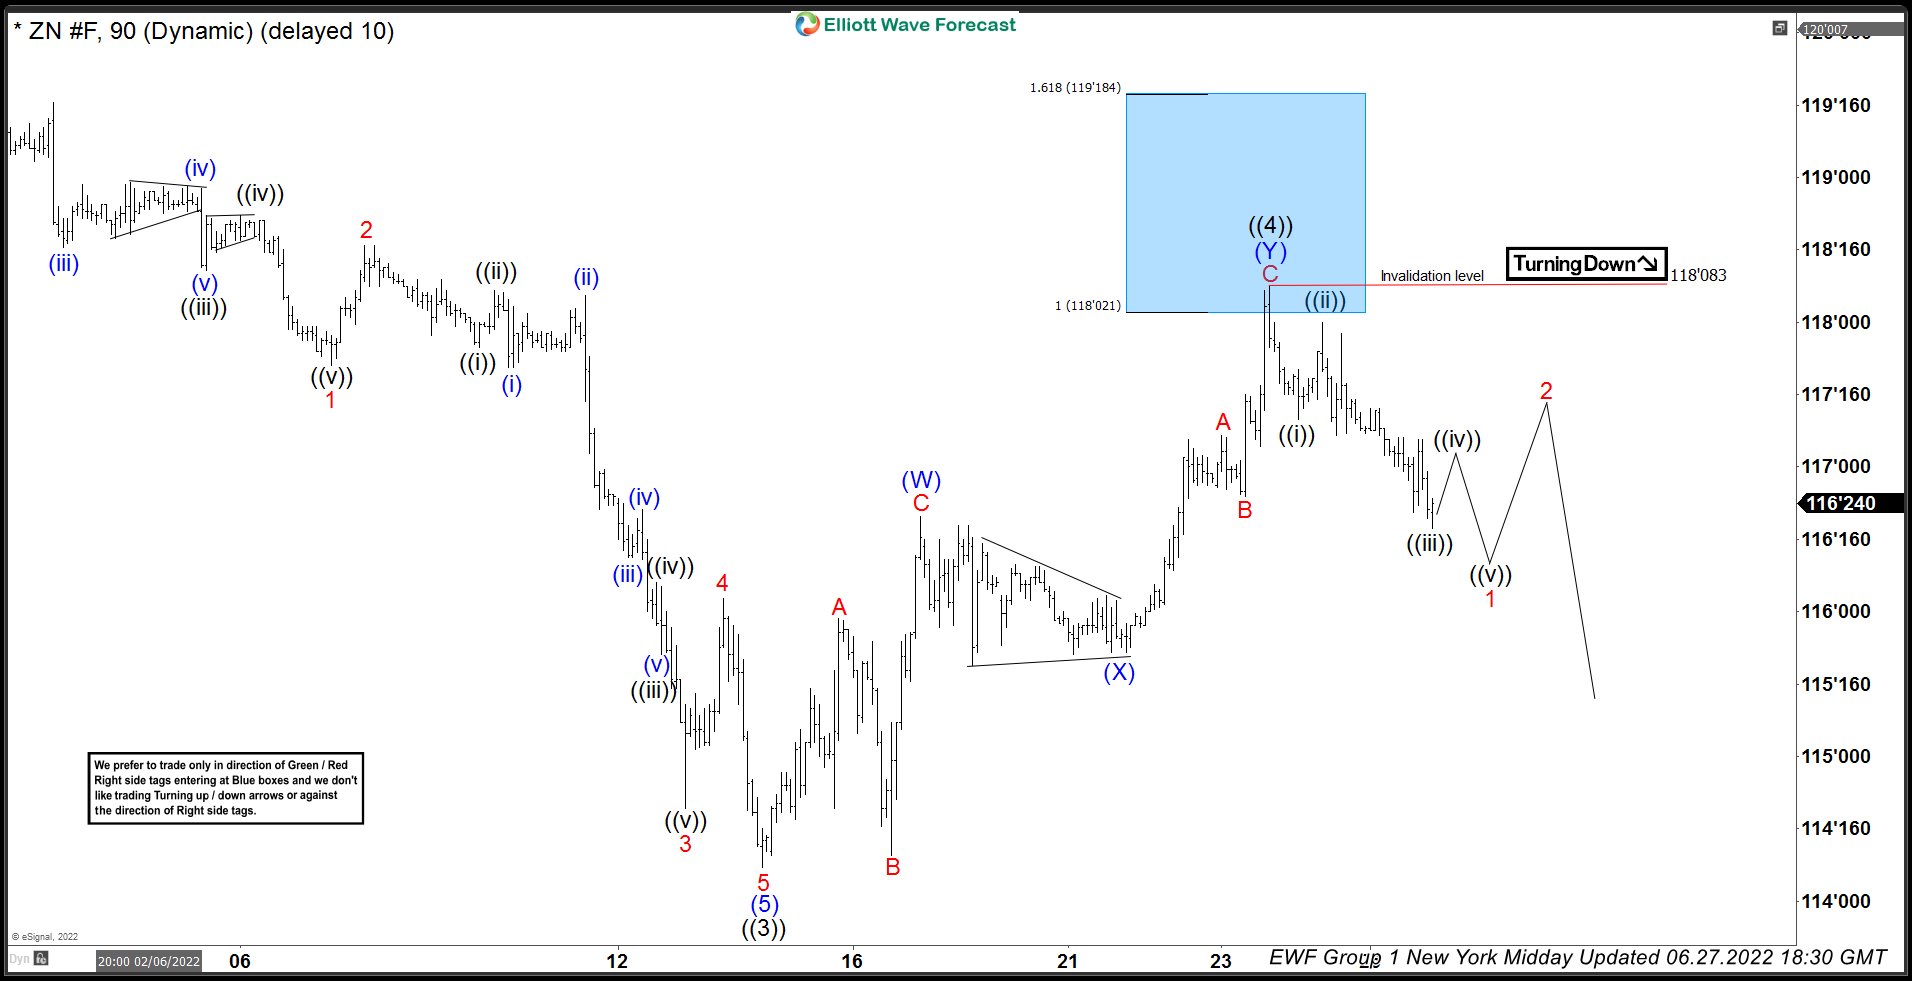
10 Year Note (ZN_F) Selling Rally In The Blue Box
Read MoreIn this technical blog we’re going to take a quick look at the Elliott Wave charts of ZN_F (10 Year Note) published in members area of the website. As our members knew, we’ve been favoring the long side in USDJPY and hence we expected bounces in 10 year note to fail for extension lower as they trade […]
