March 16 2026 I entered the buy entry on the AUDCHF pair at 0.5542 with a 15 pip stop loss at 0.5527 and was looking for a move higher to the 3R target at 0.5587.
Buy Trade Setup
1. Price taps the bullish daily FVG zone (Gray) and reacted with a move higher.
2. Price breaks above bullish CHoCH/Change of Character level. (Black line)
3. Price breaks above descending channel signalling a bullish bias. (Black dotted line)
4. Price taps bullish FVG zone (Purple).
5. All combined together and entered the BUY/LONG trade with confidence.
AUDCHF 1 Hour Chart March 16 2026
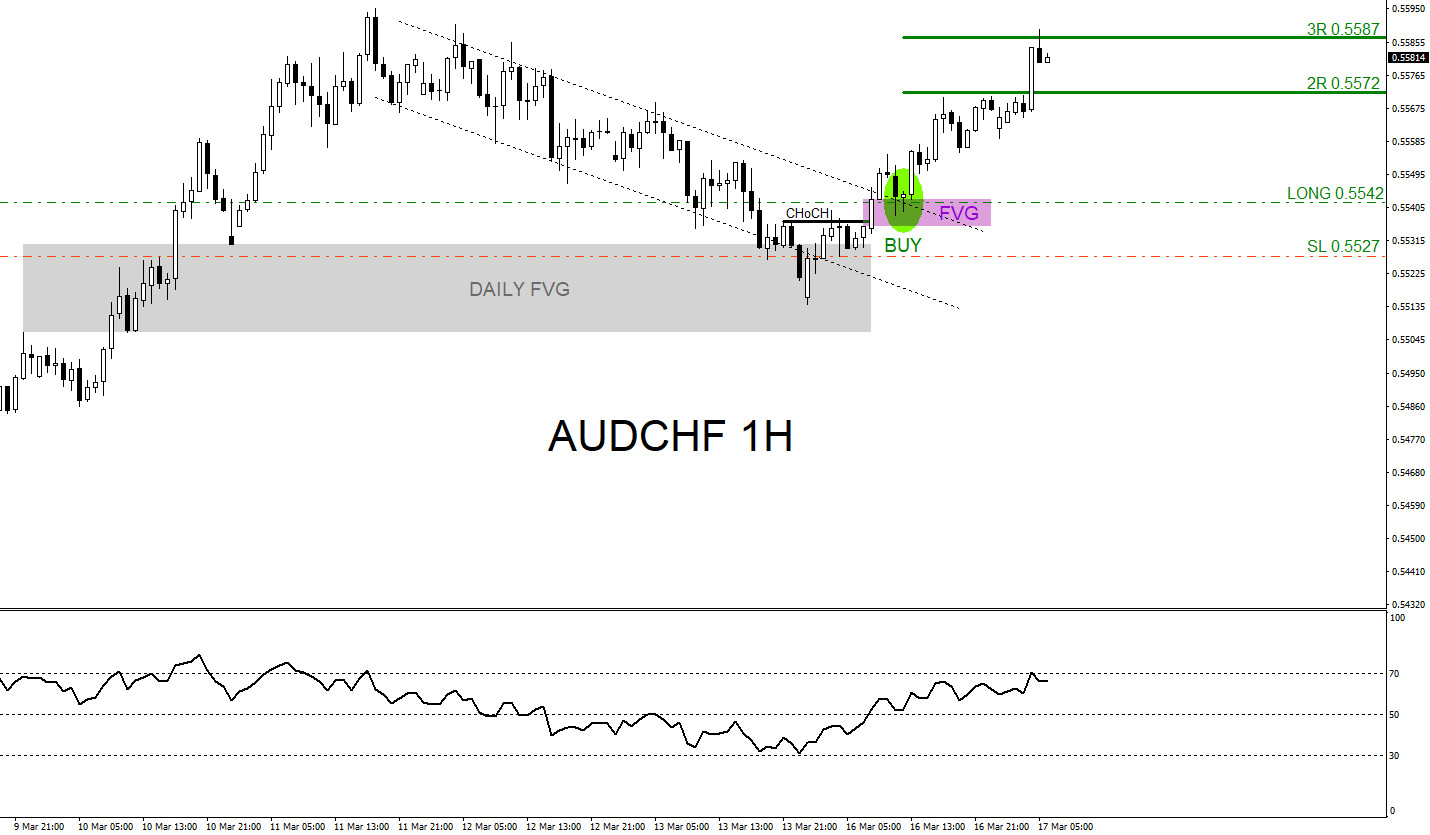
AUDCHF moves higher and hits 3R target at 0.5587 from 0.5542 and I closed trade for +45 pips (+3% gain risking 1% on every trade)
A trader should always have multiple strategies all lined up before entering a trade. Never trade off one simple strategy. When multiple strategies all line up it allows a trader to see a clearer trade setup. We at EWF never say we are always right. No market service provider can forecast markets with 100% accuracy. Only thing we at EWF 100%, is that we are RIGHT more than we are WRONG.
Of course, like any strategy/technique, there will be times when the strategy/technique fails so proper money/risk management should always be used on every trade. Hope you enjoyed this article and follow me on social media for updates and questions> @AidanFX
At Elliottwave-Forecast we cover 78 instruments (Forex, Commodities, Indices, Cryptos, Stocks and ETFs) in 4 different time frames and we offer 5 Live Session Webinars everyday. We do Daily Technical Videos, Elliott Wave Trade Setup Videos and we have a 24 Hour Chat Room. Our clients are always in the loop for the next market move.
Try Elliottwave-Forecast for 14 days !!! Just click here –> 14 day trial


