

Hello, fellow traders. In this technical blog, we’re going to take a quick look at the Elliott Wave charts for the NZDUSD Forex pair, published in the members’ area of the website. Recently, NZDUSD made a significant decline within the cycle from the 0.5897 peak. In the following analysis, we will examine the Elliott Wave structure in more detail.
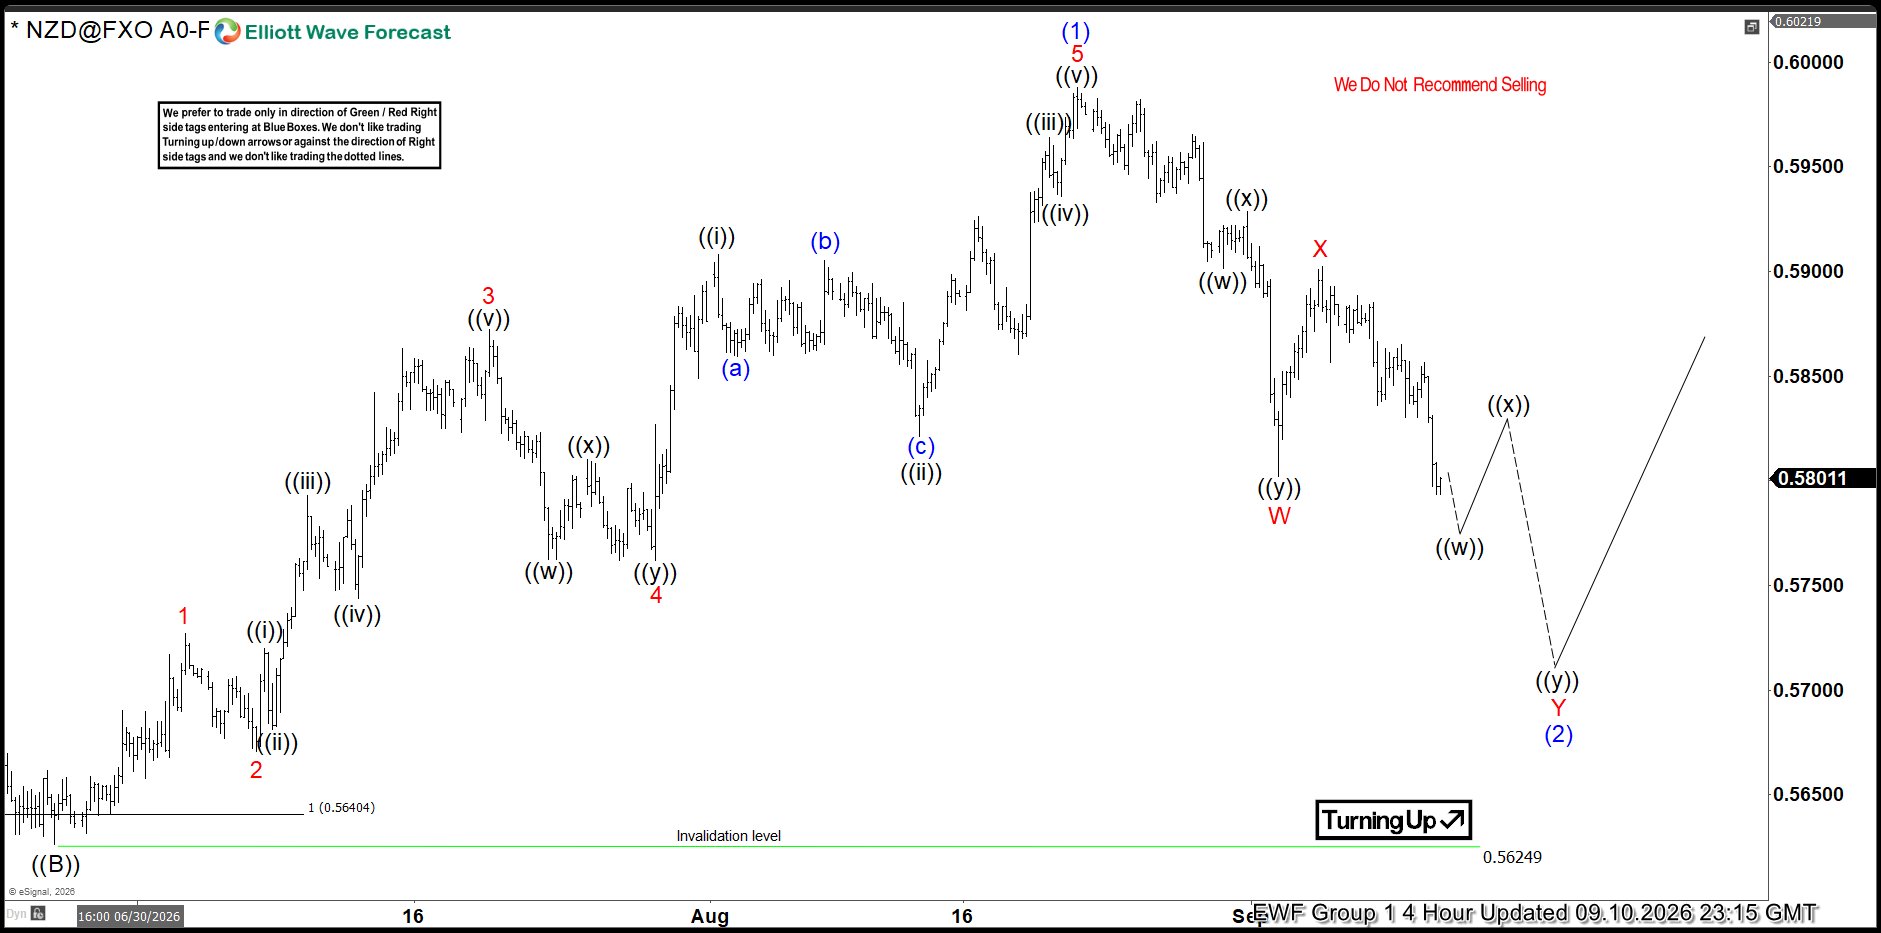
NZDUSD Elliott Wave 4-Hour Chart 09.10.2026
NZDUSD is currently correcting the cycle from the 0.56249 low. Recently, the pair made a new short-term low, which made the price structure of the pullback incomplete. Our members know the importance of incomplete swing structures, as they can help us determine the market’s next path with greater accuracy. The current view suggests more short-term weakness before the next rally takes place. The target is measured using the Fibonacci Extension tool. The pullback is forming an Elliott Wave Double Three pattern. Therefore, we identify the reversal/buying zone by measuring the W-X Equal Legs area using the Fibonacci Extension tool. In this case, the Equal Legs zone comes at 0.5715-0.5671. From this area, we expect buyers to step in and regain control, potentially driving the price higher in a three-wave bounce at least.
You can learn more about Elliott Wave Patterns at our Free Elliott Wave Educational Web Page
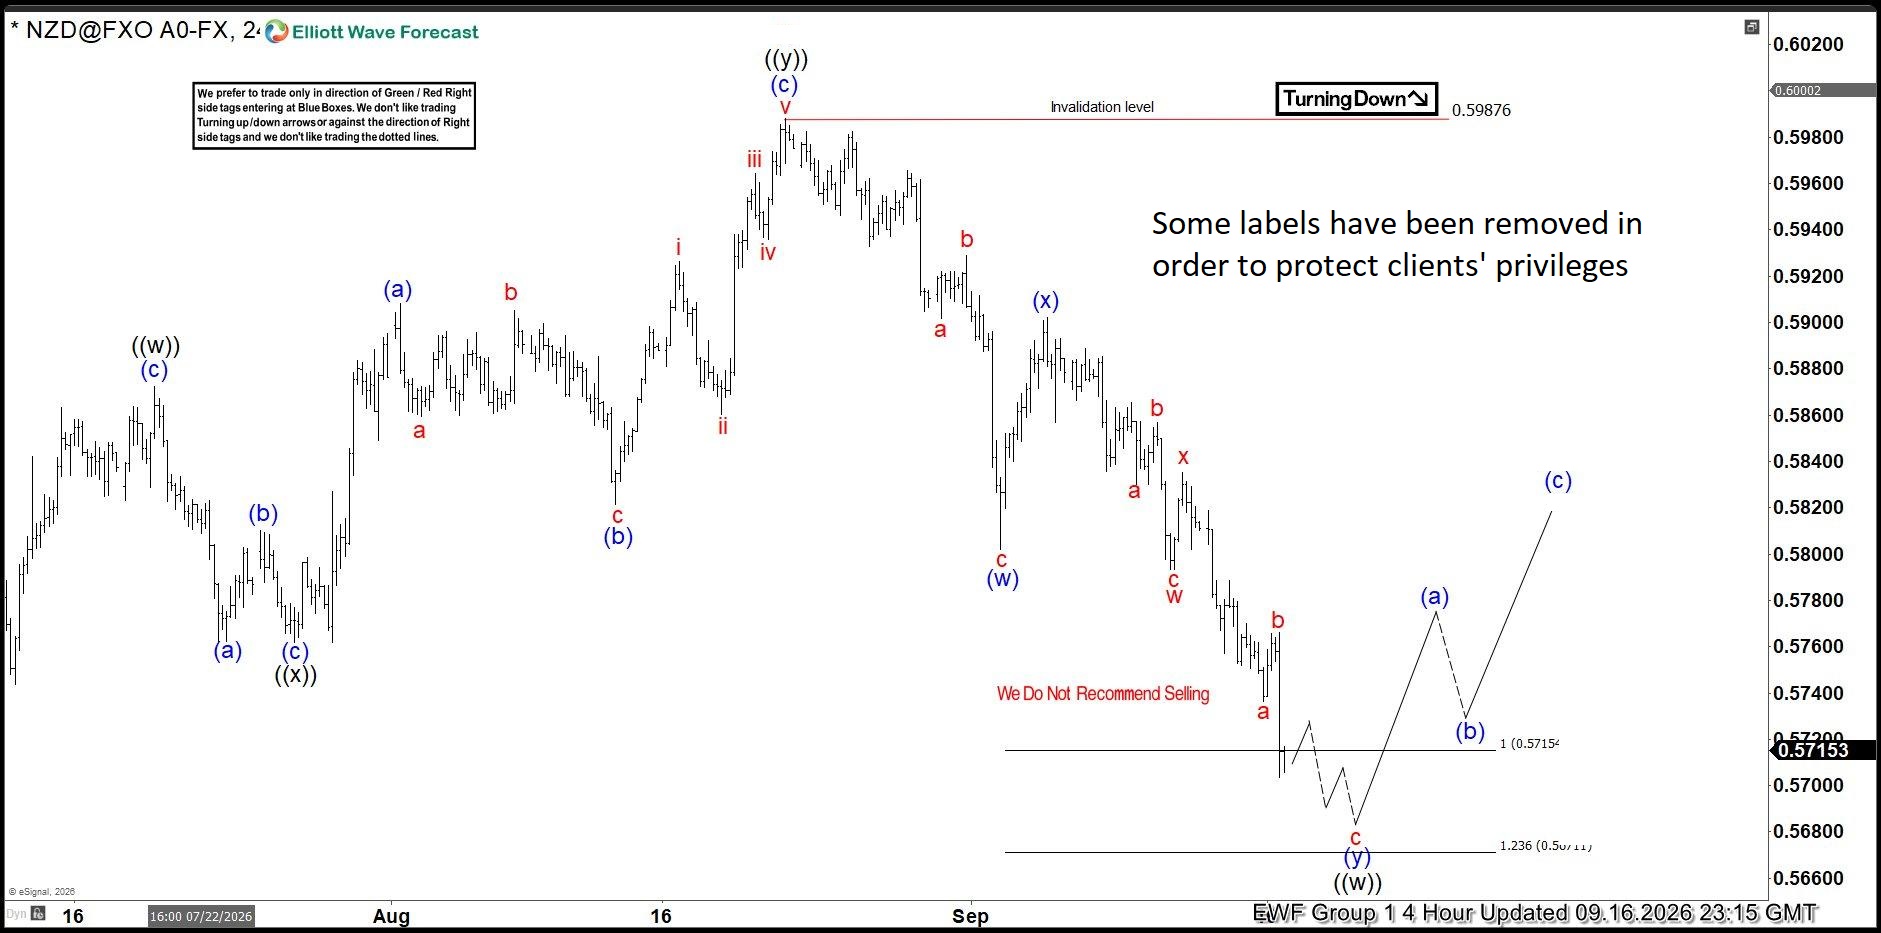
NZDUSD Elliott Wave 4-Hour Chart 09.10.2026
The pair has continued to trade lower, as expected, reaching a key technical area at 0.5715–0.5671, defined by an equal-legs measurement. This zone is important for the current structure. Sellers may look to take profits here, while buyers could step in and provide support. As a result, we may see a short-term corrective bounce developing over the coming days, potentially unfolding in a three-wave structure.
Important note: Our analysis is not based on Elliott Wave in isolation. We perform detailed higher-time-frame cycle analysis, which shows an incomplete market structure. This is one of the key drivers of price action, along with correlation analysis and broader market context.
Keep in mind that the market is dynamic, and the outlook may have changed in the meantime. Our member Chat Rooms are open 24 hours a day, Monday through Friday, on trading days, providing ongoing expert guidance on market trends and Elliott Wave analysis. Members can ask questions about market structure and technical setups at any time during trading days.
Elliott Wave Forecast Membership
Trade with a clear plan—not guesswork.
Our team of professional analysts monitors 78 instruments across global markets every day, helping members identify high-probability setups, define risk before entering, and manage positions through a structured, rules-based process.
Inside your membership, you’ll receive:
✅ Real-Time Trading Recommendations — clearly defined Entry, Stop Loss, and Take Profit levels for every setup.
✅ Live Trading Room Access — follow professional setups and trade management as they develop in real time.
✅ 24-Hour Analyst Support — ask unlimited questions and receive guidance throughout the trading week.
✅ Expert Multi-Market Analysis — covering Forex, Stocks, Indices, ETFs, Commodities, and Cryptocurrencies.
✅ Education Built Into Every Setup — learn how experienced analysts identify opportunities, define risk, and manage positions, with exclusive educational videos included at no additional cost.
Stop reacting after the market moves. Start preparing before it does.
Your complete membership access is only a few clicks away.
Regular 14-Day Trial: $9.99
Limited-Time Price: Only $0.99
👉 Start Your 14-Day Trial for Only $0.99



