

Hello fellow traders,
Another XLV ETF trading opportunity is taking shape. Our Elliott Wave analysis identified a clear 3-wave correction from the recent peak. The price then reached the Equal Legs area, marked as our Blue Box buying zone. This is the type of setup we closely monitor in our trading service. The Blue Box gives us a defined area to look for an entry, while the Elliott Wave structure helps us manage the trade and define the next targets.
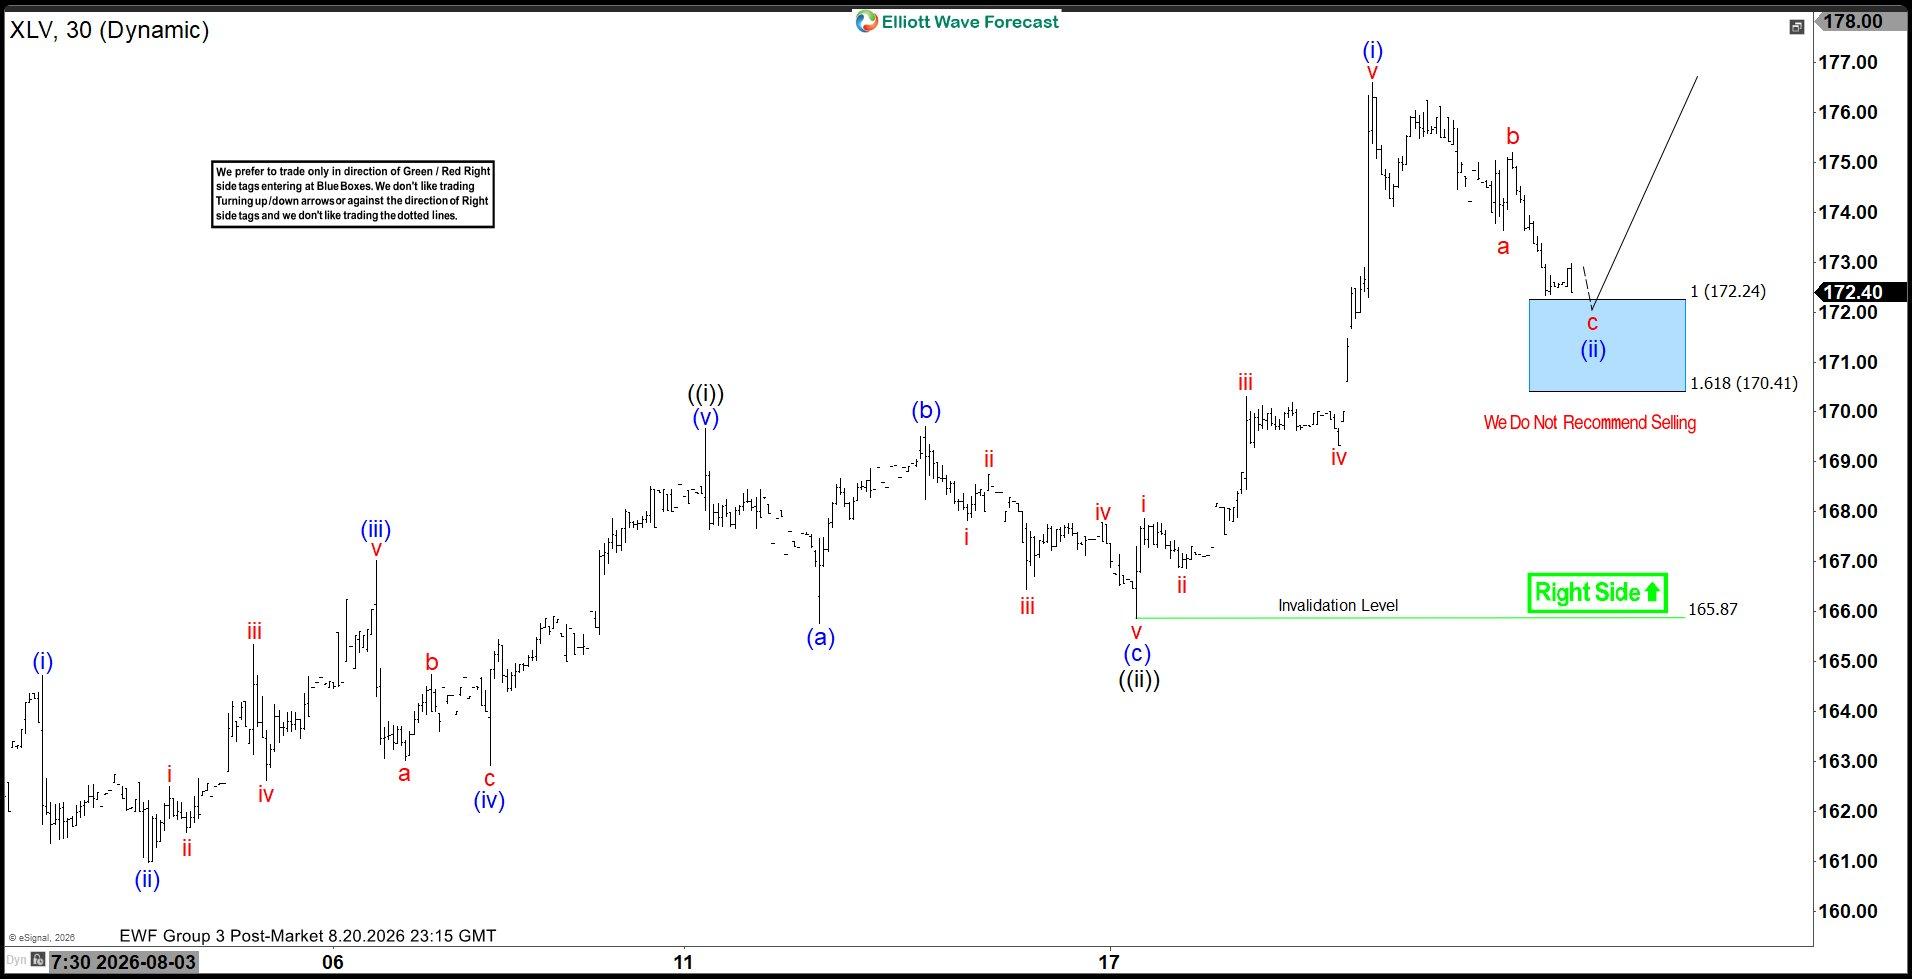
XLV Elliott Wave 4-Hour Chart – 08.20.2026
XLV is showing a clear 3-wave correction from the recent peak. The price is now approaching the Blue Box buying zone at 172.24–170.41.
This is a key area for the current setup. At this stage, we do not favor selling XLV. Instead, we continue to look for a long opportunity from the marked zone.
From this area, XLV could produce at least a 3-wave bounce. If the bullish trend resumes, the ETF could continue higher and potentially reach new highs.
The setup also gives us a clear way to manage risk. Once the bounce reaches the 50% Fibonacci retracement against the red B-wave high, we can move the stop loss to breakeven and secure partial profits. This is just one example of the real-time Elliott Wave setups we track for our members, with defined entry zones, risk levels, and potential targets.
The official trading strategy for identifying 3, 7, and 11 swings and Equal Legs setups is explained in detail in our educational video. The video is available exclusively to members inside the membership area.
How to Read Our Charts
- Red bearish stamp + Blue Box = Selling setup
- Green bullish stamp + Blue Box = Buying setup
- Black stamp = No trade zone
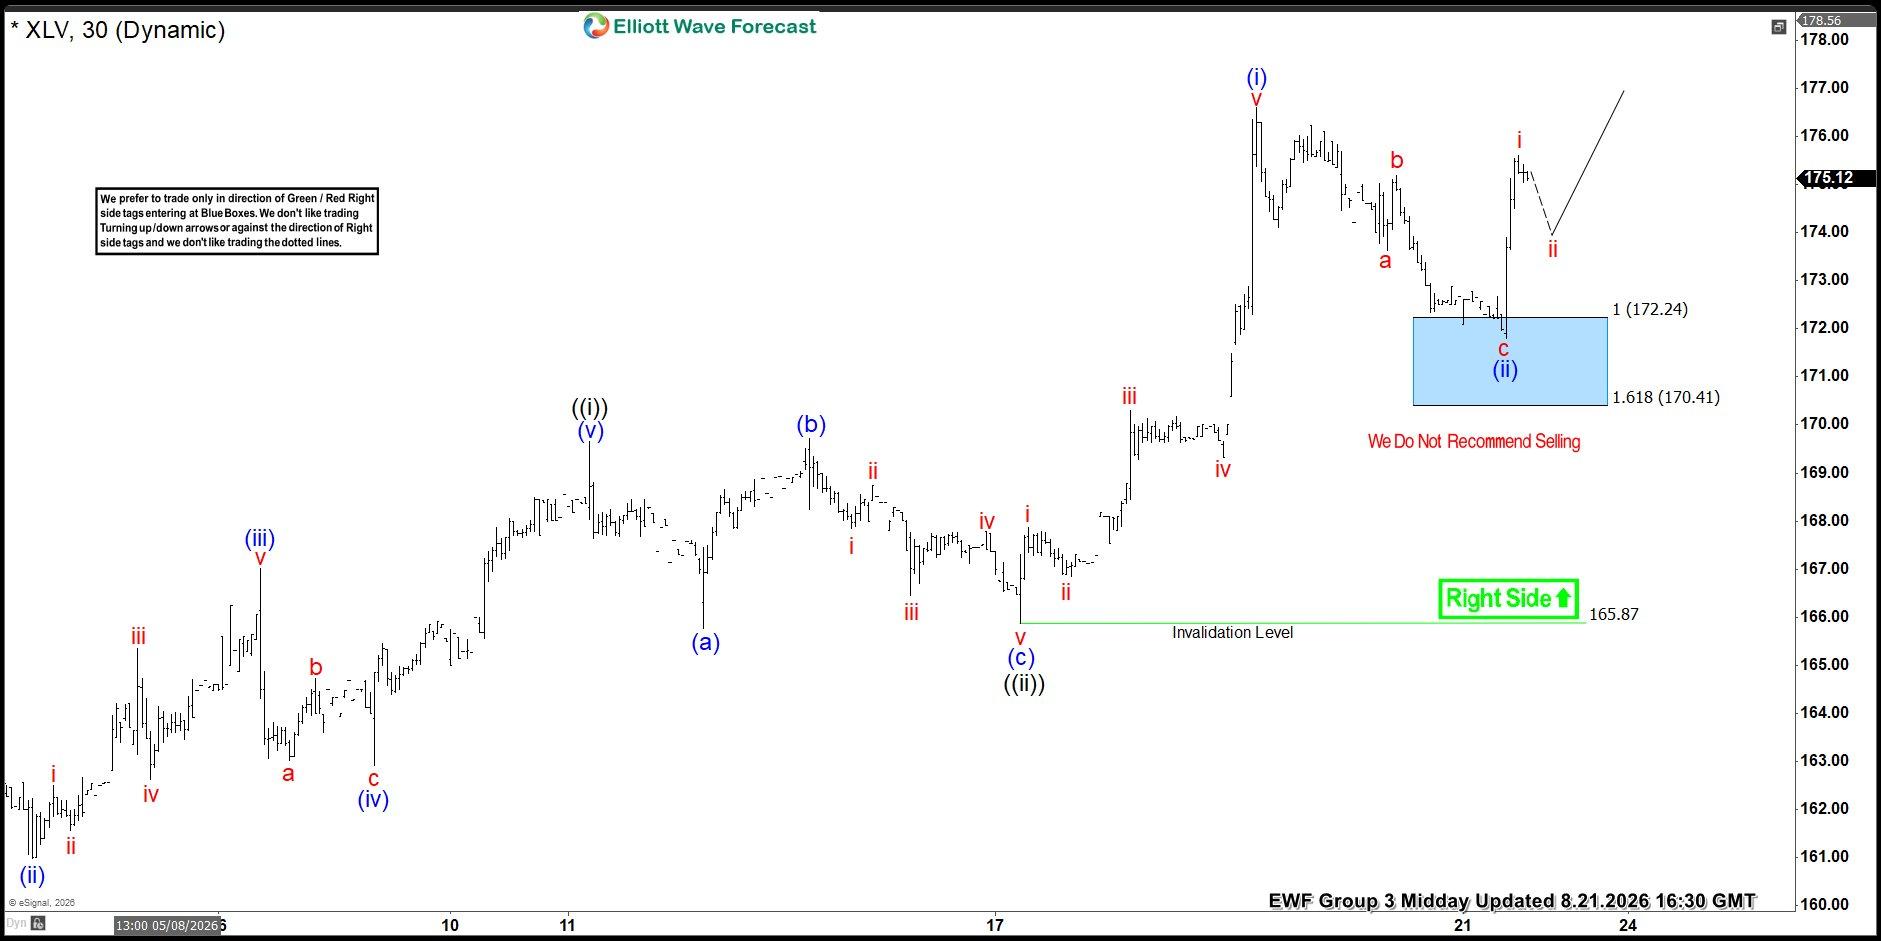
XLV Elliott Wave 4-Hour Chart 08.21.2026
As a result, long positions taken from this zone can now be considered risk-free, with the stop moved to breakeven. Our next target is for XLV to break to new highs. This would confirm that the next bullish leg is underway.
However, if the latest low breaks, XLV could enter a deeper correction. In that case, we would look for the pullback to create a new trading opportunity.
You can find the latest XLV charts, trading setups, and target levels inside our membership area.The best instruments to trade are those with incomplete bullish or bearish swings. These setups are highlighted in our Sequence Report, while the highest-conviction opportunities are presented in the Live Trading Room.
Keep in mind that the market is dynamic, and the outlook may have changed in the meantime. Our member Chat Rooms are open 24 hours a day, Monday through Friday, on trading days, providing ongoing expert guidance on market trends and Elliott Wave analysis. Members can ask questions about market structure and technical setups at any time during trading days.
Elliott Wave Forecast Membership
Trade with a clear plan. Trade with confidence.
Our team of professional analysts monitors 78 instruments across global markets every trading day, helping members identify high-probability setups, define risk before entering, and manage positions with a structured, rules-based approach.
Inside your membership, you’ll receive:
✅ Real-Time Trading Recommendations — clearly defined Entry, Stop Loss, and Take Profit levels for every setup.
✅ Live Trading Room Access — follow professional setups and trade management as they develop in real time.
✅ 24-Hour Analyst Support — ask unlimited questions and get expert guidance throughout the trading week.
✅ Expert Multi-Market Analysis — covering Forex, Stocks, Indices, ETFs, Commodities, and Cryptocurrencies.
✅ Education Built Into Every Setup — learn how experienced analysts identify opportunities, define risk, and manage positions. Exclusive educational videos are included at no additional cost.
Stop reacting after the market moves. Start preparing before it does.
See the setups our analysts are watching, follow the market in real time, and learn the strategy behind each trade.
Your membership starts with just a few clicks.
Regular 14-Day Trial: $9.99
Limited-Time Price: Only $0.99
👉 Start Your 14-Day Trial for Only $0.99




