

Reddit (RDDT) has spent the past year proving something the market wasn’t fully pricing in a year ago: this isn’t just a meme-adjacent trading vehicle, it’s a company with real margins and real growth. Shares have gone from a post-IPO curiosity to a stock that gets mentioned in the same breath as Meta, Google, and Snap when advertising analysts talk about where ad dollars are heading in 2026. That context matters, because it’s the backdrop against which the current pullback in RDDT needs to be read.
On the fundamentals side, the numbers back up the price action. Reddit’s most recent quarter showed revenue of $663.4 million and net income of $204 million, with gross margins near 91% and EBIT margins around 27% — genuinely strong figures for a company still early in its life as a public business. Wells Fargo bumped its price target up to $187 from $176 in early July, and the stock has been drawing attention for reasons beyond trading chatter, including a broader push into AI-driven spam detection and even a former Reddit executive being poached by Nvidia for a senior communications role. With earnings due out July 30, there’s a real catalyst sitting right in front of the current chart pattern, and that’s worth keeping in mind regardless of which way the wave count resolves.
Now to the technical picture, because this is where the near-term roadmap gets interesting.
RDDT Weekly Structure
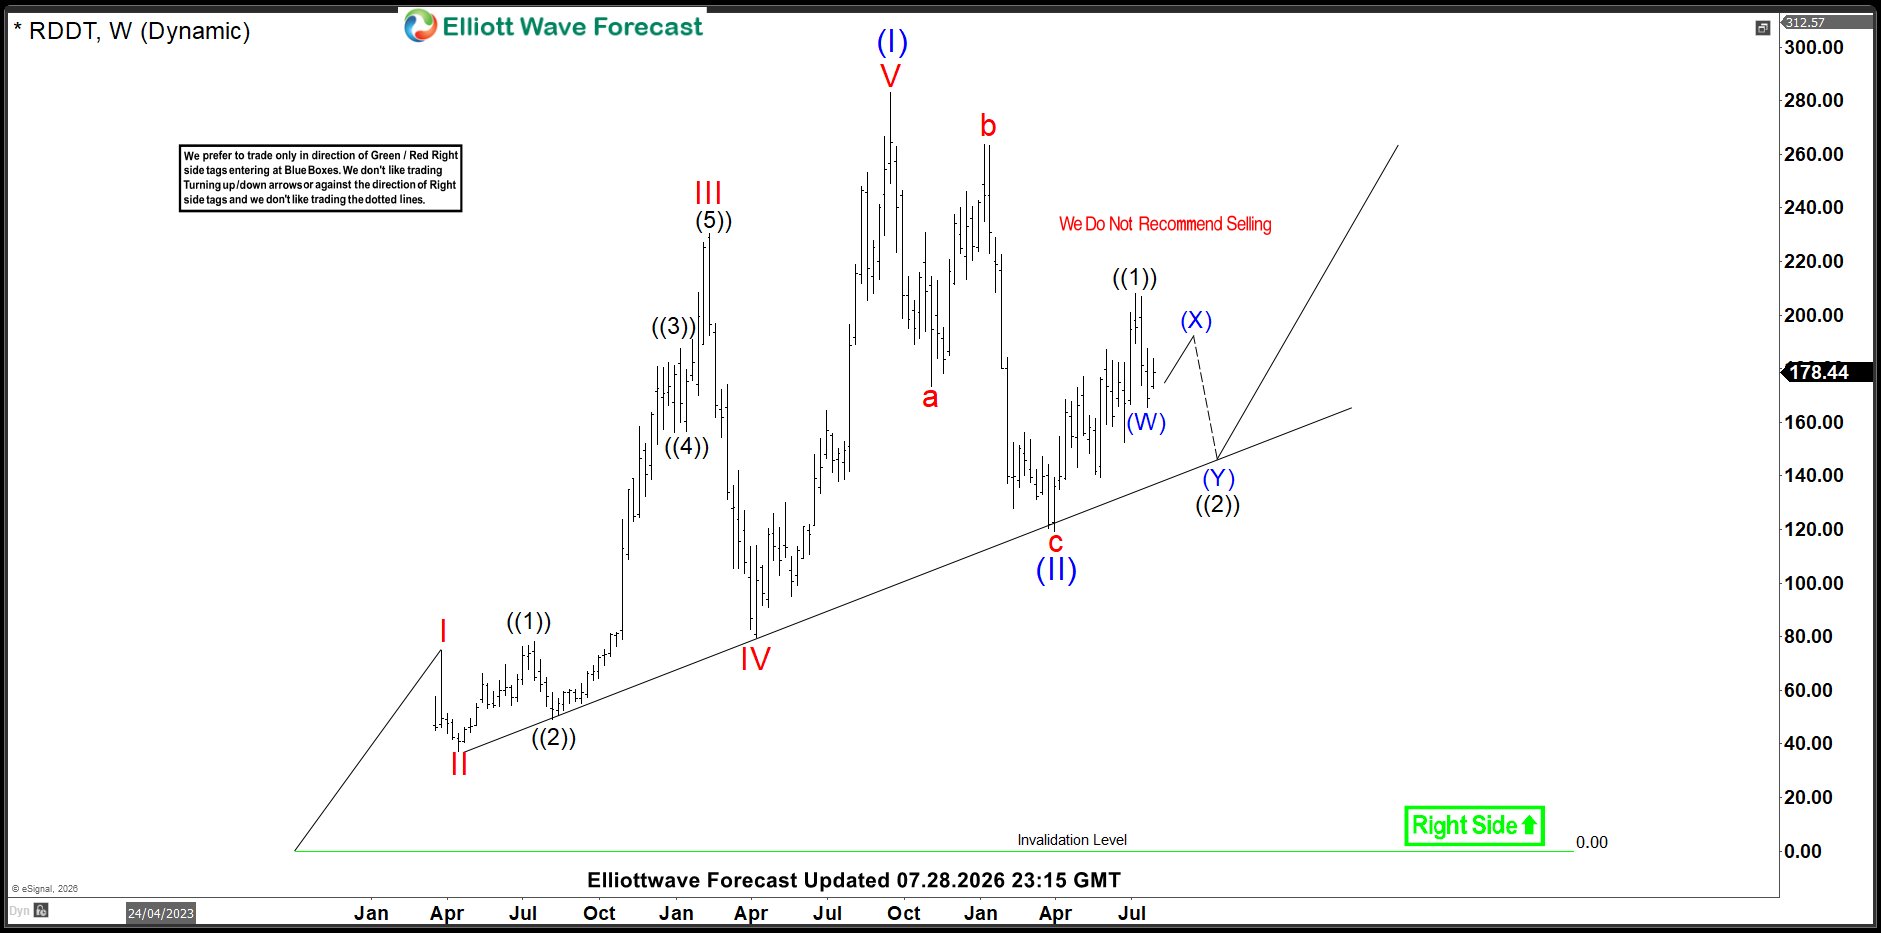
Stepping back to the weekly chart, RDDT rally off its all-time low unfolds as a five-wave impulse in wave (I), which topped at $282.95 in September of last year. Breaking that impulse down internally, wave I ended at $74.90, wave II corrected to $37.35, wave III extended to $230.41, wave IV pulled back to $79.75, and wave V completed the sequence at $282.95.
From there, the stock entered a zigzag correction that bottomed at $119.27 — a level that lines up neatly with the 50% to 61.8% Fibonacci retracement zone of the entire rally off the zero line. That’s a textbook spot for a corrective low to form, and it’s held so far.
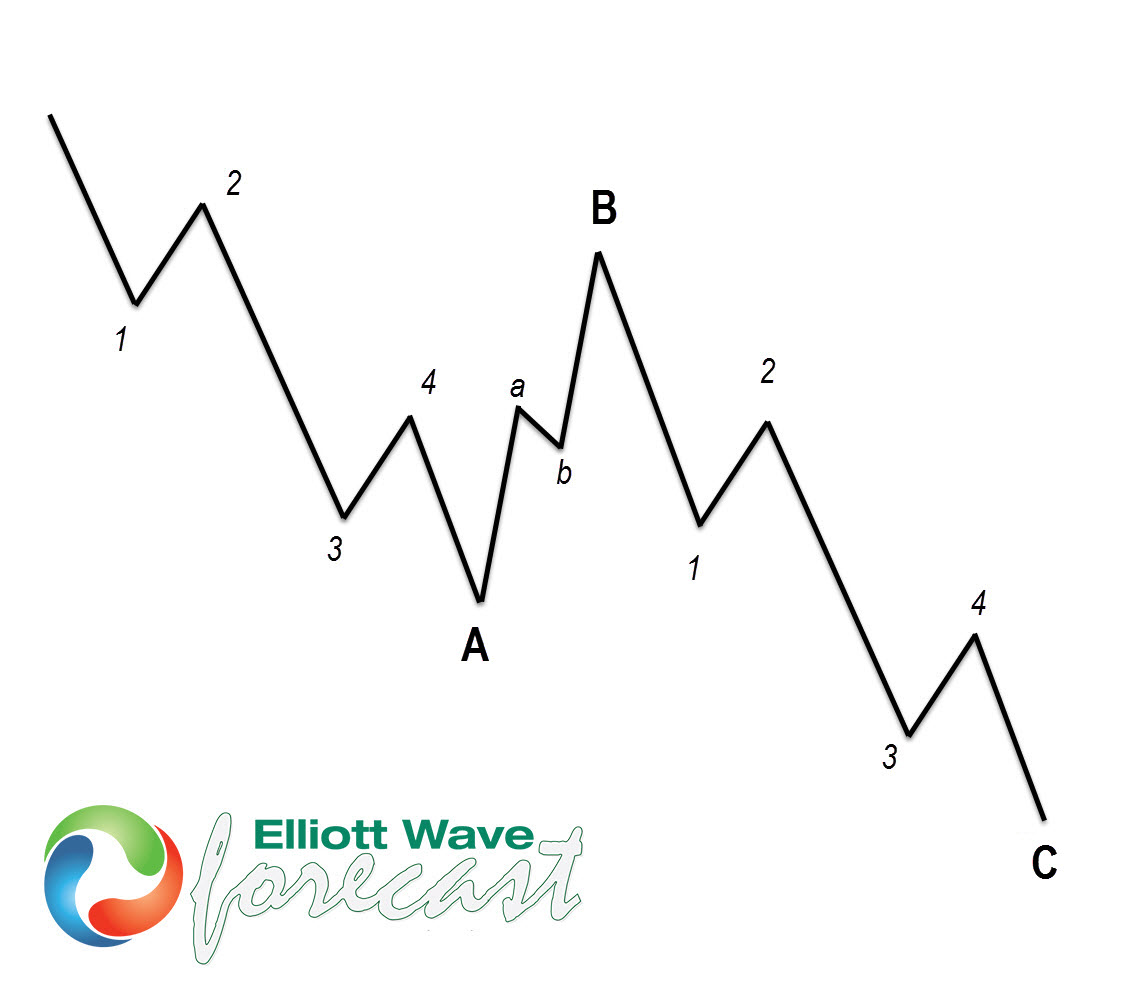
Since printing that low, RDDT has been rallying again, and that rally appears to have completed its first leg at $208.05. The expectation now is a pullback that corrects the advance off the $119.27 low before the broader uptrend resumes. As long as $119.27 holds, the bullish structure stays intact. If it doesn’t, the alternate and less preferred scenario opens the door to another leg down toward the $43.54 area to complete a larger seven-swing corrective sequence before the next rally attempt.
RDDT Four-Hour Picture
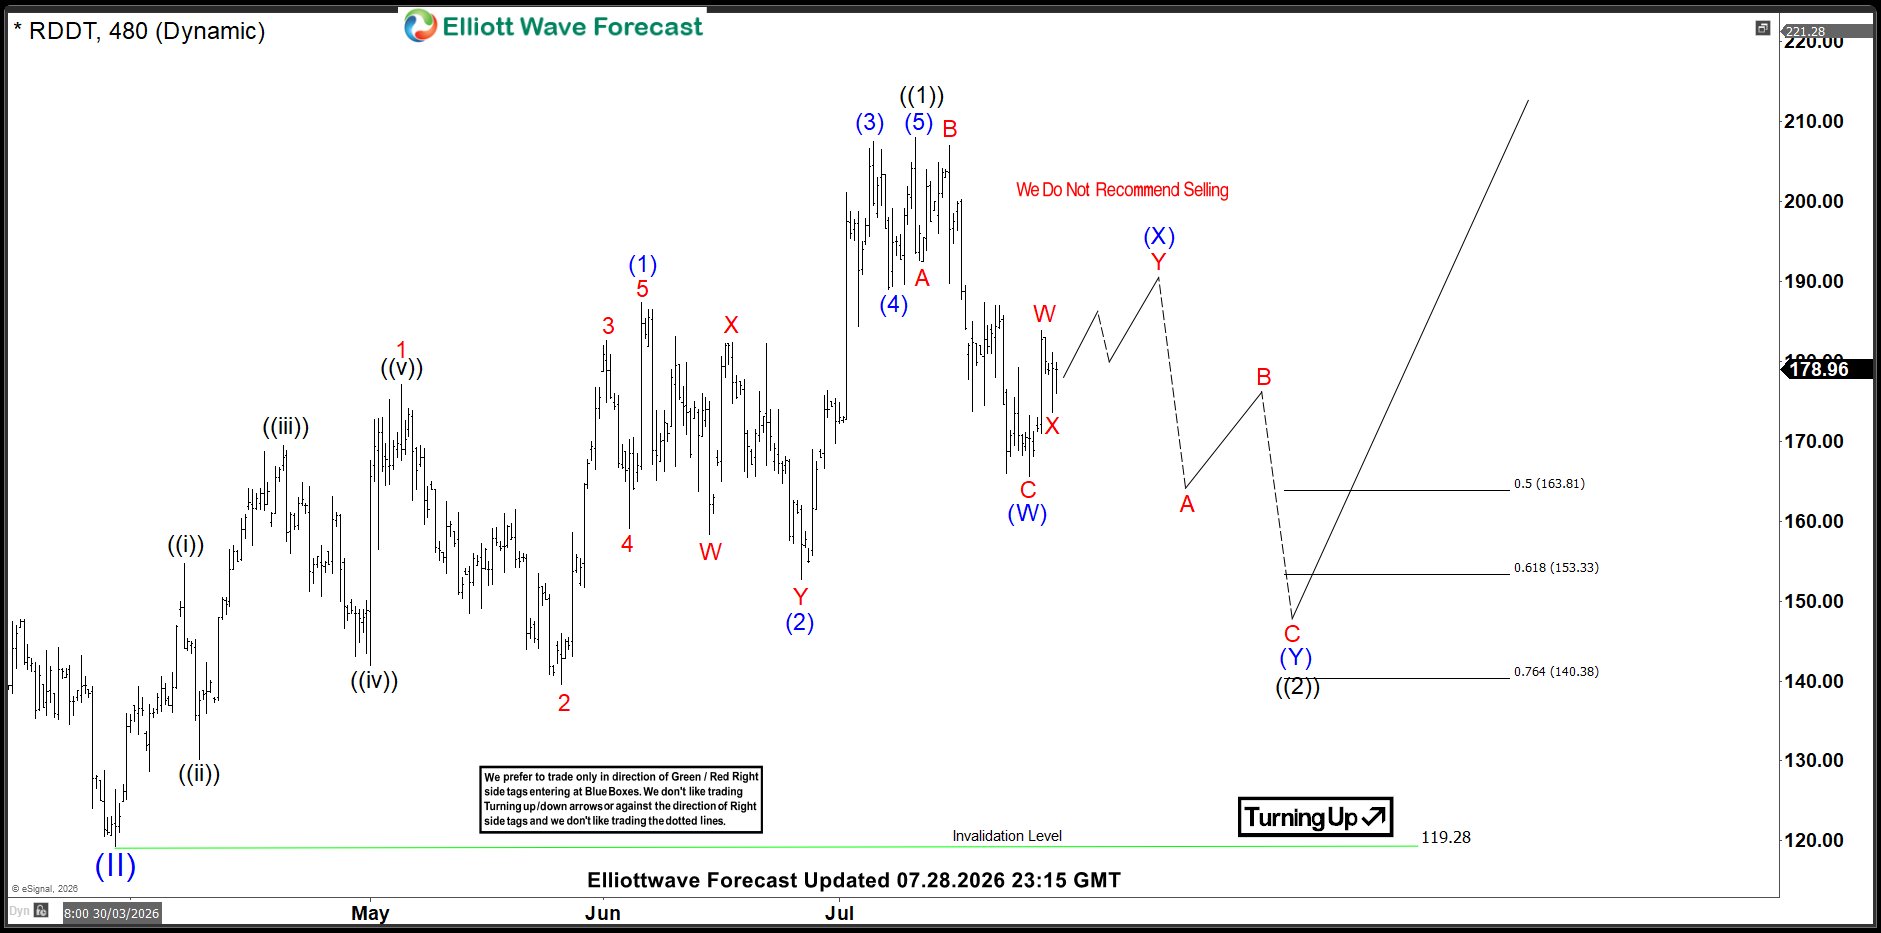
Zooming into the four-hour chart adds detail to that first leg off the $119.27 low. The rally there unfolds as an impulsive move in wave ((1)), which topped at $208.05 on July 10. Internally, wave (1) ended at $187.34, wave (2) pulled back to $152.65, wave (3) extended to $207.54, wave (4) dipped to $189, and wave (5) completed the move at $208.05.
Since that peak, Reddit has been correcting, and that corrective cycle appears to have bottomed, for now, at $165.55. The preferred read is that as long as bounces continue to fail below the $208.05 high, the stock is working on a double correction lower — three swings down, a partial recovery, then three more swings down — to complete wave ((2)) before the bigger rally resumes.
What Would Change the Picture
There’s a clean alternate scenario worth watching. If price breaks back above the $208.05 peak, that would suggest wave ((2)) already finished at $165.55, and that wave ((3)) is already underway. In that case, the next area of interest for the rally becomes $254.69 to $309.83.
Either way, the message for now is the same: Reddit’s larger trend remains higher, and the current softness looks like a pause within that trend rather than a reversal of it. The $119.27 level on the weekly chart is the line in the sand. Above it, the path of least resistance stays up. Below it, the timeline for the next leg higher gets pushed out, but the broader bullish structure isn’t broken until that level gives way.
Want Real-Time Elliott Wave Updates on 78 World Markets?
The wave counts and levels in this article are just a snapshot. Markets move fast, and Elliott Wave structures often shift as new price action comes in. If you want to stay ahead of moves like this one — with updated charts, invalidation levels, and alternate scenarios delivered as they develop — try Elliott Wave Forecast for just $0.99 for your first 14 days.
[Start Your 14-Day Trial for $0.99 →]
Full access to live charts, forecasts, and analyst updates across stocks, crypto, forex, and commodities based on your chosen group.




