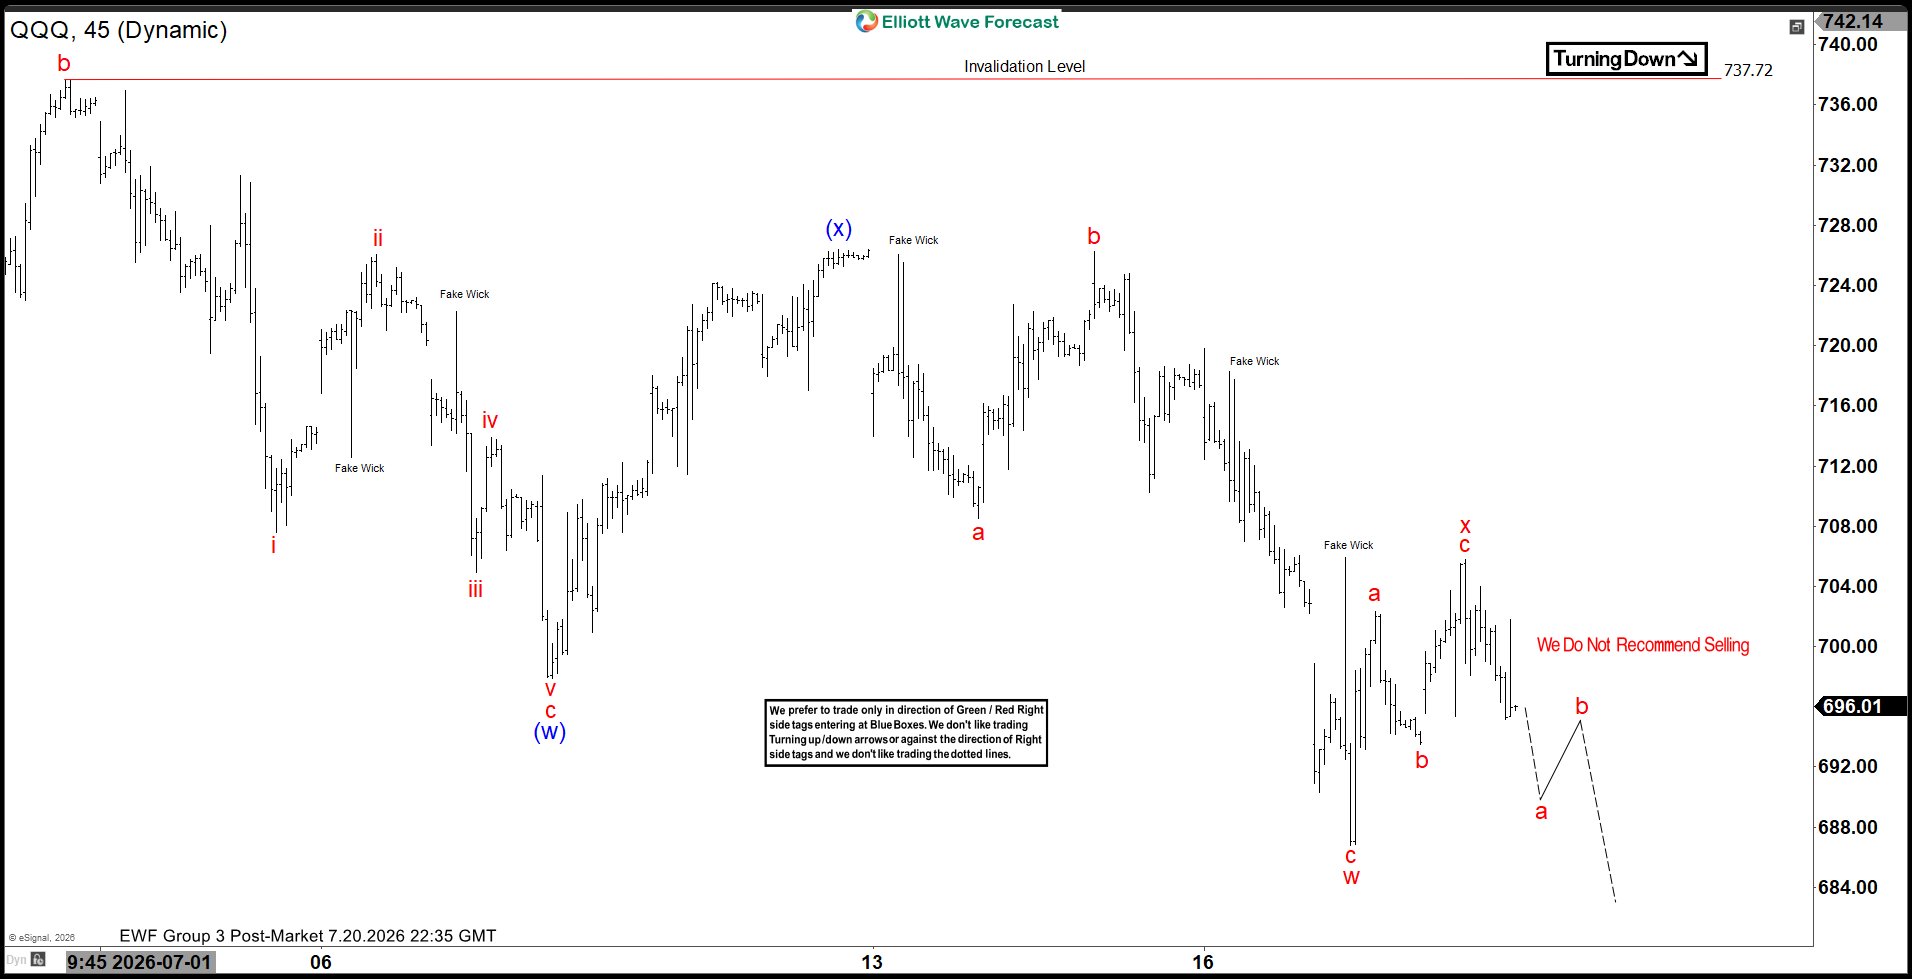
The short‑term Elliott Wave view on the Nasdaq 100 ETF (QQQ) shows that the instrument is correcting the cycle from the March 30, 2026 low. The decline from the June 3, 2026 all‑time high continues, with the extreme target zone defined by the 100%–161.8% Fibonacci extension. This area lies between $646 and $684 and represents the next logical support cluster within the ongoing correction.
From the June 16 high, the cycle has unfolded as a double three structure. Wave (w) ended at $697.86, followed by a counter‑trend rally in wave (x) that peaked at $726.40. The ETF then resumed lower in wave (y), which subdivides into another double three, highlighting the complexity of the correction.
Within wave (y), the decline from wave (x) produced wave w at $686.76. The subsequent rally in wave x ended at $705.80. The ETF has since turned lower again. A break beneath $686.76 is required to confirm that the correction is extending as a double sequence. Until then, the possibility of a more complex consolidation remains.
Near term, the pivot at $737.72 is critical. As long as this high remains intact, rallies are expected to fail in either three or seven swings. This reinforces the downside bias and favors continuation lower toward the $684 area, consistent with the projected Fibonacci extension zone.