

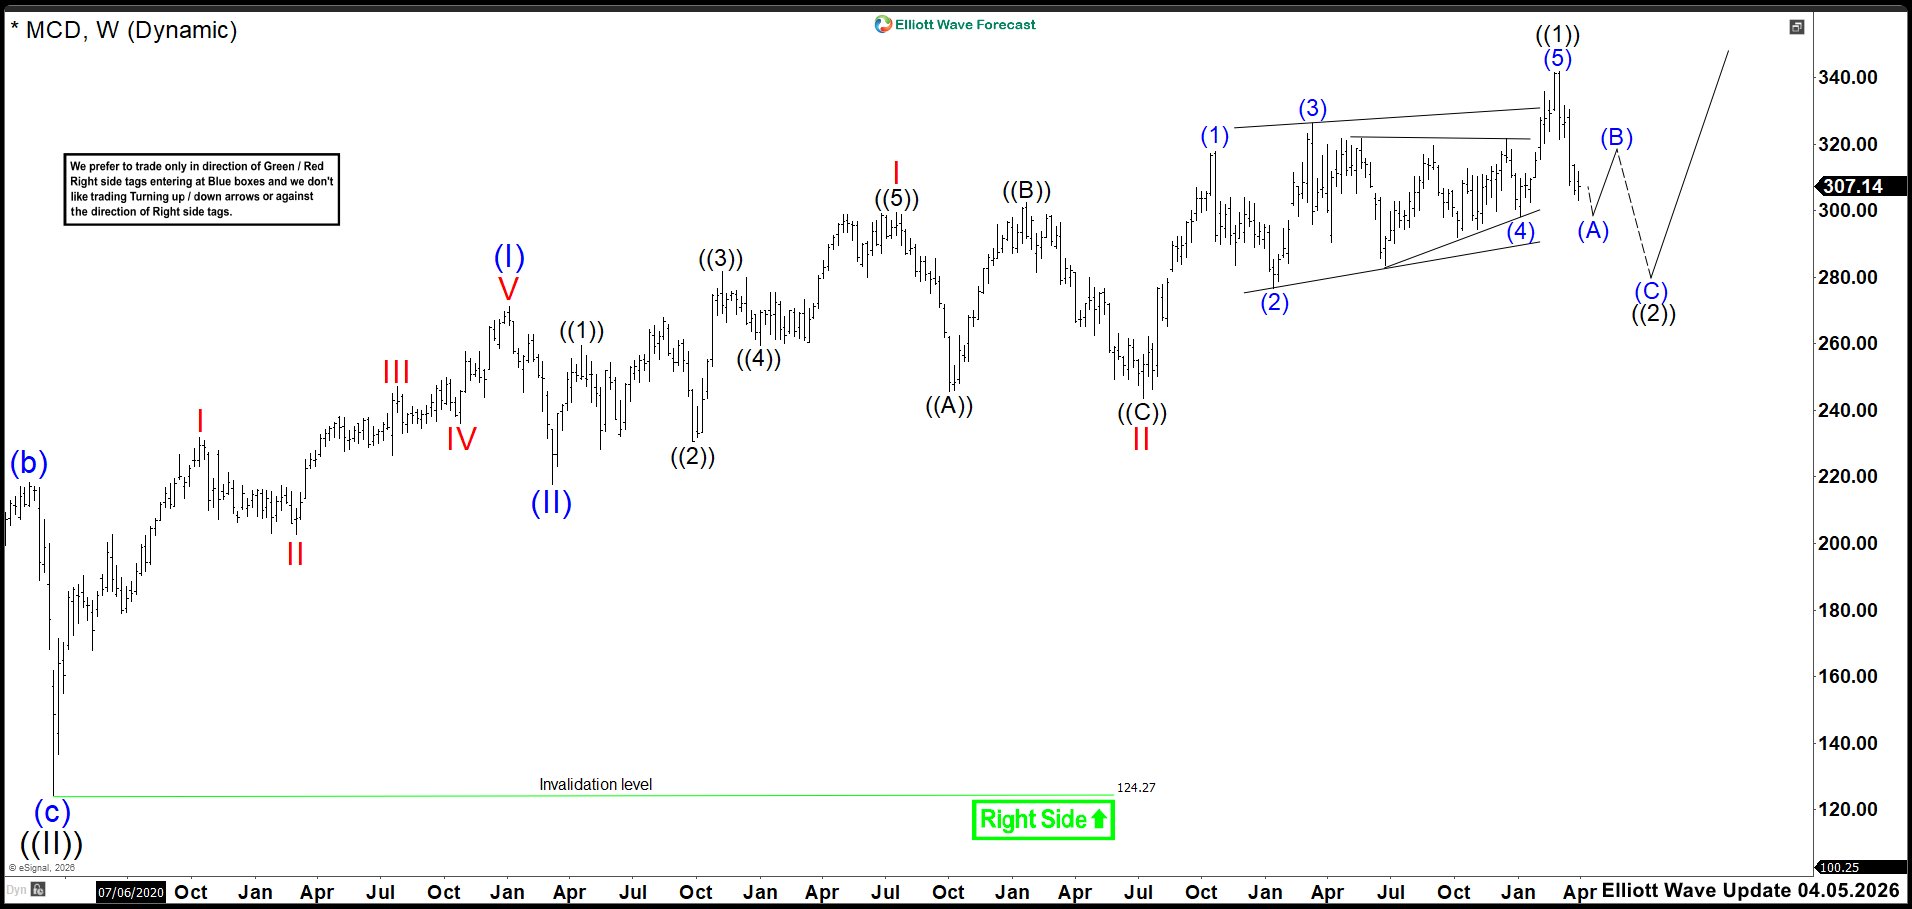
MCD looks set to correct the full advance that began in 2020. Moreover, price action already signals a developing Wave (II) retracement. The structure shows a clear break in momentum, confirming pressure on the larger cycle. Technically, MCD holds initial support near $245, while it stays below the 50‑day average.
Looking ahead, Wave (II) should target the key Fibonacci retracement zones of the 2020 cycle. Still, the bullish trend remains valid while the 2020 origin stays intact. As a result, traders expect a multi‑month pullback before Wave (III) resumes. A sustained drop under $245 would strengthen the Wave (II) outlook.
Elliott Wave Outlook: McDonald’s MCD Weekly Chart April 2026
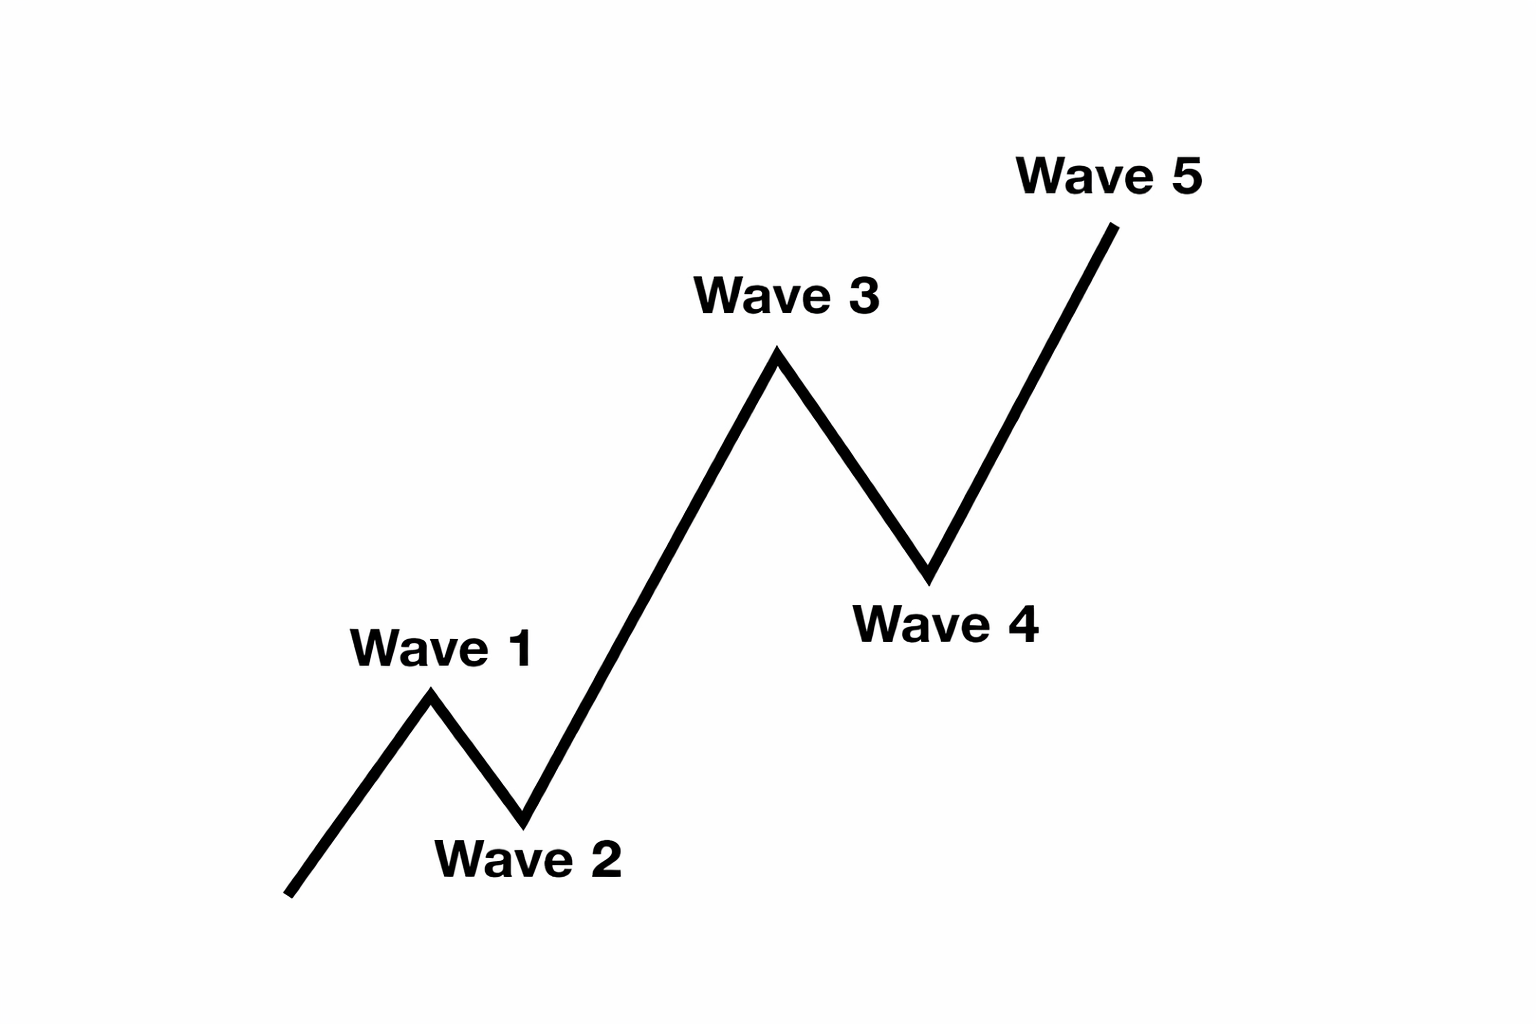
Elliott Wave Principle Behind the Market Structure
Impulse
An impulse is a clean 5‑wave pattern that drives the trend forward.
- Waves 1‑3‑5 are strong and directional.
- No overlap between waves 1 and 4.
- Wave 3 is usually the strongest.
- Structure is clear, with increasing momentum.
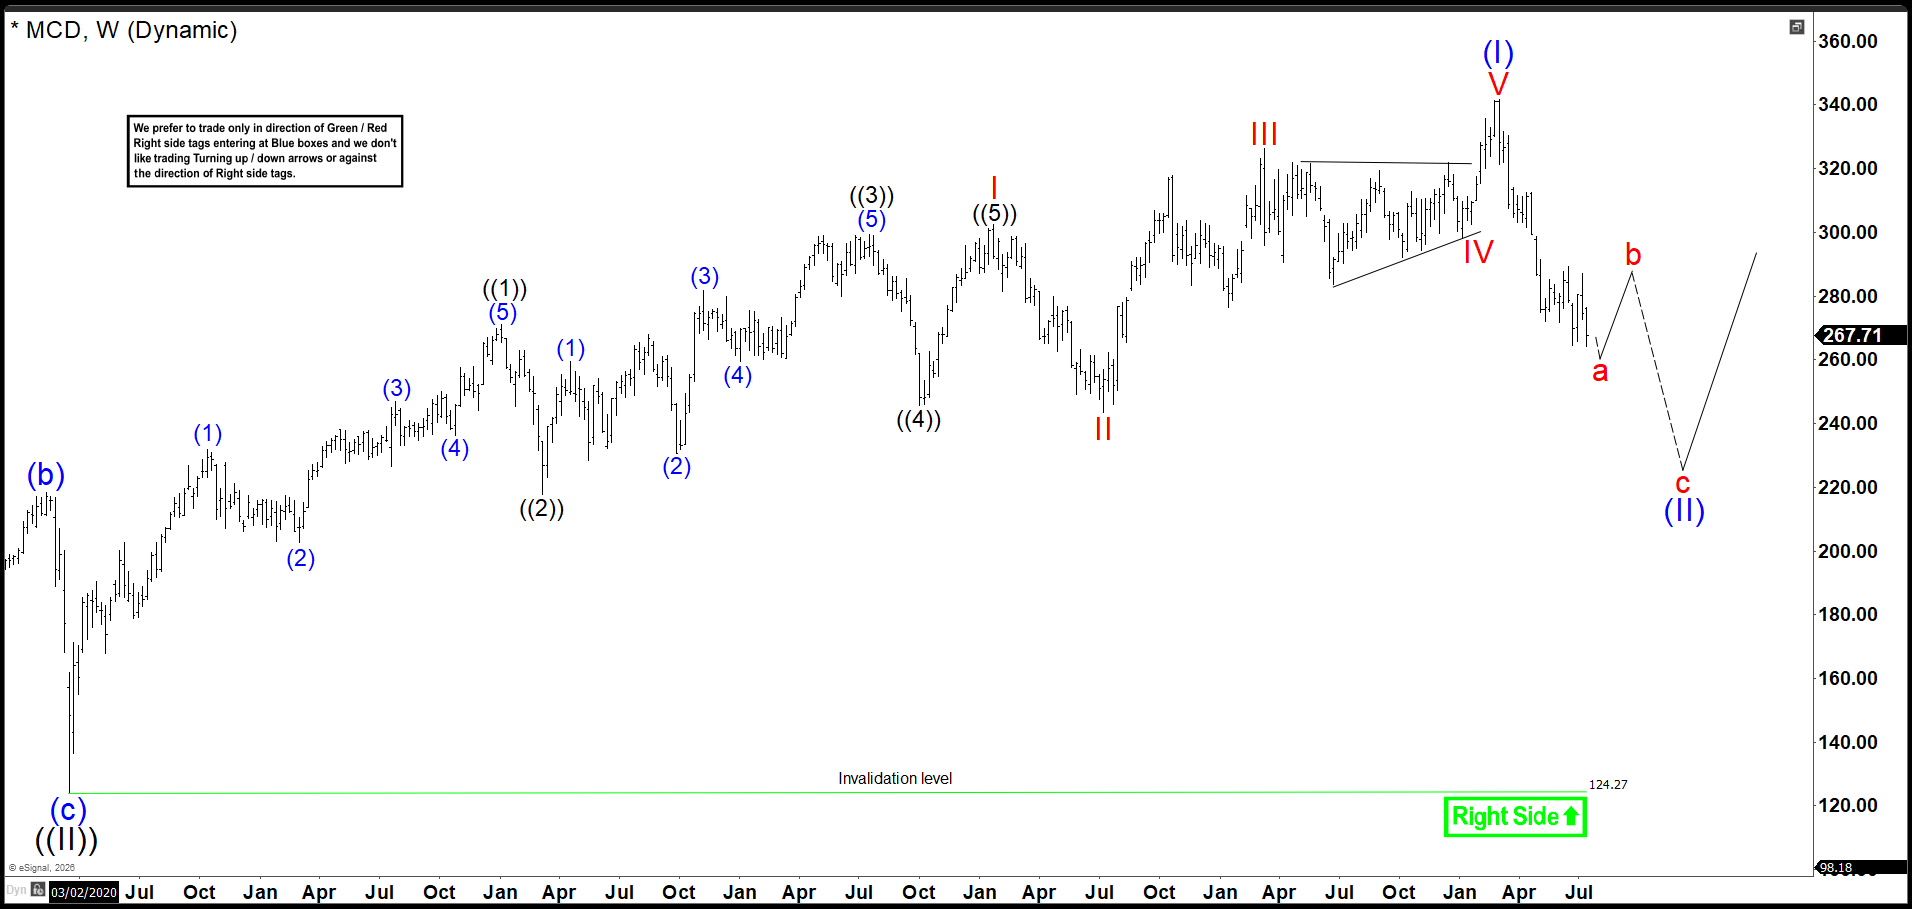
The latest update shows the decline keeps extending, which suggests MCD may be correcting the full cycle from the 2020 low. Therefore, I removed the triple nest and labeled a leading diagonal as wave (I). Now we should expect a rebound soon, which implies the market trades in wave b, which should fail and allow wave c of (II) to continue lower.
This correction could reach the 259.00–207.56 area. If we see a rebound there, the rally may resume and confirm the broader bullish continuation.
Transform Your Trading with Elliott Wave Forecast!
Ready to take control of your trading journey? At Elliott Wave Forecast, we provide the tools you need to stay ahead in the market:
Blue Boxes: Stay ahead in the market with fresh 1-hour charts updated four times daily, daily 4-hour charts on 78 instruments, and precise Blue Box zones that highlight high-probability trade setups based on sequences and cycles.
Live Sessions: Join our daily live discussions and stay on the right side of the market.
Real-Time Guidance: Get your questions answered in our interactive chat room with expert moderators.
🔥 Special Offer: Start your journey with a 14-day trial for only $0.99. Gain access to exclusive forecasts and Blue Box trade setups. No risks, cancel anytime by reaching out to us at support@elliottwave-forecast.com.
💡 Don’t wait and get a DISCOUNT for any plan!
Click in the next link, go to Home Chat and ask for a flat discount code saying that you saw this in Luis’ Blog: 🌐




