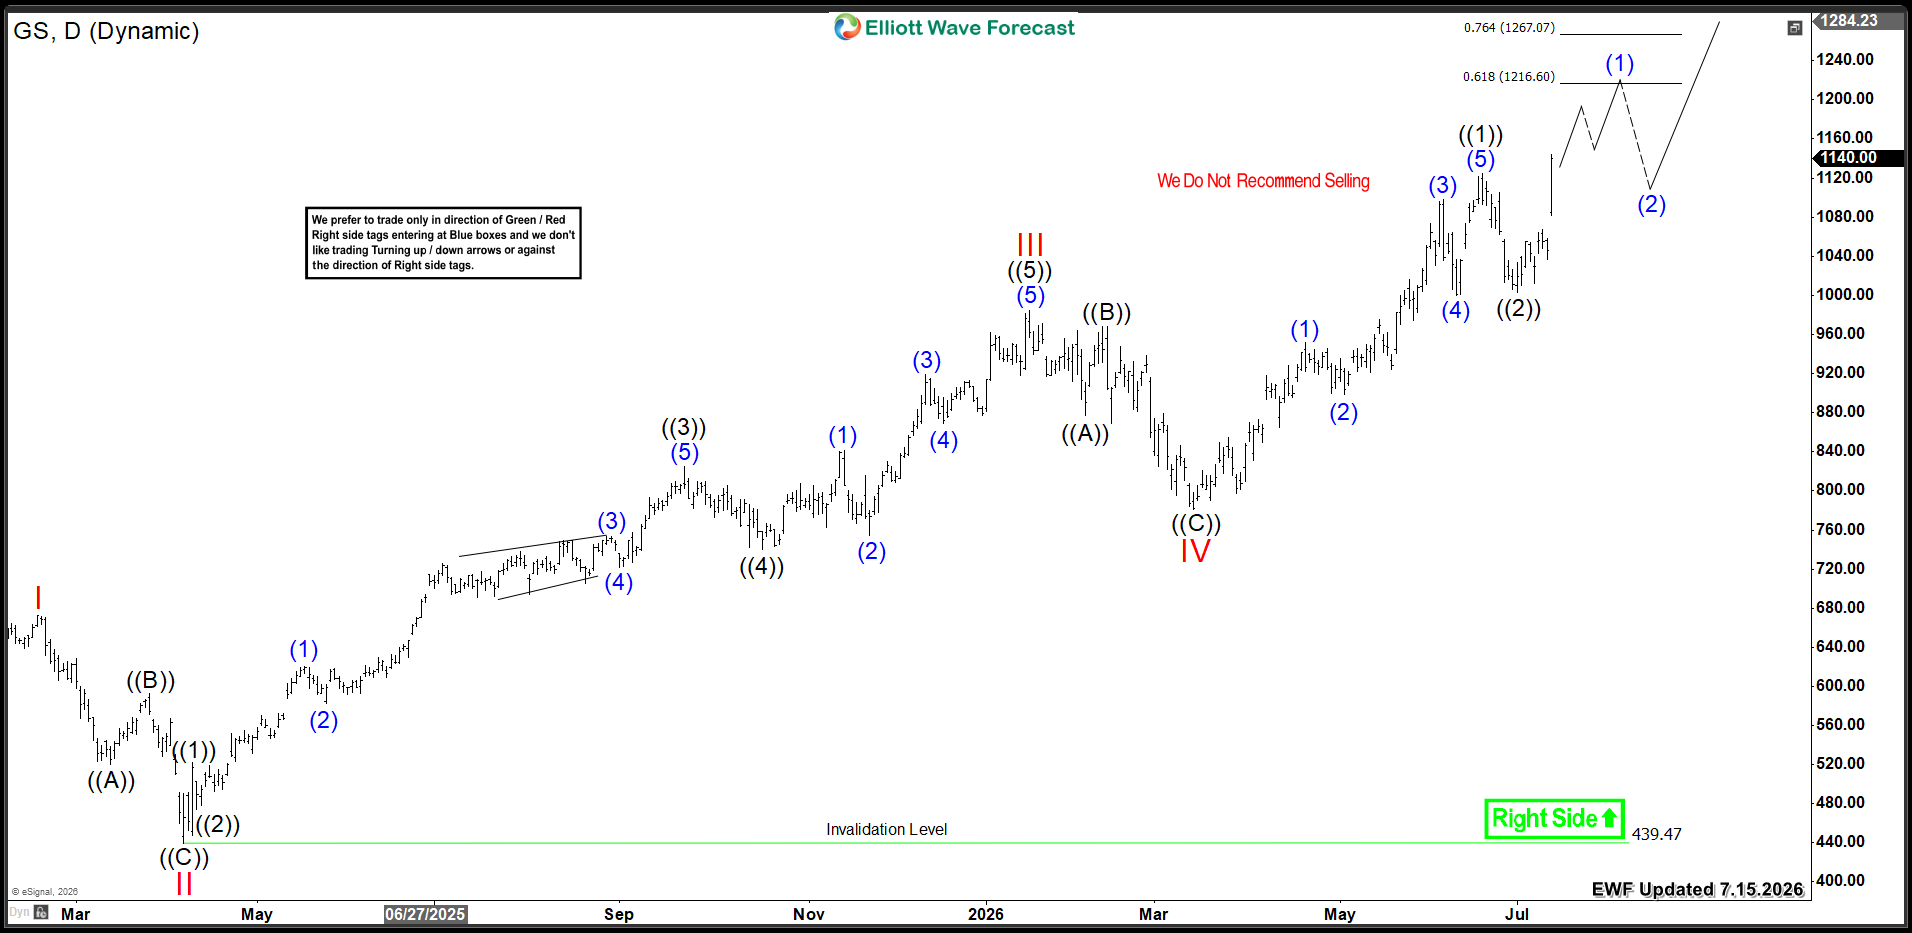
Goldman Sachs (NYSE: GS) extended its rally to new all-time highs. The stock broke above the $1000 milestone as we expected in our previous article. Today, we explore the Elliott Wave pattern dictating the current move. Our analysis explains the potential upside targets ahead.

Elliott Wave Analysis

Goldman Sachs extended its rally from the March 2026 low of $780. The stock broke above the wave III peak of $980. Then, it crossed the $1000 milestone, opening the door for further upside. GS established an initial five-wave advance in wave ((1)), ending at $1125. Subsequently, wave ((2)) pulled back to $1003. Then, the stock resumed its rally higher in wave ((3)).

Therefore, GS must hold above the recent July low of wave ((2)). This support will allow the rally to continue. The next upside move should extend the stock toward the $1216 – $1267 target zone. Then, another correction will follow before further continuation.

Ideally, the cycle from the March 2026 low aims for the $1350 – $1560 equal legs area. This would set the stage for a stronger rally by year-end.

GS Daily Chart 7.15.2026

Goldman Sachs GS Daily Chart 7.15.2026

Conclusion

Goldman Sachs’s bullish cycle suggests further continuation beyond $1300 . Consequently, investors should target buying opportunities within daily pullbacks. Utilize our Elliott Wave strategy for precise entry timing.

Get More Insights Today

Learn to trade our Blue Boxes using the 3, 7, or 11 swings sequence. Try our services with a 14-day trial.

You will gain access to:

  • 78 instruments updated across 4 different time frames

  • Live Trading & Analysis Sessions with our Expert Analysts every day

  • 24-hour chat room support and much more

Explore our system to gain deeper insights into this methodology.

Elliott Wave Forecast Trial