Coinbase Correcting After Completing Wave I
Coinbase Global Inc. (NASDAQ: COIN) remains in a bullish Elliott Wave structure despite the recent weakness from its 2025 high. The weekly chart suggests the stock completed a large impulsive wave I before entering a corrective wave II, which remains in progress. The advance began from the 2022 low, where Coinbase completed waves ((1)) and ((2)) before extending into a strong wave ((3)). After a corrective wave ((4)), buyers returned once again, driving the stock higher to complete wave ((5)). This final advance completed the larger degree wave I, confirming the end of the first impulsive cycle from the 2022 low.
Wave II Moving Toward the Blue Box Support Zone
Following the completion of wave I, Coinbase has entered a larger degree wave II correction. The decline is still unfolding and appears incomplete, suggesting additional downside before the correction reaches its conclusion.
Our preferred support area lies between 118.44 and 86.59, which represents the 50% to 61.8% Fibonacci retracementof the entire wave I advance. At Elliott Wave Forecast, we identify this blue box as a high-probability reversal area where corrective structures frequently end and buyers return. As the stock approaches this region, we will monitor the price action for a completed corrective sequence that can signal the end of wave II.
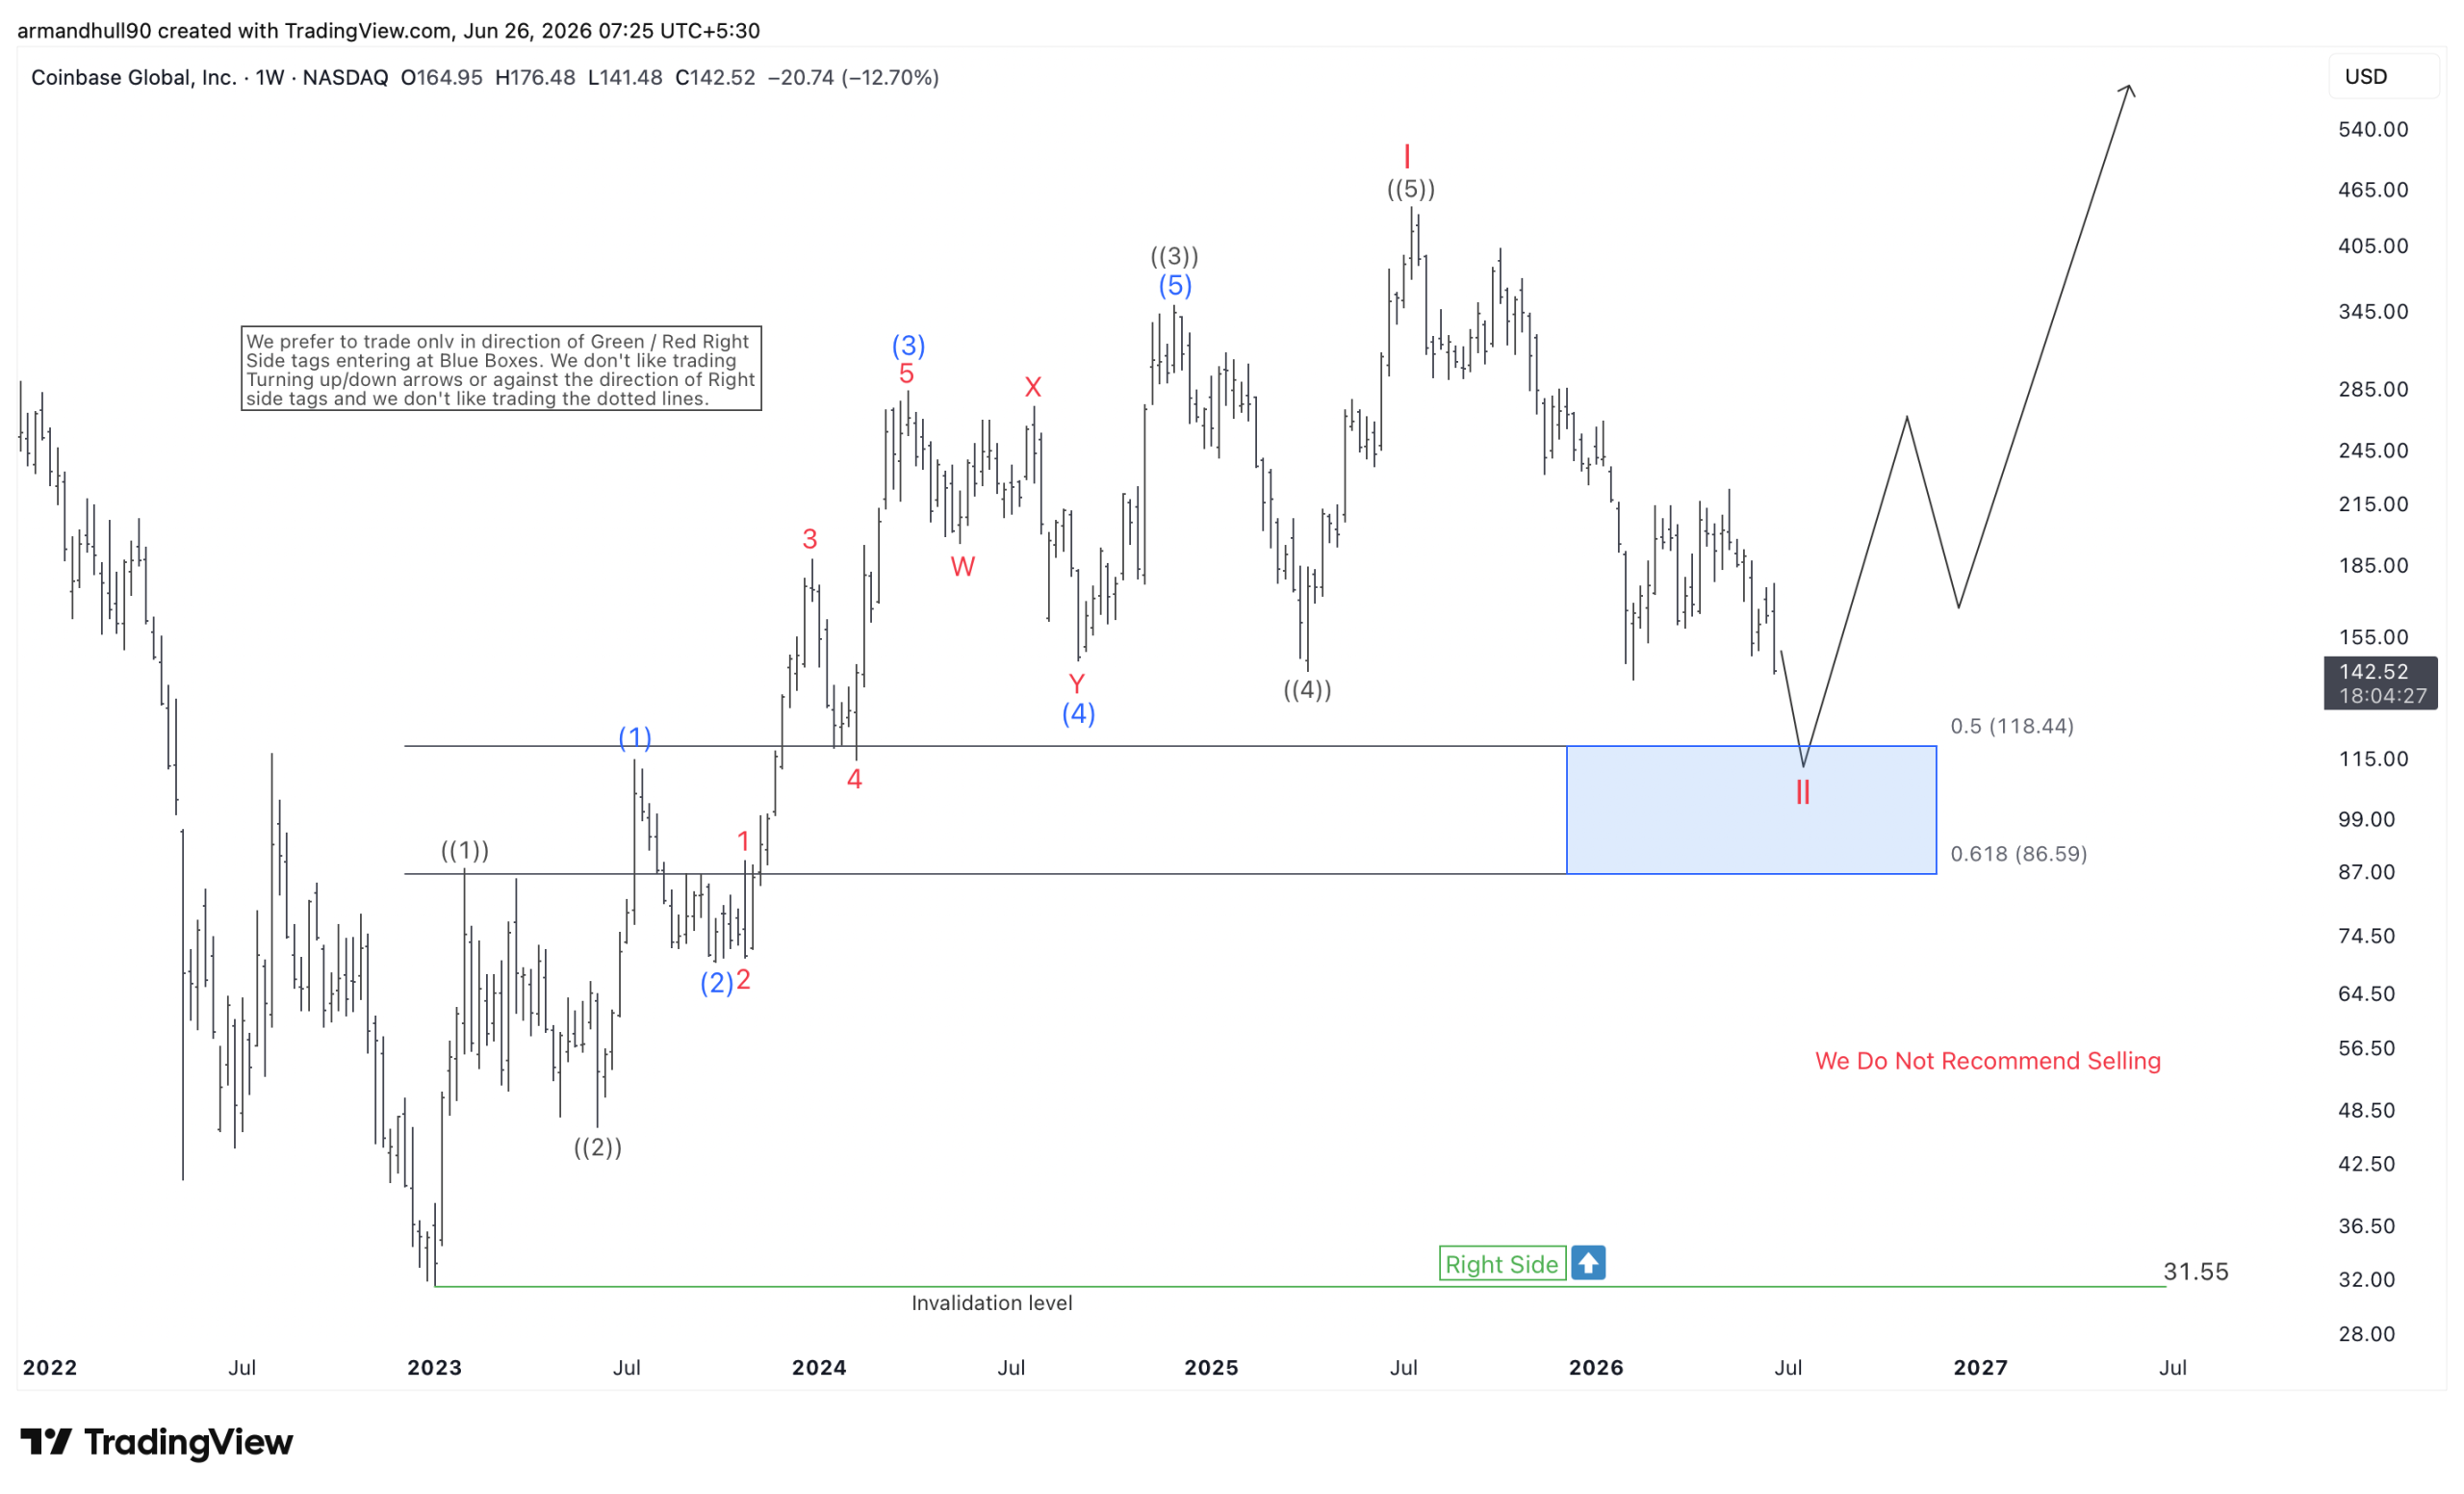
COIN Elliott Wave Forecast
From an Elliott Wave perspective, we do not recommend selling into the current decline. Instead, we continue to favor buying corrective pullbacks once they reach our blue box support area. As long as Coinbase remains above the long-term invalidation level at 31.55, the larger bullish count remains valid. Once wave II completes, we expect the stock to begin wave III, which should resume the long-term uptrend and eventually break above the previous wave I high.
The larger structure continues to favor higher prices, making the current correction a potential buying opportunity rather than the start of a new bearish trend.
Conclusion
Coinbase remains within a larger bullish Elliott Wave cycle despite the ongoing wave II correction. We expect the decline to find support in the 118.44–86.59 blue box before buyers regain control. As long as price stays above 31.55, the preferred scenario remains for wave III to resume the uptrend and carry Coinbase to new highs.
About Elliott Wave Forecast
At www.elliottwave-forecast.com, we update one-hour charts four times daily and four-hour charts once daily for all 78 instruments. We also conduct daily live sessions to guide clients on the right side of the market. Additionally, we have a chat room where moderators answer market-related questions. Experience our service with a 14-day trial for only $0.99. Cancel anytime by contacting us at support@elliottwave-forecast.com.


