Hello fellow traders. In this technical article we’re going to take a look at the Elliott Wave charts charts of RUSSELL Futures $RTY_F published in members area of the website. As our members know we are favoring the long side in Indices. RUSSELL made clear 3 waves down from the 2918 peak and completed correction right at the Equal Legs zone . In further text we’re going to explain the Elliott Wave pattern and trading setup.
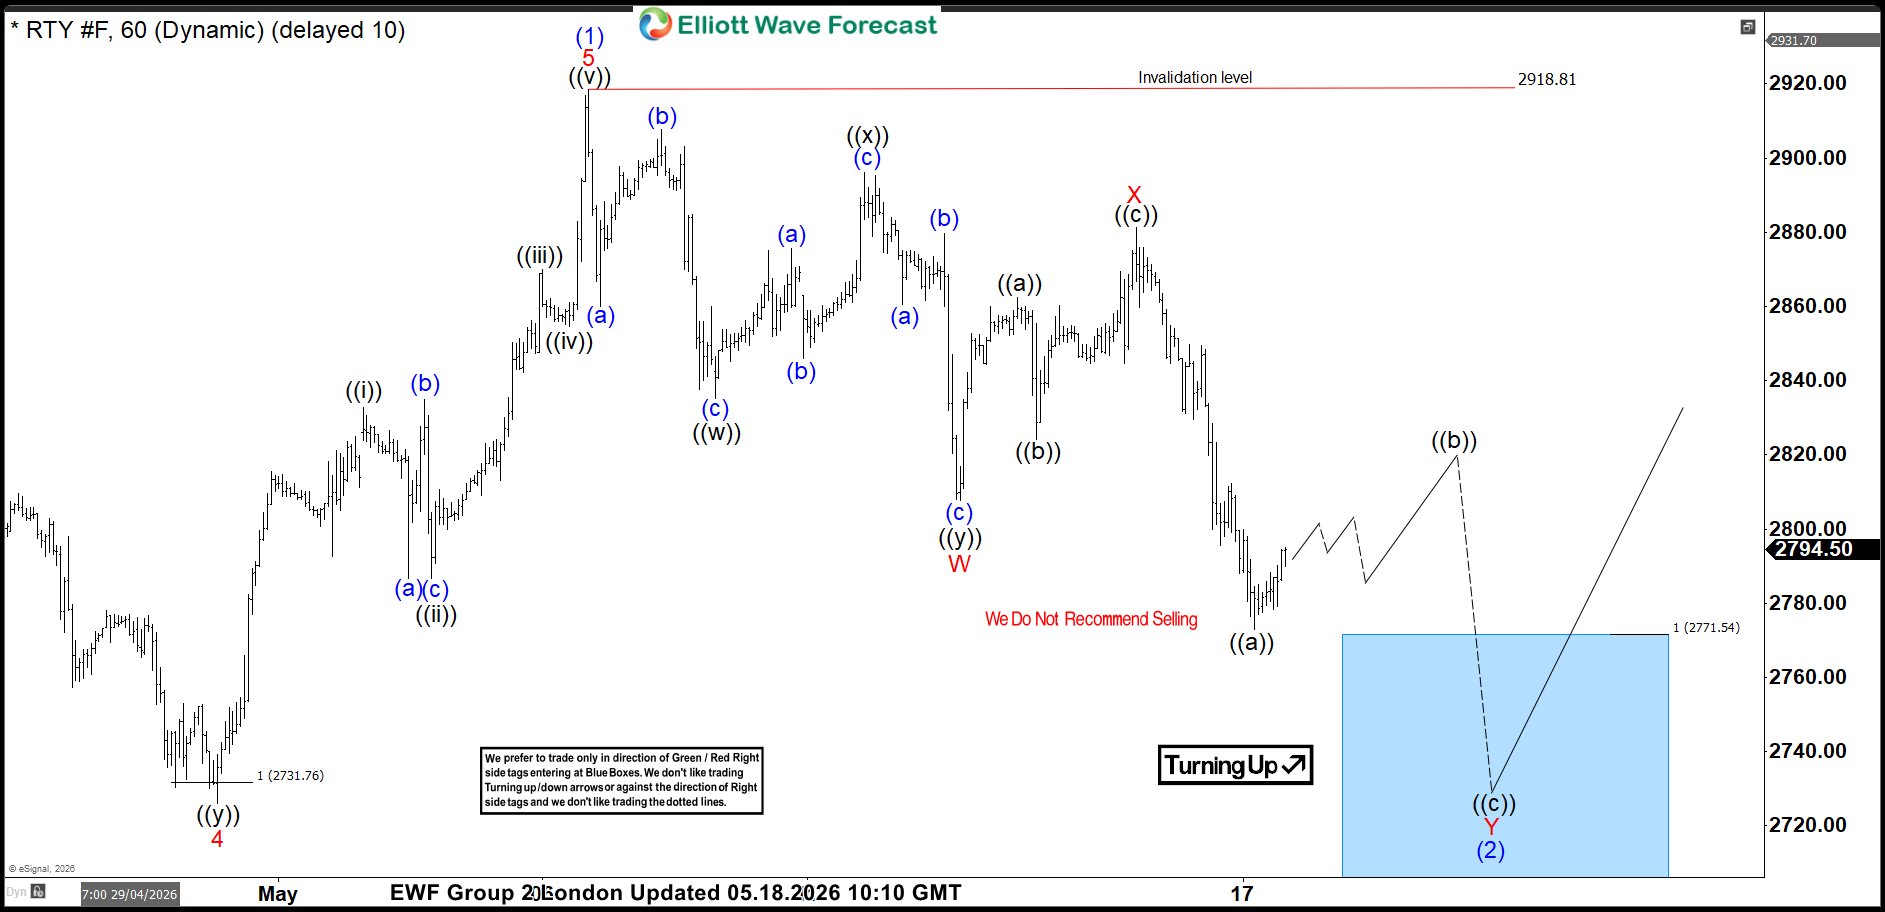
RUSSELL Elliott Wave 1 Hour Chart 05.18.2026
RUSSELL is showing lower low sequences from the peak, suggesting pull back is still in progress. The price structure is incomplete at the moment, calling for another leg down toward : 27771.54-2703.25 area. Our members know that we constantly emphasize the importance of incomplete sequences, as these determine the market’s path. We don’t recommend selling RTY_F and prefer the long side from the marked Blue Box ( buying zone). Once RUSSELL reaches our buying area, it should ideally make either rally toward new highs or in 3 waves bounce alternatively. Once bounce reaches 50 Fibs against the X red high, we will make long position risk free ( put SL at BE) and take partial profits.
Official trading strategy on How to trade 3, 7, or 11 swing and equal leg is explained in details in Educational Video, available for members viewing inside the membership area.
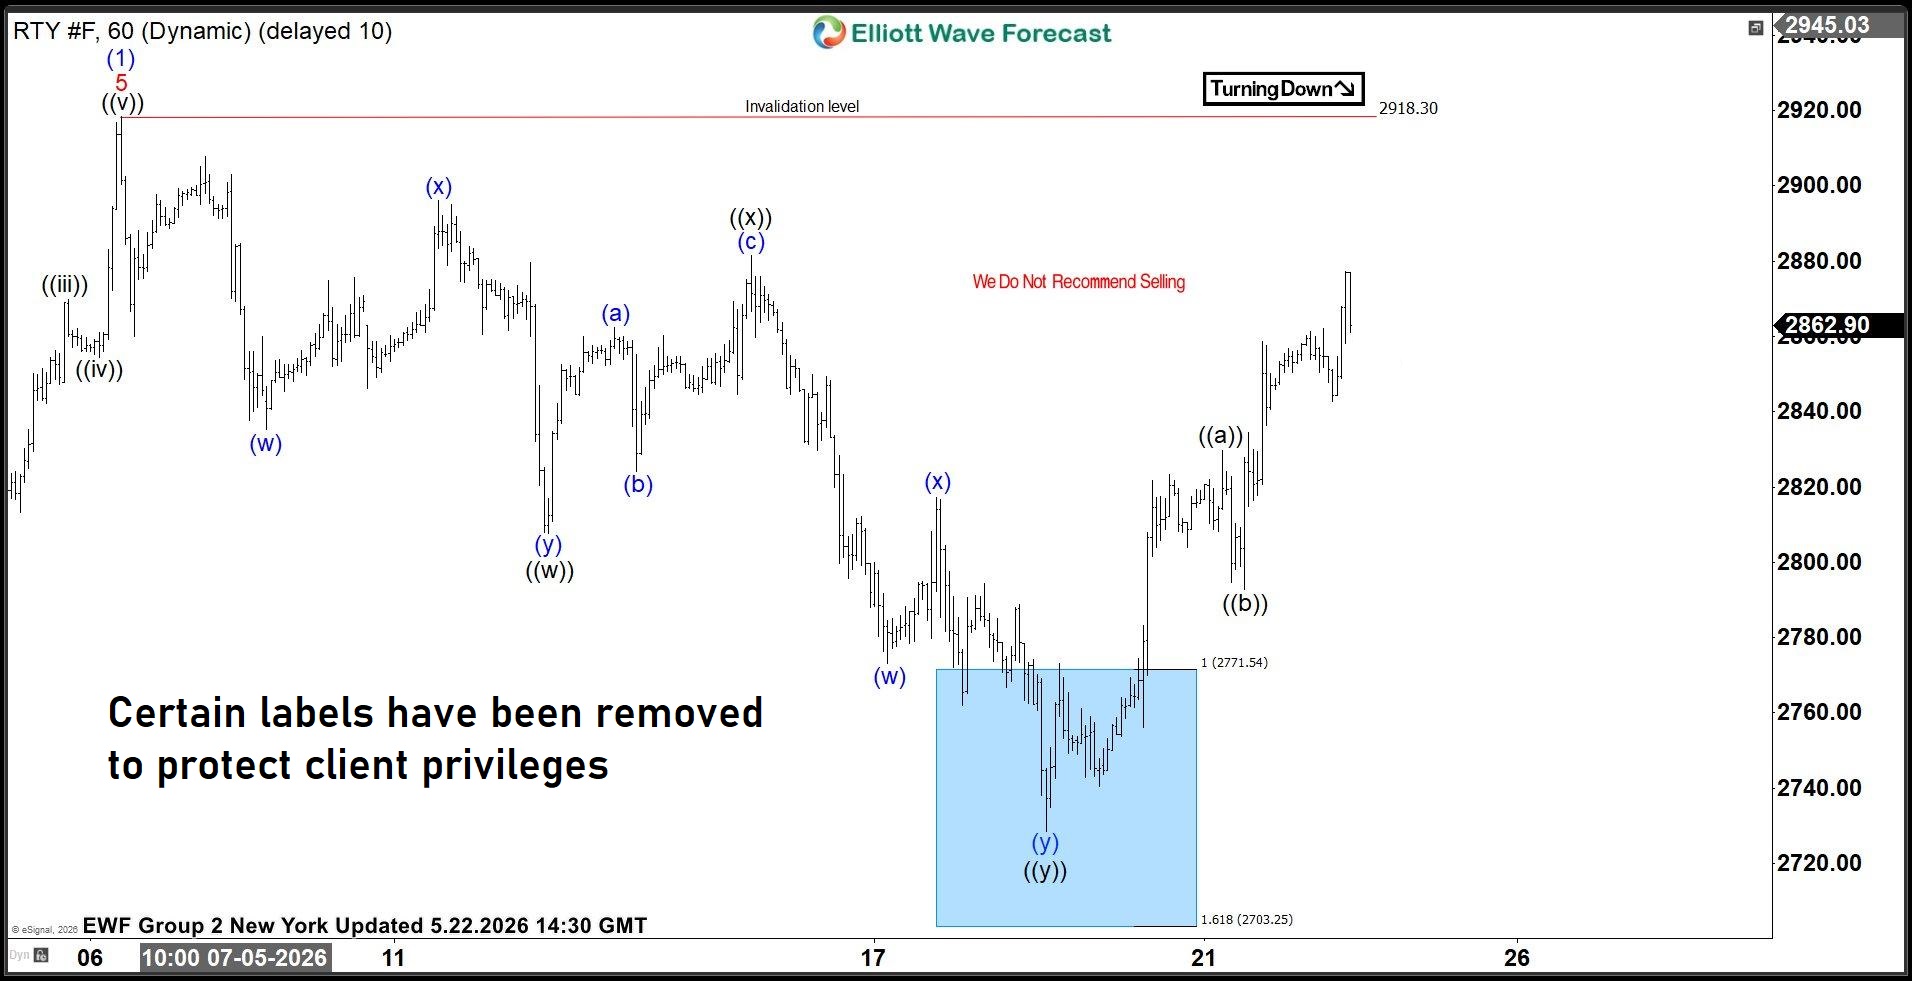
RUSSELL Elliott Wave 1 Hour Chart 05.22.2026
RUSSELL reached our buying zone at : 27771.54-2703.25 area and found buyers as expected. RTY_F is giving us very good reaction from the Blue Box Area. Consequently, any long positions should be risk free by now. 2918.3 is important pivot at this stage.
You can check the latest charts and target levels in the membership area of the site. The best instruments to trade are those with incomplete bullish or bearish swings. These are listed in the Sequence Report, and the best ones are shown in the Live Trading Room.
90% of traders fail because they don’t understand market patterns. Are you in the top 10%? Test yourself with this advanced Elliott Wave Test
Thank you for exploring our Russell technical article with us. While we analyze 78 instruments, it’s important to remember that not every chart represents a trading recommendation. For official trading signals, we invite you to join our Live Trading Room, where we provide actionable insights in real-time. If you’re not yet a member, take advantage of our 14-day trial to unlock new trading opportunities.
Over the years, we’ve developed a reliable trading strategy that clearly defines entry, stop loss, and take profit levels. By joining us, you’ll gain access to expert guidance and the chance to refine your trading skills
Join us today !
 Elevate your trading with Elliott Wave Forecast!
 Ask unlimited questions during trading hours (Monday to Friday). Our Chat Rooms are an excellent place to learn, with continuous support from our market experts!
 Explore our expert insights and real-time analysis covering Forex, Indices, Commodities, Cryptocurrencies, Stocks, and ETFs across 78 instruments.
 Gain exclusive access to our Official Trading Recommendations in the Live Trading Room, where seasoned experts provide valuable insights and guidance on new trading opportunities.
 For just $0.99, unlock a wealth of knowledge and experience with our 14-day Trial. Experience firsthand our proven trading strategy, which accurately defines Entry, Stop Loss, and Take Profit levels, empowering you to make informed decisions with confidence.
 Ready to take the next step? Get your 14-day Trial in just a few clicks!
Offer Expires Soon!
Get full access to real-time Signals, Live Sessions, 24 Hour Chat Room Support and Expert Analysis — all for only $9.99 during your 14-day trial.
⏳ This limited-time price will expire soon — don’t miss out!


