Hello fellow traders. In this technical blog we’re going to take a quick look at the Elliott Wave charts of AMD stock published in members area of the website. As our members know, AMD recently gave us a correction from the 241.58 peak, after which we called the drop in the stock. Recovery formed Elliott Wave Wave Zig Zag Pattern. In the further text we are going to explain the Elliott Wave Pattern and the Forecast.
Before we take a look at the real market example, let’s explain Elliott Wave Zigzag pattern.
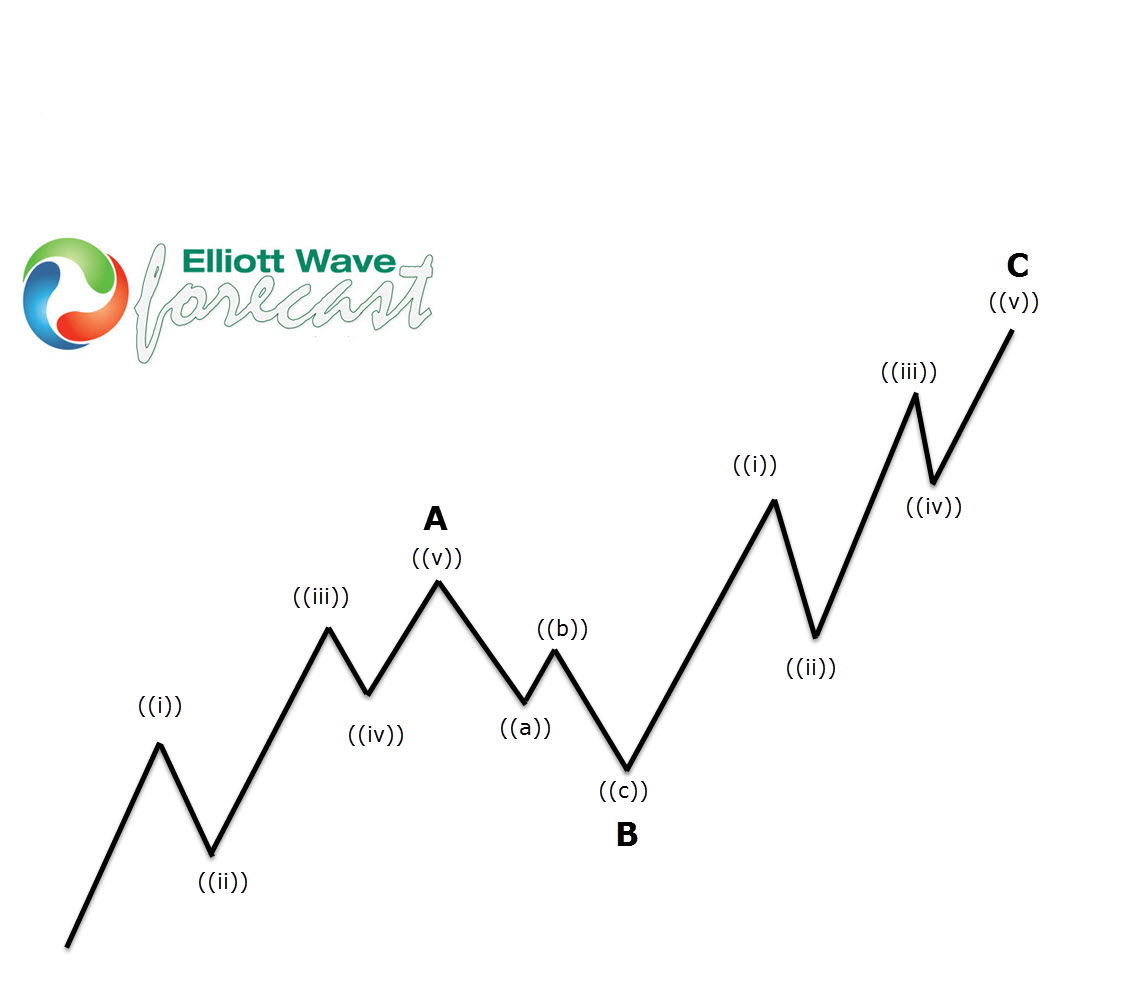
Elliott Wave Zigzag is the most popular corrective pattern in Elliott Wave theory . It’s made of 3 swings which have 5-3-5 inner structure. Inner swings are labeled as A,B,C where A =5 waves, B=3 waves and C=5 waves. That means A and C can be either impulsive waves or diagonals. (Leading Diagonal in case of wave A or Ending in case of wave C) . Waves A and C must meet all conditions of being 5 wave structure, such as: having RSI divergency between wave subdivisions, ideal Fibonacci extensions and ideal retracements.
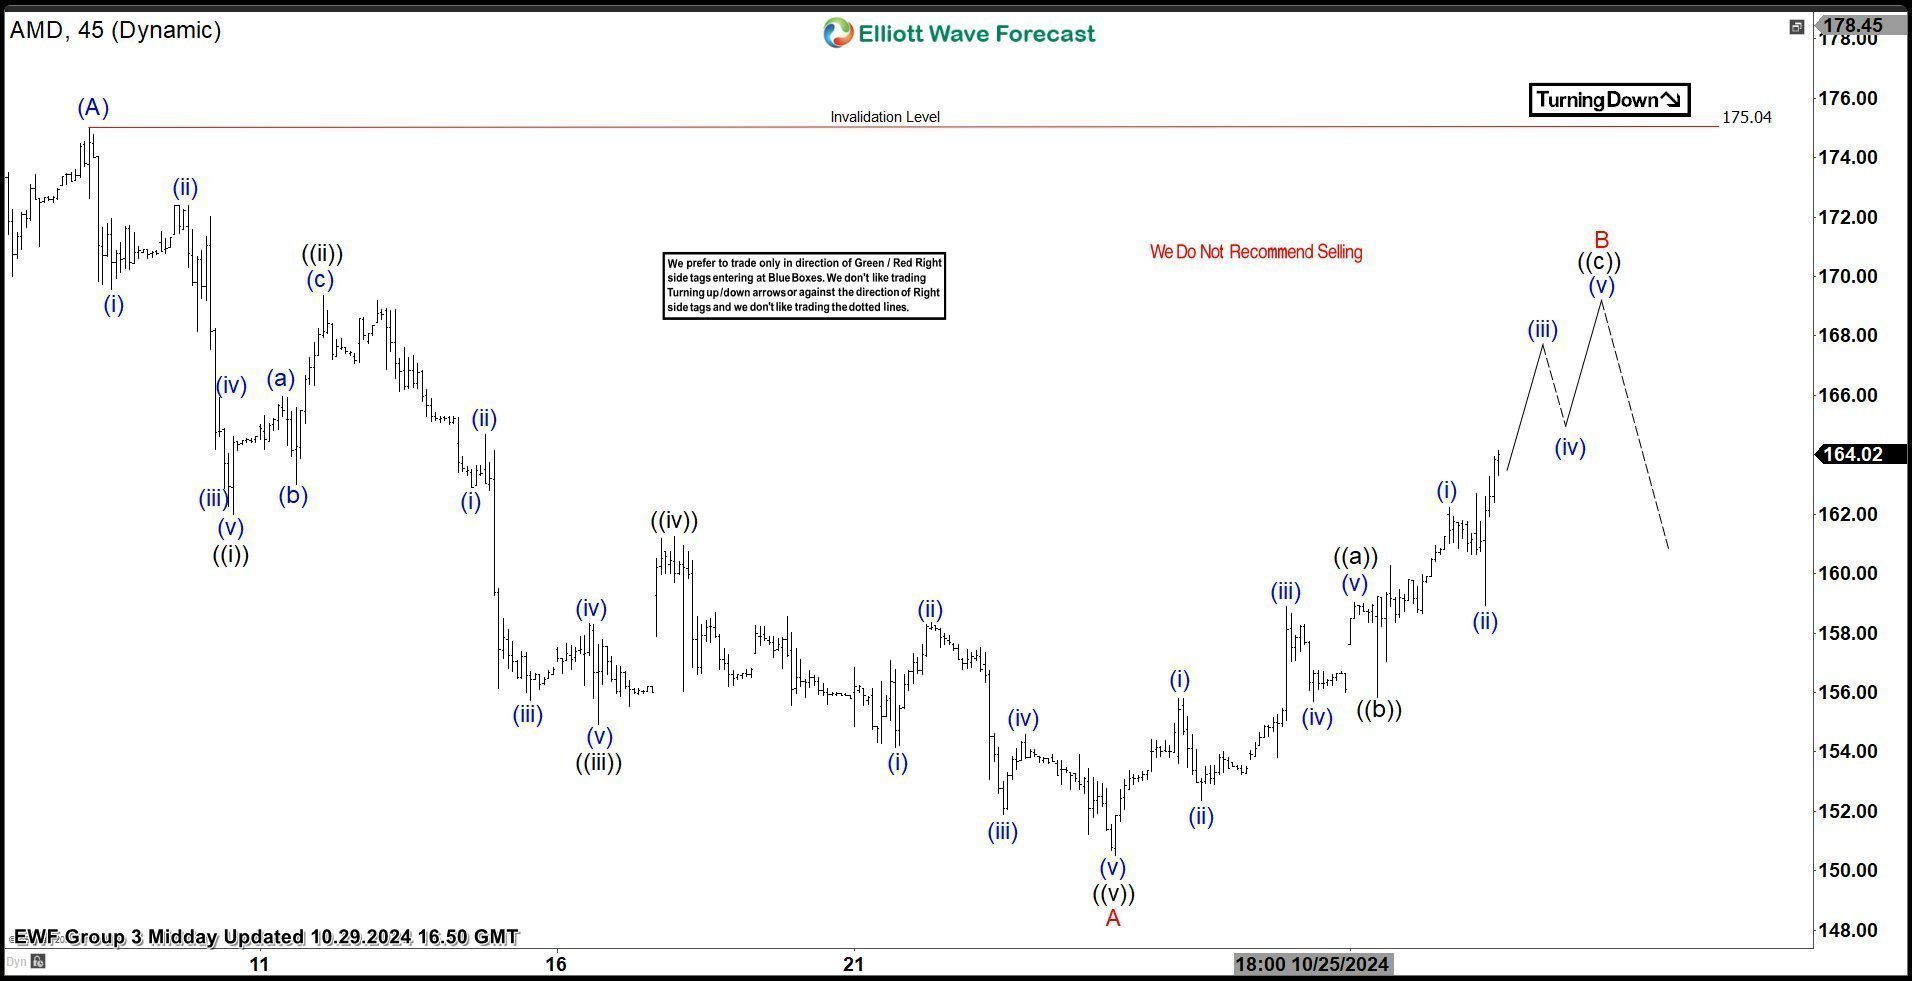
AMD H1 Elliott Wave Analysis 10.29.2024
is showing 5 waves down from the 175.04 peak . That indicates the stock ended only first leg of the larger pull back and we should ideally see further weakness once B red recovery completes. Wave B red correction looks to be unfolding as Elliott Wave Zig Zag pattern. First leg ((a)) of B is counted as 5 waves, which means C leg should also have a form of 5 waves pattern. Approximate area where (B) can end is equal legs ((a))- ((b)) . We don’t recommend buying the stock and expect to see decline in a 3 waves pull back at least or toward new lows ideally.
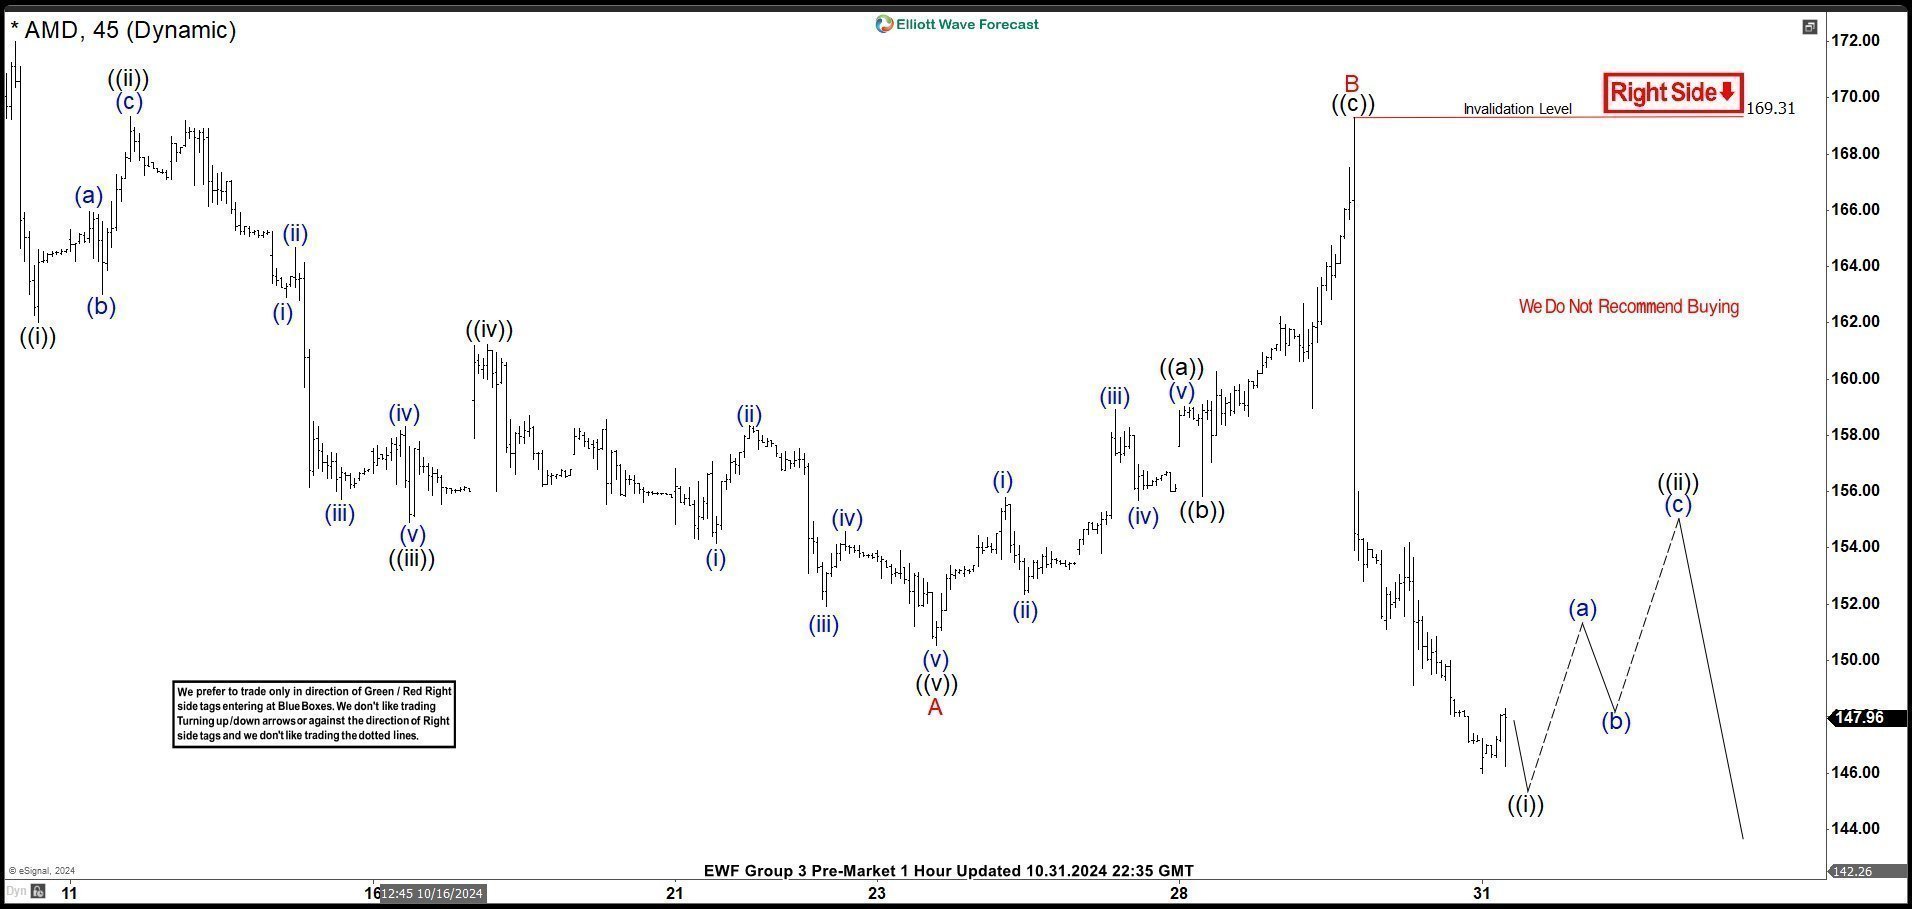
AMD H1 Elliott Wave Analysis 10.31.2024
The stock made decline after completing B red bounce as Elliott Wave Zig Zag pattern at 169.31 peak. We got a break down toward new lows as expected. As far as the price stays below 169.31 high, we can can see further weakness in near term.
Keep in mind market is dynamic and presented view could have changed in the mean time. You can check most recent charts in the membership area of the site. Best instruments to trade are those having incomplete bullish or bearish swings sequences.We put them in Sequence Report and best among them are shown in the Live Trading Room.