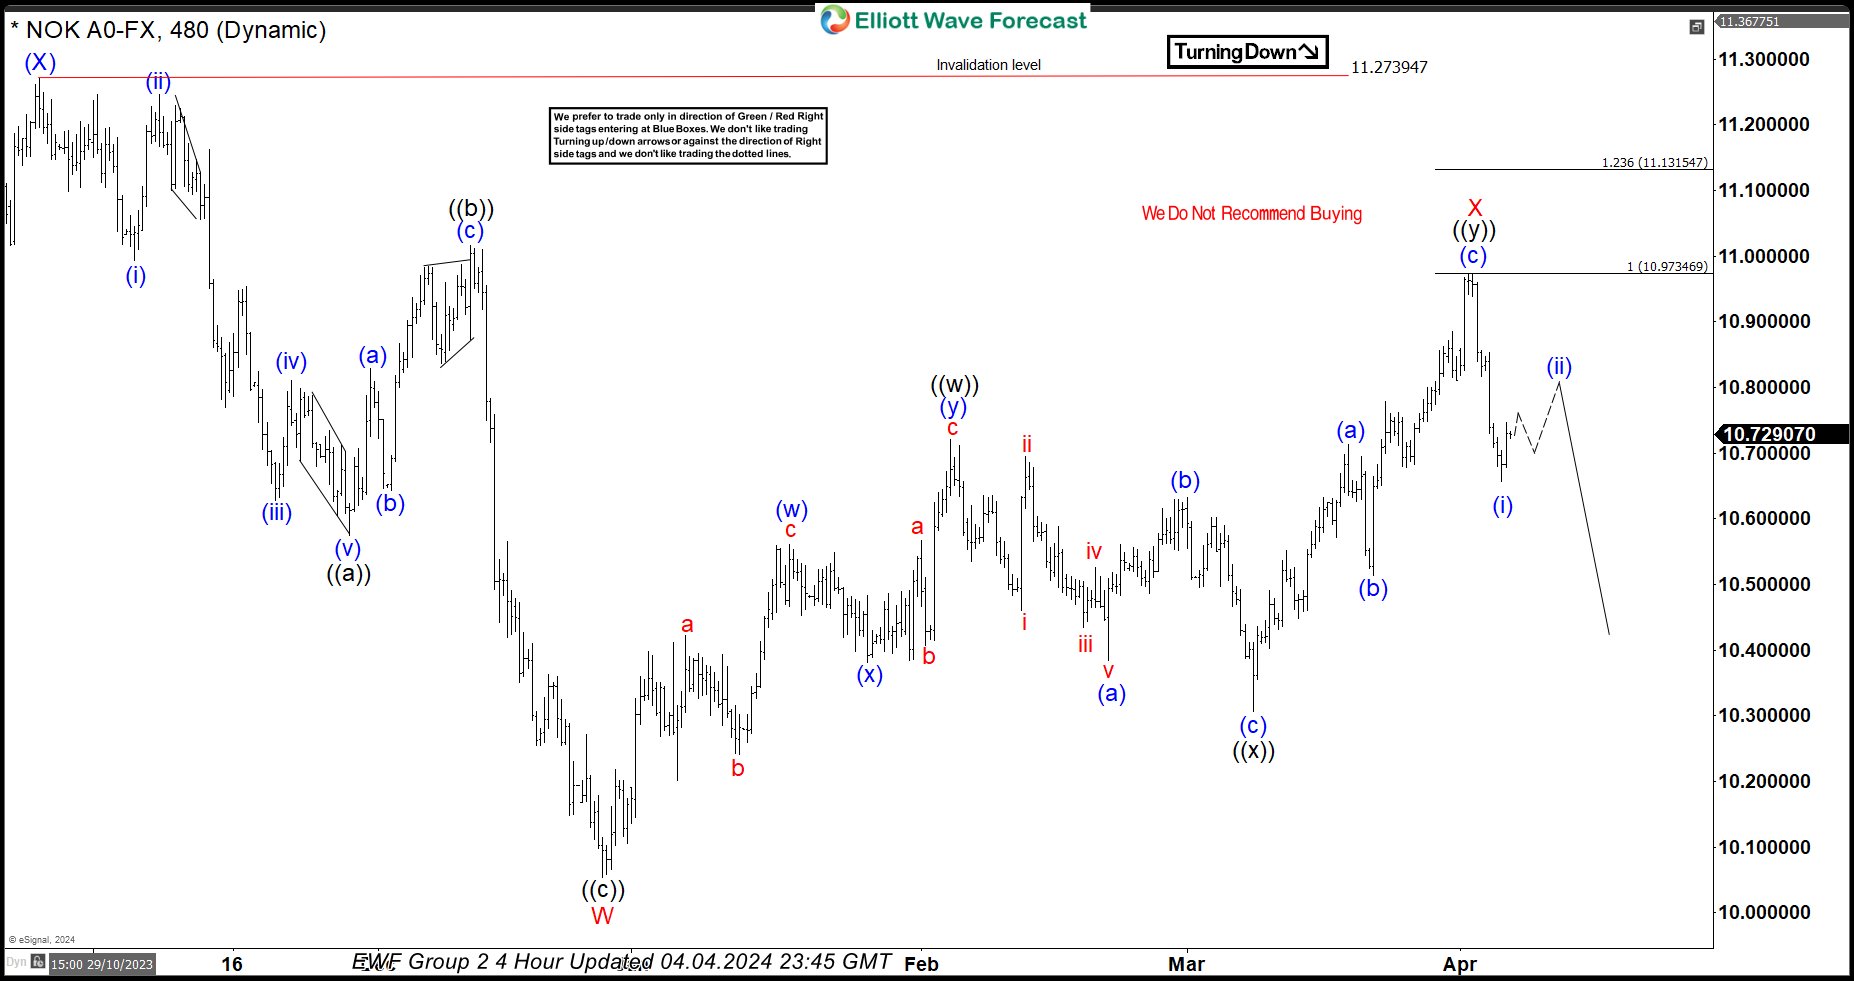
Hello fellow traders. In this technical article we’re going to take a look at the Elliott Wave charts charts of USDNOK published in members area of the website. As our members know USDNOK has recently made recovery that has unfolded as Elliott Wave Double Three Pattern. It made clear 7 swings from the December 27th low and completed correction right at the Equal Legs level. In further text we’re going to explain the Elliott Wave pattern and forecast
Before we take a look at the real market example, let’s explain Elliott Wave Double Three pattern.
Elliott Wave Double Three Pattern
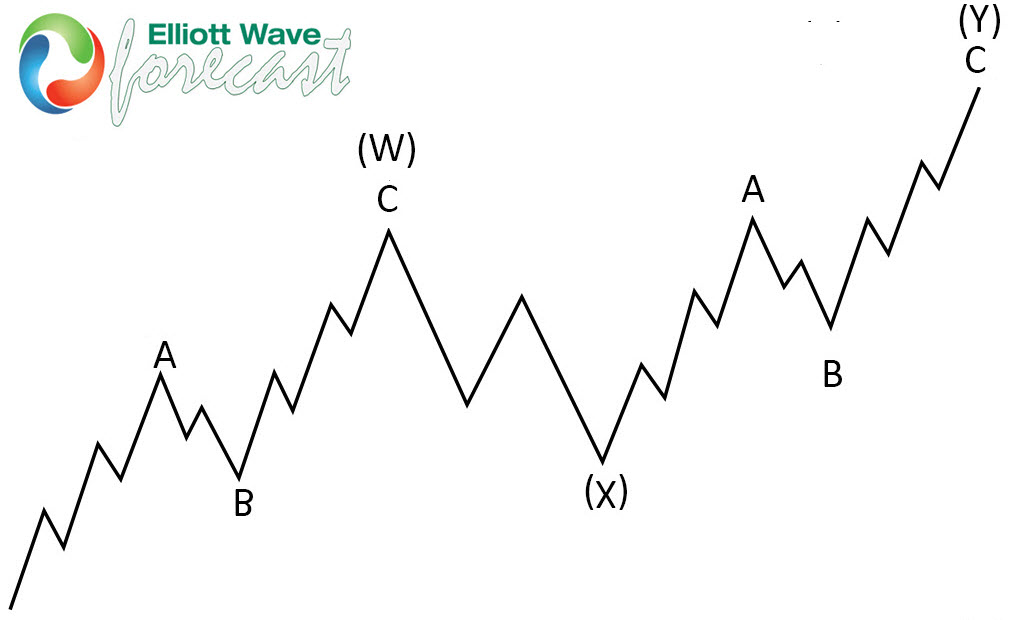
Double three is the common pattern in the market , also known as 7 swing structure. It’s a reliable pattern which is giving us good trading entries with clearly defined invalidation levels.
The picture below presents what Elliott Wave Double Three pattern looks like. It has (W),(X),(Y) labeling and 3,3,3 inner structure, which means all of these 3 legs are corrective sequences. Each (W) and (Y) are made of 3 swings , they’re having A,B,C structure in lower degree, or alternatively they can have W,X,Y labeling.
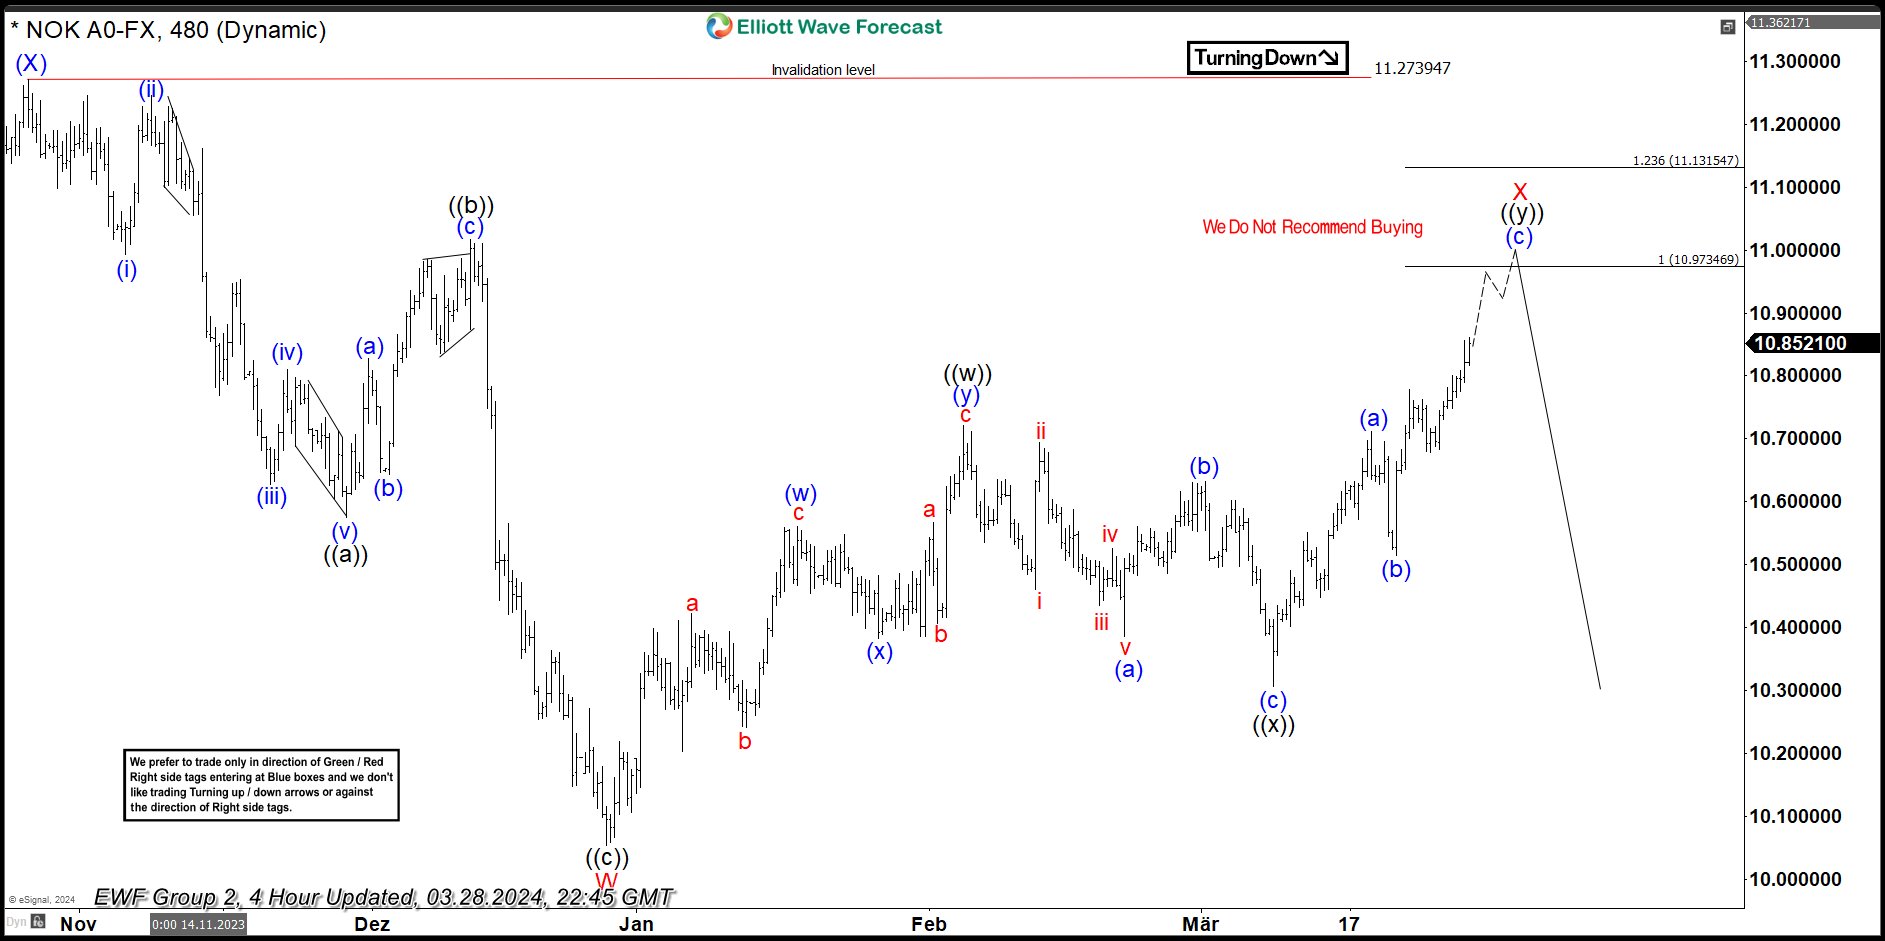
USDNOK 4 Hour Elliott Wave Analysis 03.28.2024
The current view suggests that USDNOK is trading within the cycle from the December 27th low, correcting the cycle from the 11.273 peak. The structure shows incomplete sequences of higher highs, suggesting that the red X connector may still be in progress toward the 1.9734-11.1315 area potentially. Upon closer examination, we can observe that the first leg ((w)) black formed with 3 waves. Subsequently, the ((x)) connector also completed 3 waves, around the 61.8% Fibonacci Retracement zone. This suggests that the red X recovery is unfolding as an Elliott Wave Double Three Pattern.
You can learn more about Elliott Wave Double Three Patterns at our Free Elliott Wave Educational Web Page.
USDNOK 4 Hour Elliott Wave Analysis 04.04.2024
Keep in mind that market is dynamic and presented view could have changed in the mean time. You can check most recent charts with target levels in the membership area of the site. Best instruments to trade are those having incomplete bullish or bearish swings sequences. We put them in Sequence Report and best among them are shown in the Live Trading Room