
The Power of 3-7-11 and the Grand Super Cycle: How We Saw the Bullish Turn in April 2025 Back on April 9, 2025, while World Indices were dropping sharply and global sentiment had turned overwhelmingly bearish, we published an article that challenged the fear-driven narrative. We explained why selling was not the right approach and […]
-

2025 & The Elliott Wave Theory: Welcome to the Era of the Machines
Read MoreRalph Nelson Elliot developed the Elliott Wave Theory in the 1930s by. Influenced by Dow Theory and his extensive observation of market behavior, Elliott concluded that stock market movements follow repetitive and identifiable wave patterns. According to the theory, price action broke down in to two parts. First is in the motive wave that moves in […]
-

Invesco NASDAQ ETF $QQQ Pullbacks Offering Bullish Entry Points
Read MoreHello everyone! In today’s article, we’ll examine the recent performance of Invesco NASDAQ ETF ($QQQ) through the lens of Elliott Wave Theory. We’ll review how the rally from the April 21, 2025 low unfolded as a 5-wave impulse followed by a 3-swing correction (ABC) and discuss our forecast for the next move. Let’s dive into the structure and expectations for this […]
-

Ford (F) Stock: A Temporary Rebound Before Further Declines?
Read MoreFord’s stock finally rebounded after months of decline. Earlier, we predicted a failed rally that would push prices lower. Instead, the stock kept falling. Now, it’s bouncing back—but will it last? According to Elliott Wave analysis, this rally seems weak. Ford’s stock will likely drop again, sinking below $8 soon. Several issues weigh on Ford. […]
-

The Crypto Wave: Bitcoin $200K Journey and Alt-Season Forecast
Read MoreWe conducted a Crypto webinar on Friday, 23rd May 2025 at 1:00 PM EDT / 5:00 PM GMT which was streamed live at @Elliottwaveforecast youtube channel. 🚨 Will Bitcoin really hit $200,000 this cycle? When will altcoins EXPLODE? Join our exclusive free live webinar to discover: 🔥 Elliott Wave analysis predicting Bitcoin’s top 🔥 Altseason trigger signals 🔥 Top 5 […]
-

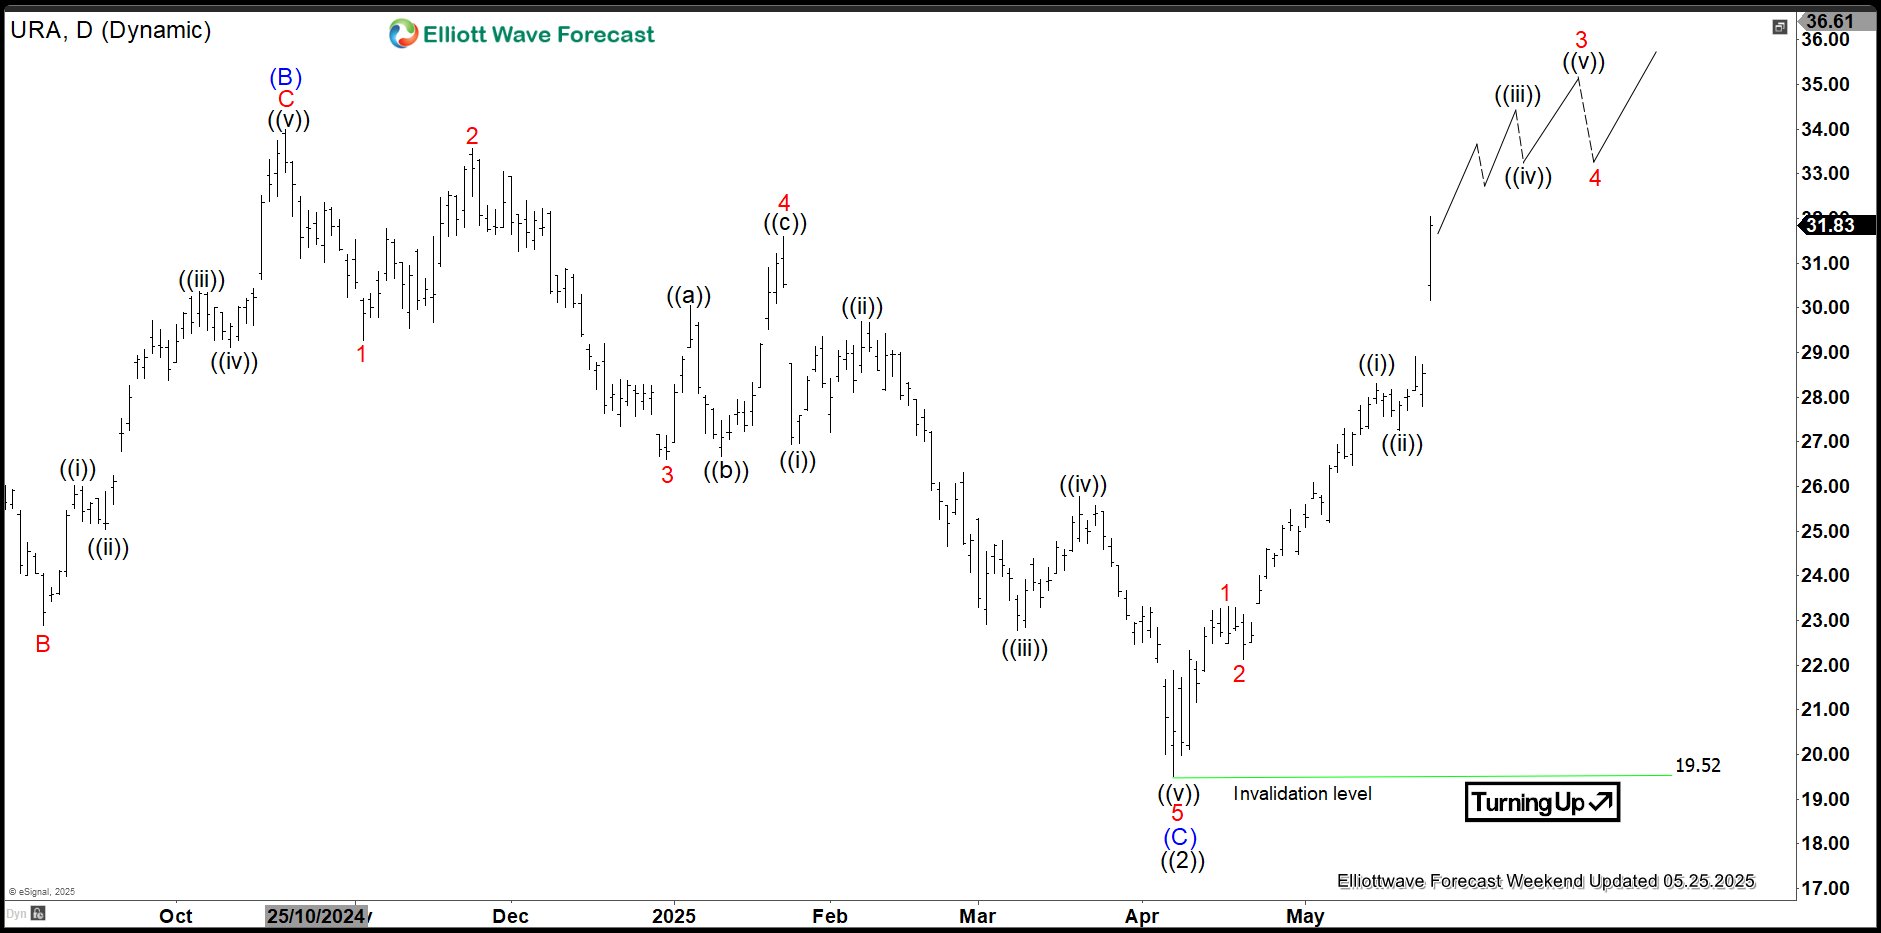
Uranium Miners ETF (URA) Back on Bullish Path
Read MoreThe ticker symbol URA corresponds to the Global X Uranium ETF, an exchange-traded fund (ETF) listed on the NYSE Arca. Launched on November 4, 2010, and managed by Global X Management Company, this fund aims to provide investors with exposure to the uranium industry by tracking the Solactive Global Uranium & Nuclear Components Total Return Index. […]
-

Elliott Wave Analysis: Market Recap May 19th ES_F, Gold, BTC and More
Read MoreHello Traders! Today, we’re taking a closer look at market trends and price movements using Elliott wave view and Fibonacci. Instead of analyzing financial instruments separately, we will examine them as a whole. When one asset moves, it often signals extensions or reversals in others. As a result, tracking these connections helps us predict market […]