Hello fellow traders. In this article we’re going to take a quick look at the Elliott Wave charts of IBEX published in members area of the website. IBEX is showing impulsive bullish sequences in the cycle from the 10502.5 low. Recently we got a 3 waves pull back that has ended right at the Blue Box zone (buying area). In the further text we are going to explain the Elliott Wave Forecast and trading setup.
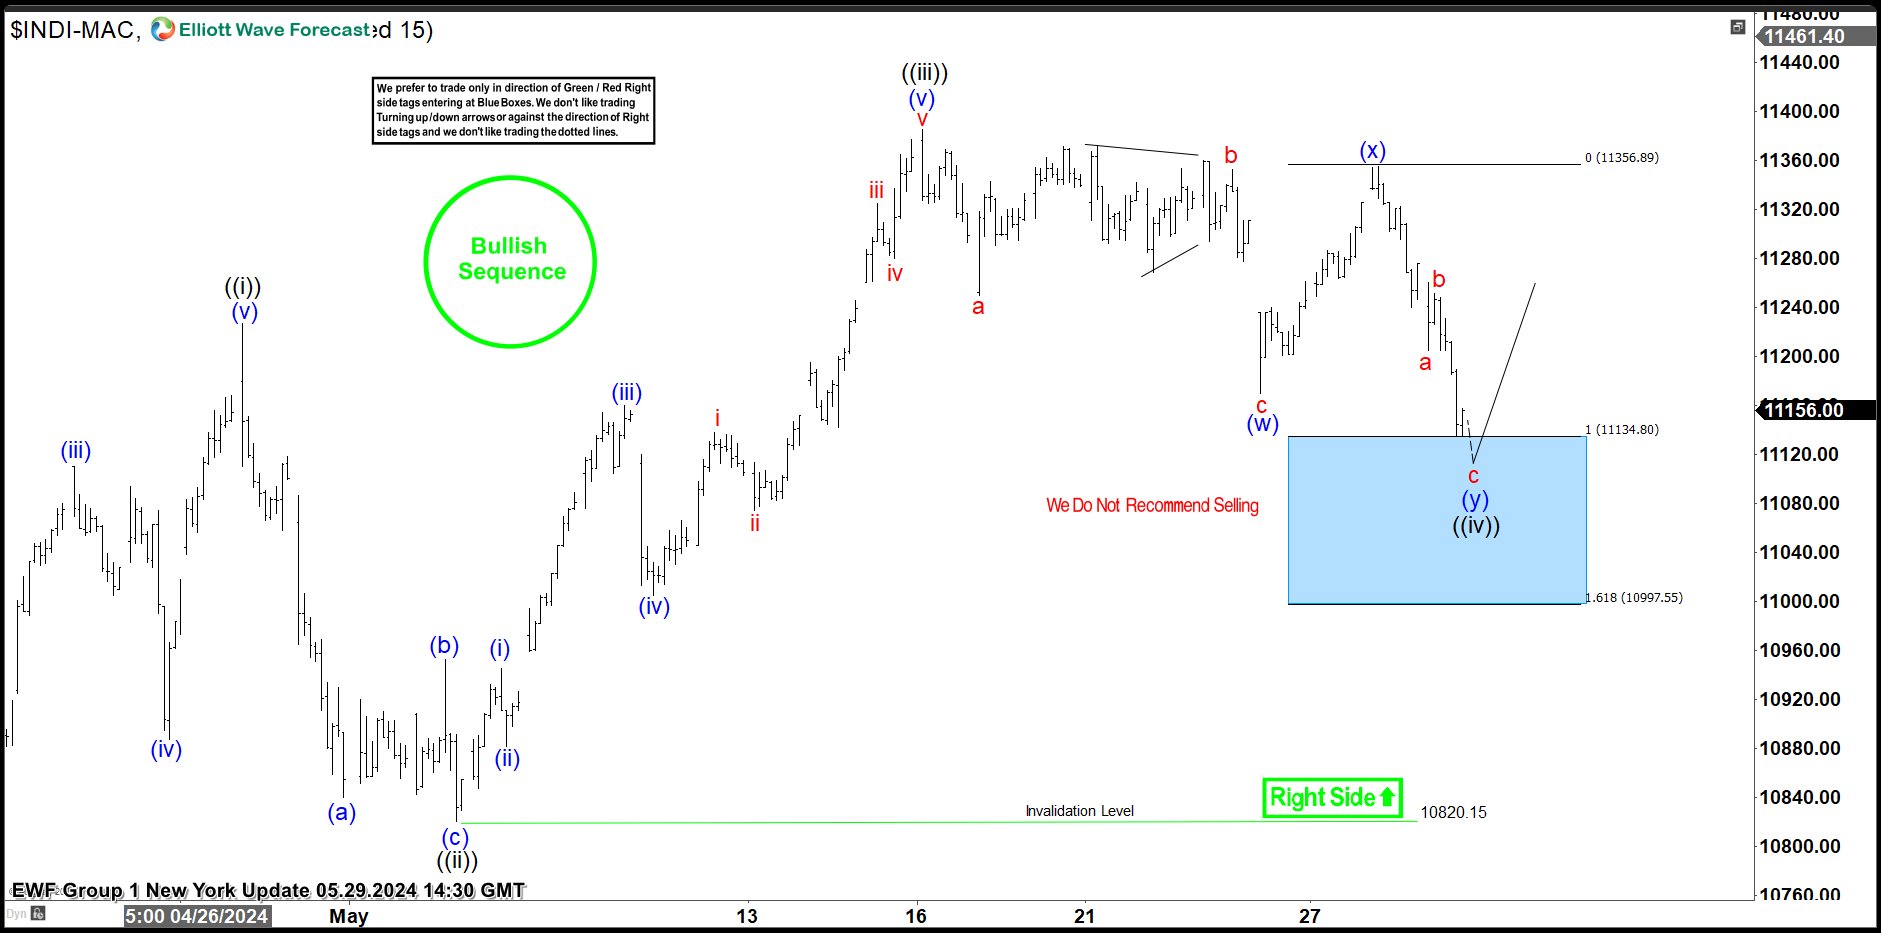
IBEX Elliott Wave 1 Hour Chart 05.29.2024
IBEX remains bullish against the 10820.15 pivot. The index is currently giving us a wave ((iv)) black pullback, appearing to unfold as a Double Three pattern. We can count 7 swings from the peak , reaching extreme area at 11134.8-10997.55 blue box ( buying zone). From that zone, IBEX should ideally make a rally toward new highs or 3 waves bounce alternatively. As our members know Blue boxes are based on 100% – 161.8% Fibonacci extension area , that we trade in 3, 7, or 11 swing corrective sequence.
Once the price touches the 50 fibs against the (x) blue connector, we’ll make positions risk-free and set the stop loss at breakeven and book partial profits. Breaking below the 1.618 Fibonacci extension level at 10997.55 would invalidate the trade.
Official trading strategy on How to trade 3, 7, or 11 swing and equal leg is explained in details in Educational Video, available for members viewing inside the membership area.
Quick reminder on how to trade our charts :
Red bearish stamp+ blue box = Selling Setup
Green bullish stamp+ blue box = Buying Setup
Charts with Black stamps are not tradable. 🚫
IBEX Elliott Wave 1 Hour Chart 05.25.2024
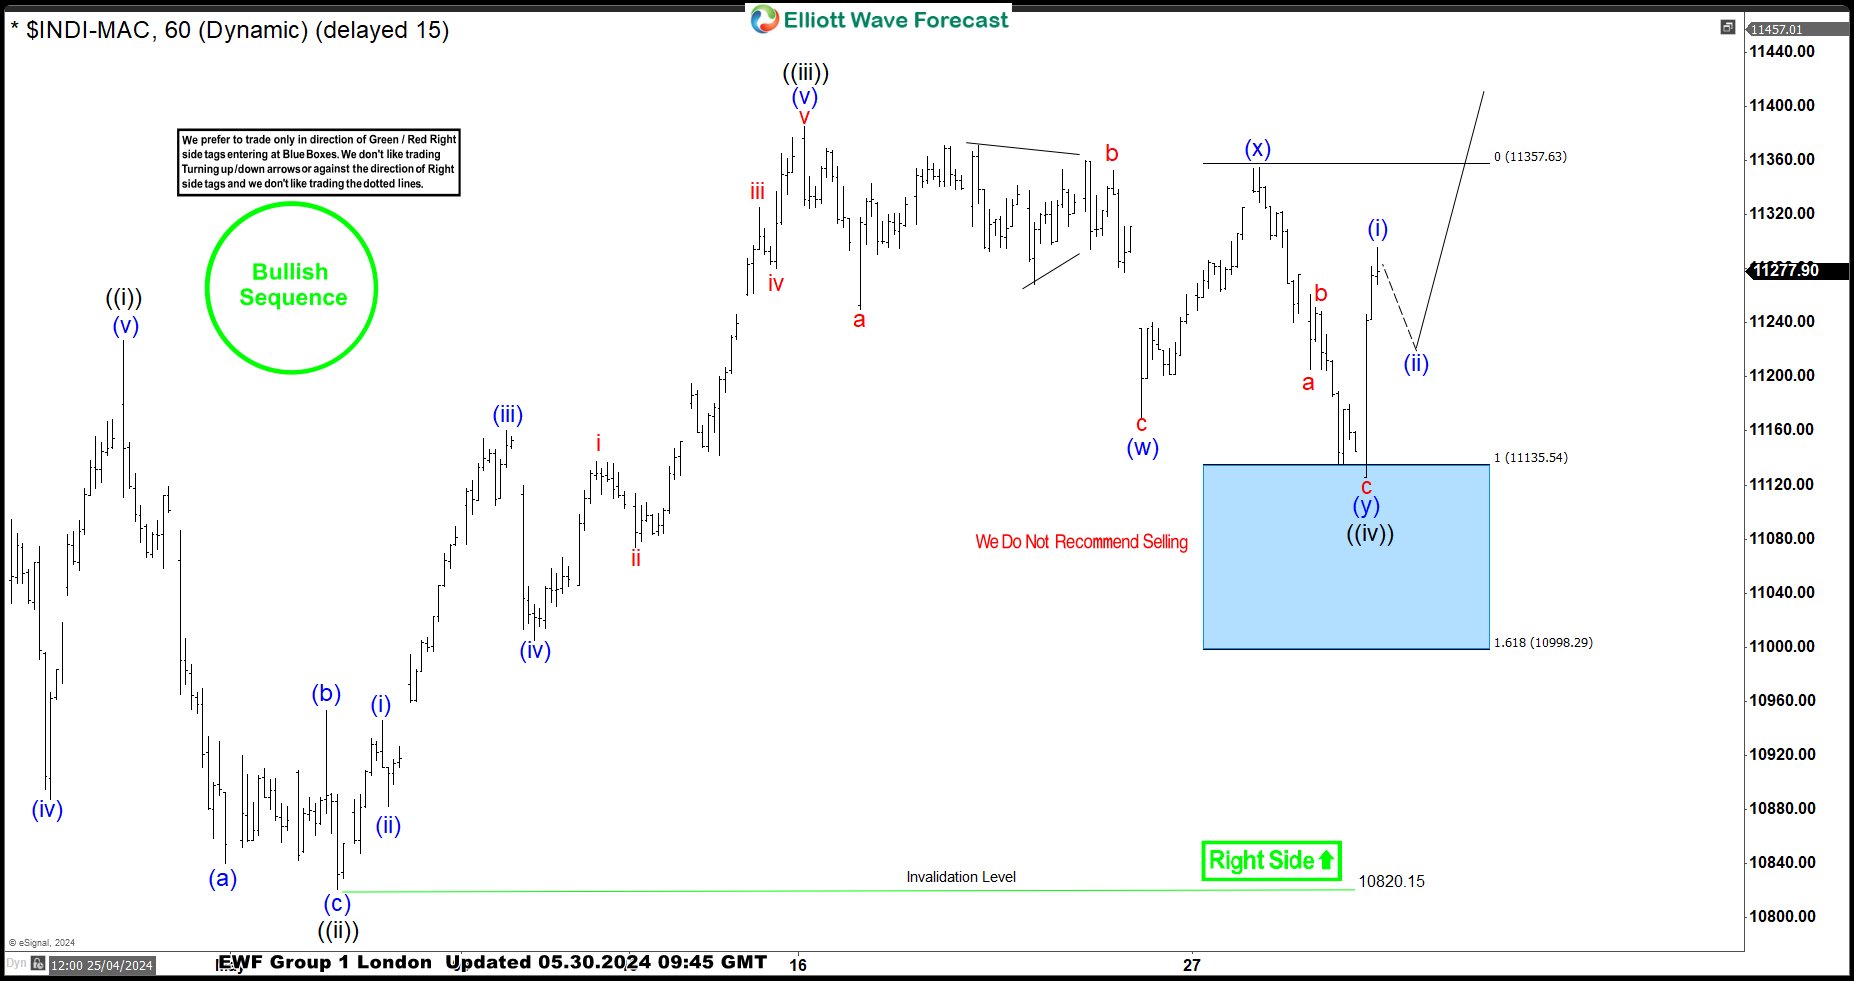
IBEX found buyers at the Blue Box area as expected, resulting in a strong reaction from our buying zone. The index has now reached and exceeded the 50 fibs against the (x) blue high. Members who took the long trade are now enjoying profits in risk-free positions. We are looking for a break of the ((iii)) black high to confirm that the next leg up is in progress.
Keep in mind that market is dynamic and presented view could have changed in the mean time. You can check most recent charts in the membership area of the site. Best instruments to trade are those having incomplete bullish or bearish swings sequences. We put them in Sequence Report and best among them are shown in the Live Trading Room