Hello fellow traders. Another instrument that we have been trading lately is $EURUSD. In this technical blog we’re going to take a quick look at the Elliott Wave charts of EURUSD and explain the trading strategy. As our members know, EURUSD has been showing incomplete bearish sequences. Recently he pair has made 3 waves bounce that has given us good selling opportunities. We recommended members to avoid buying the pair, while favoring the short side. In the further text we are going to explain the Elliott Wave Forecast and the trading strategy.
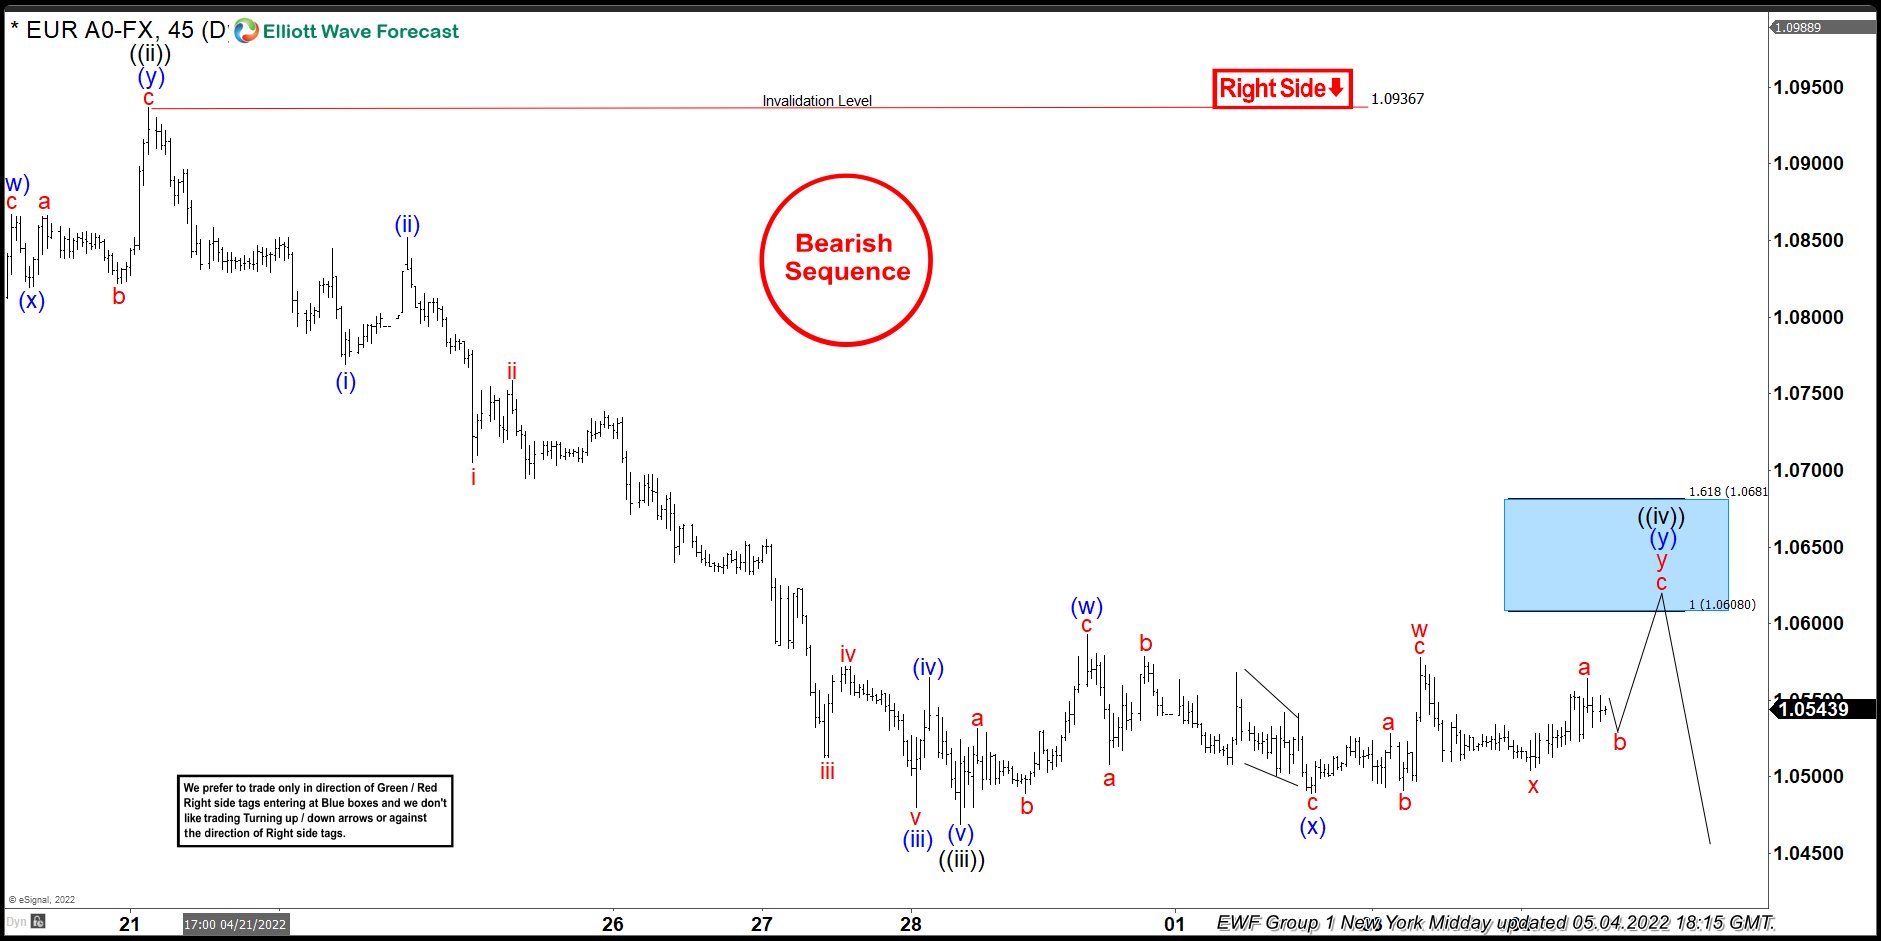
EURUSD H1 Elliott Wave Analysis 05.11.2022
EURUSD is doing recovery against the 1.09367 peak which is unfolding as Elliott Wave Double Three Pattern. Recovery looks incomplete at the moment, looking for another push up toward 1.06080-1.0681 ( selling zone). We recommended members to avoid buying the pair in proposed push higher. Strategy is waiting for the price to make clear 7 swings and reach marked blue box zone before selling the pair. Invalidation for the trade would be break above 1.618 fibs extension: 1.0681. As the main trend is bearish we expect sellers to appear at the blue box for 3 waves pull back at least. Once pull back reaches 50 Fibs against the (x) blue low, we will make short position risk free ( put SL at BE) and take partial profits.
Reminder: You can learn about Elliott Wave Rules and Patterns at our Free Elliott Wave Educational Web Page.
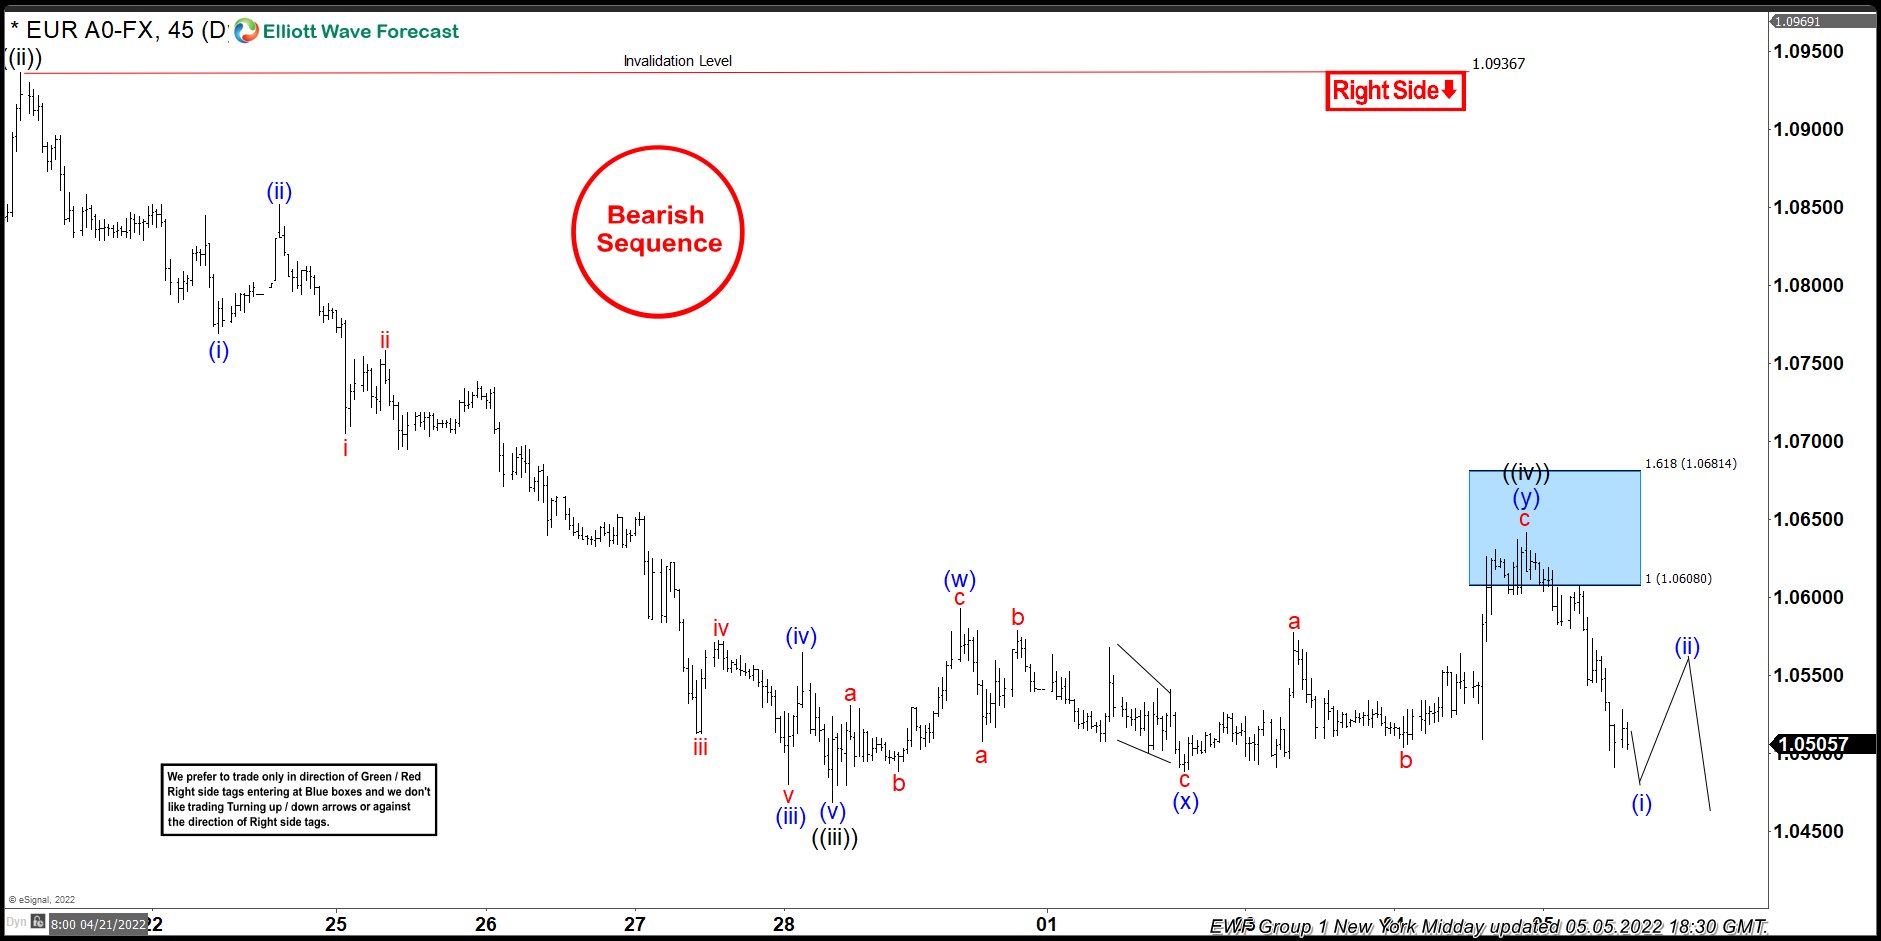
EURUSD H1 Elliott Wave Analysis 05.05.2022
The pair found sellers right at the blue box area: 1.06080-1.0681 and made decent reaction already. As a result , members who took short trades made positions risk free ( Put SL at BE) and took partial profits. At this stage we see wave ((iv)) completed at 1.06422 high. Decline from that peak shows impulsive sequences which increase chances of further extension down. Now we would like to see break of previous low : 04/28 in order to confirm next leg down is in progress.
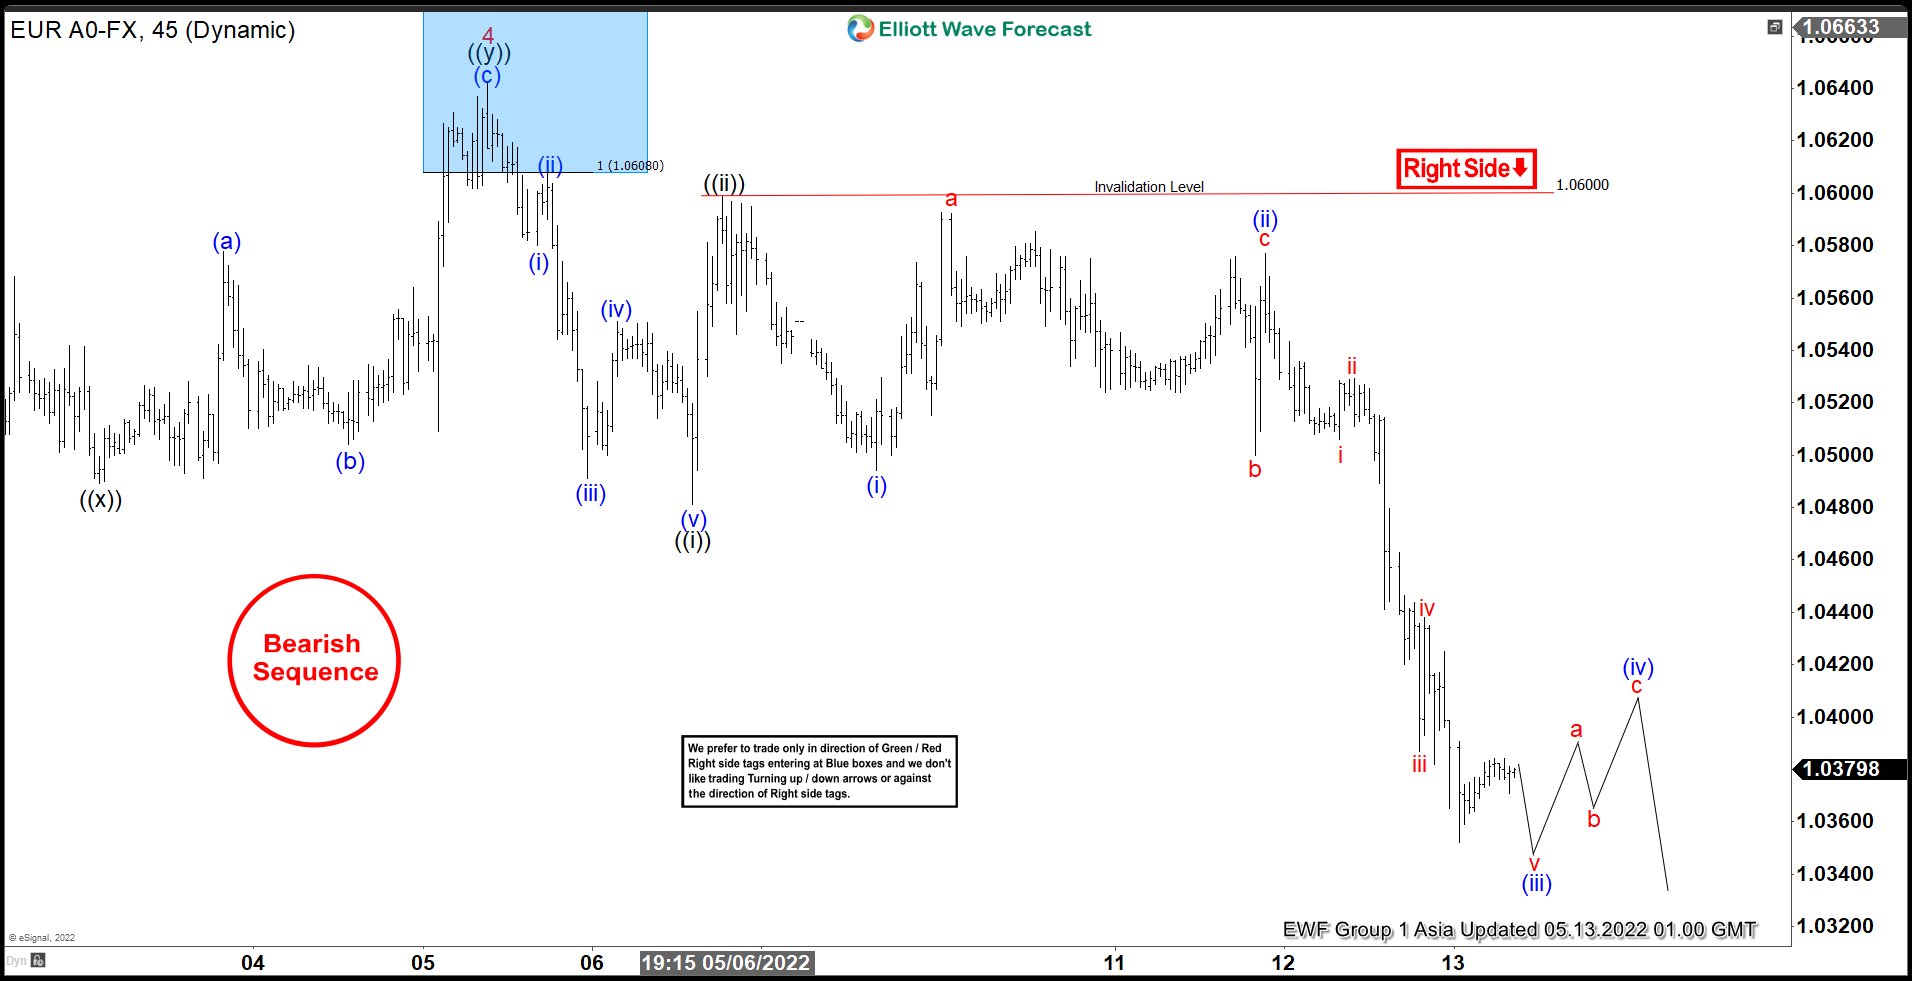
EURUSD H1 Elliott Wave Analysis 05.13.2022
Eventually the pair made break of 04/28 low confirming further extension down. We got 3 waves bounce that held below 1.06422 high and further decline as expected. As far as short term 1.0600 pivot holds, the pair can see more weakness in near term.
Keep in mind market is dynamic and presented view could have changed in the mean time. You can check most recent charts in the membership area of the site. Best instruments to trade are those having incomplete bullish or bearish swings sequences.We put them in Sequence Report and best among them are shown in the Live Trading Room.
Elliott Wave Forecast
We cover 78 instruments in total, but not every chart is trading recommendation. We present Official Trading Recommendations in Live Trading Room. If not a member yet, you are welcome to Sign Up for 14 days Trial and get access to new trading opportunities. Through time we have developed a very respectable trading strategy which defines Entry, Stop Loss and Take Profit levels with high accuracy.
Welcome to Elliott Wave Forecast !