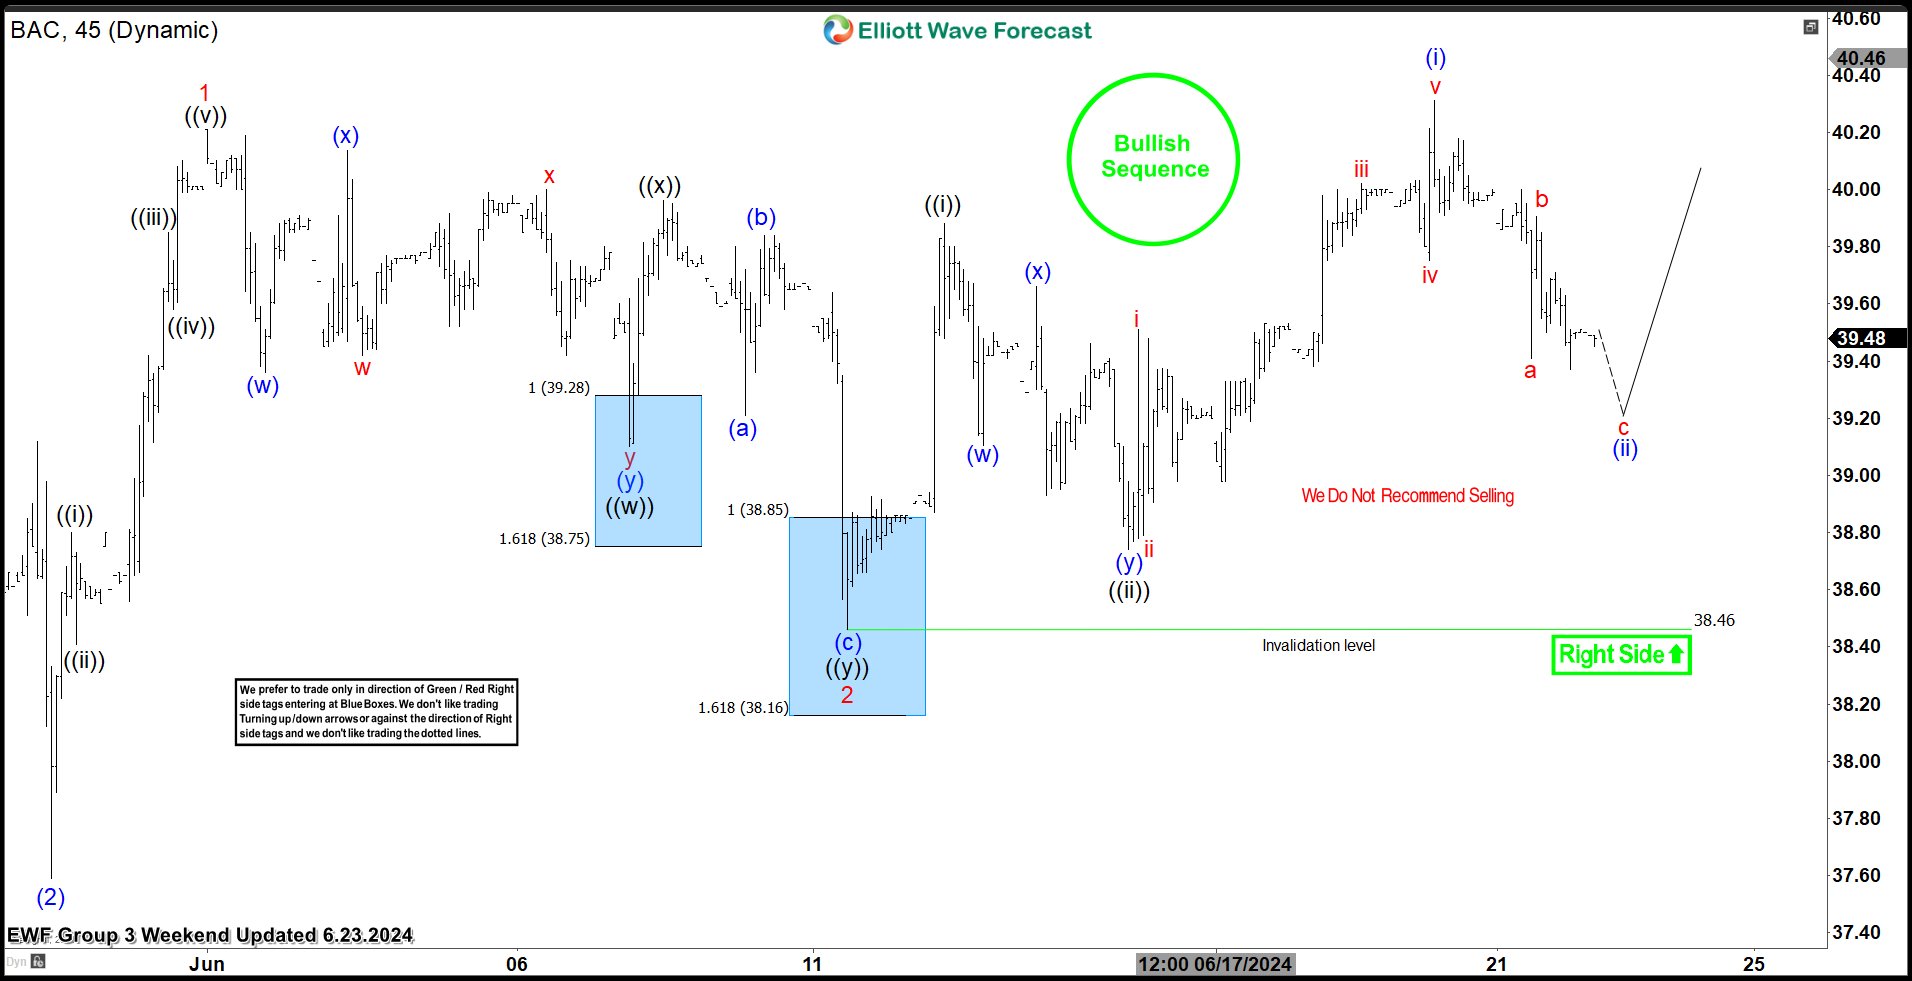
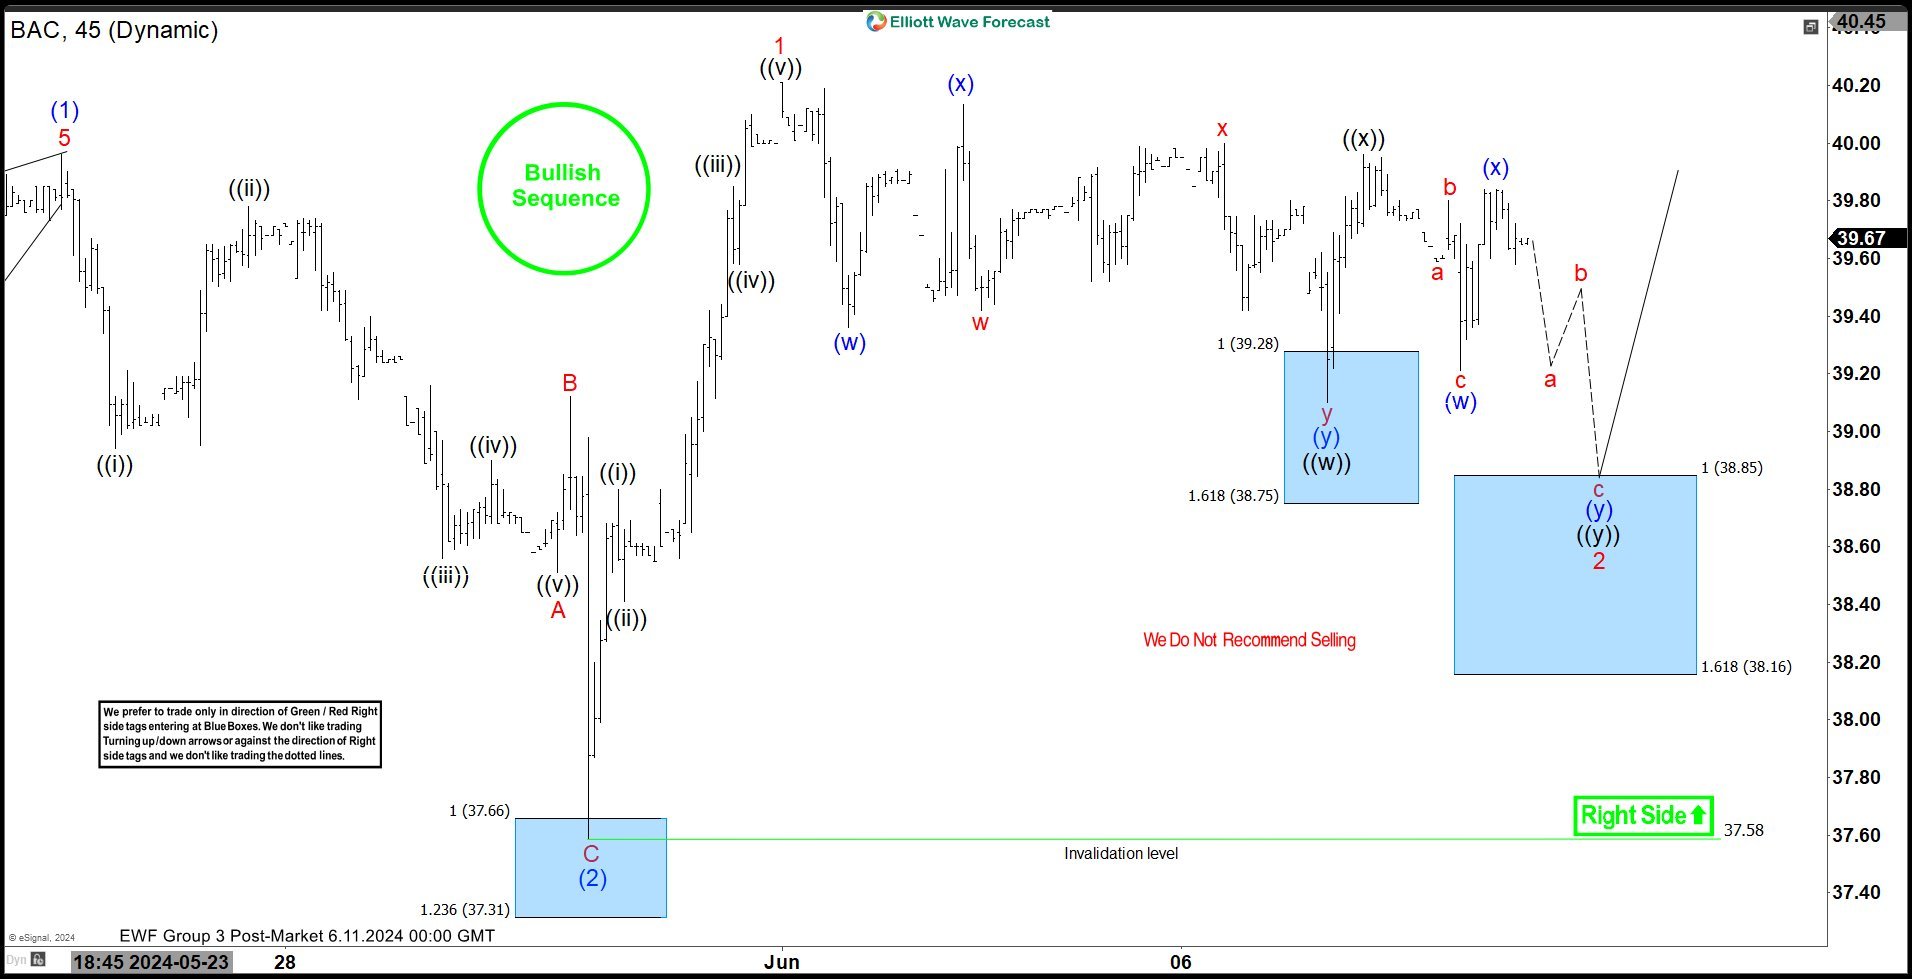
Hello fellow traders. In this technical article we’re going to take a look at the Elliott Wave charts charts of Bank of America Corp (BAC) Stock published in members area of the website. Our members are aware of the numerous positive trading setups we’ve had among Stocks and Indices recently. One of them is BAC , which made a pullback, that unfolded as an Elliott Wave Double Three Pattern. It completed clear 7 swings from the peak on June 3rd peak and concluded the correction right at the Equal Legs zone (Blue Box Area). In the following text, we’ll delve into the Elliott Wave pattern and trading setup.
BAC H1 update 06.11.2024
Official trading strategy on How to trade 3, 7, or 11 swing and equal leg is explained in details in Educational Video, available for members viewing inside the membership area.
Quick reminder on how to trade our charts :
Red bearish stamp+ blue box = Selling Setup
Green bullish stamp+ blue box = Buying Setup
Charts with Black stamps are not tradable. 🚫
BAC H1 update 06.11.2024
The stock found buyers as expected and made a good rally from the Blue Box, breaking toward new highs as expected. Consequently, any long positions taken from the equal legs area are now risk-free, and we have already taken partial profits. We consider wave 2 red completed at the 38.46 low. The stock now remains bullish against the 38.46 pivot. As long as that pivot holds in our system, we believe the stock should continue finding buyers in 3, 7, 11 swings, for a further extension toward new highs or alternatively in a 3-wave bounce.
Keep in mind not every chart is trading recommendation. You can check most recent charts and new trading setups in the membership area of the site. Best instruments to trade are those having incomplete bullish or bearish swings sequences. We put them in Sequence Report and best among them are shown in the Live Trading Room.