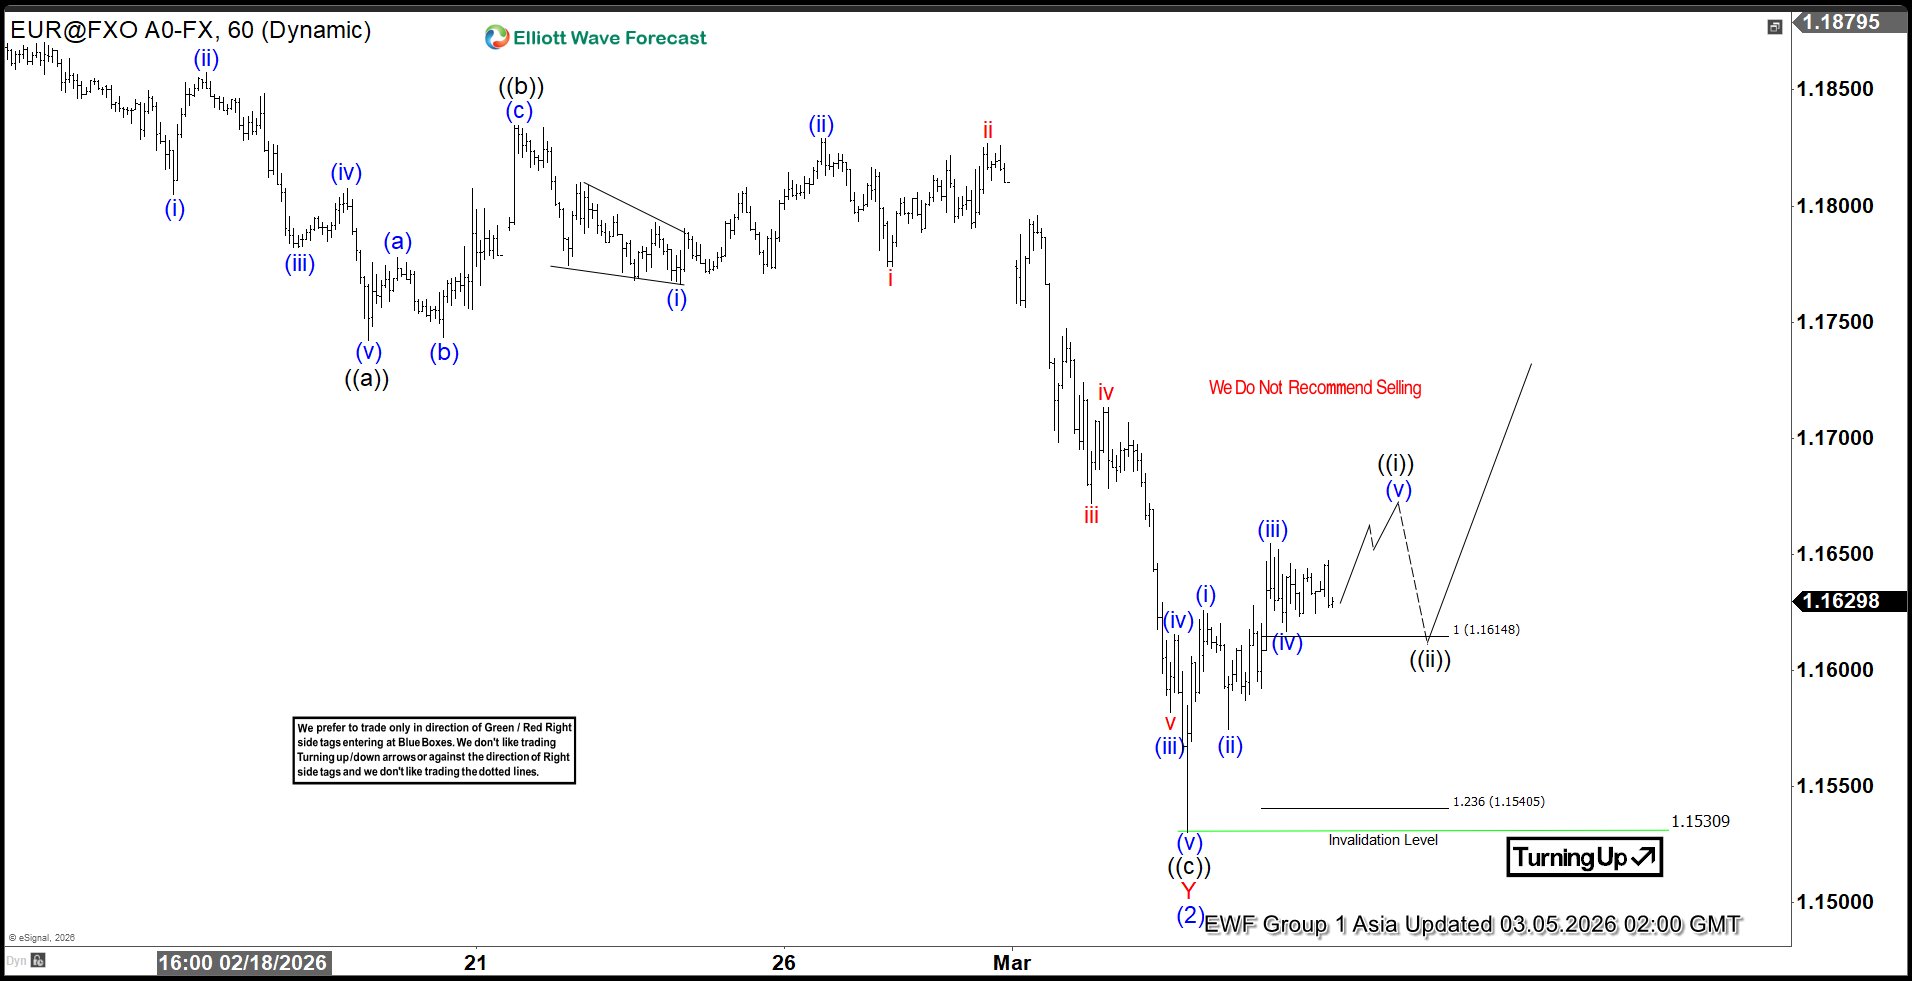
The short-term Elliott Wave outlook for EURUSD indicates that the rally to 1.2083 on January 27 marked the completion of wave (1). Following this peak, the pair entered a corrective phase in wave (2), which unfolded as a double three structure. From the high of wave (1), wave W concluded at 1.1776, while wave X ended at 1.1928. Subsequently, wave Y developed into a zigzag formation. Within this sequence, wave ((a)) finished at 1.1742, and wave ((b)) reached 1.1834, as illustrated clearly in the one-hour chart.
Wave ((c)) then extended lower, reaching the critical inflection zone between 1.142 and 1.161. This area corresponds to the 100%–161.8% Fibonacci extension of wave ((a)), a level often watched closely by traders for potential reversals. The pair has already begun to turn higher after completing the pullback at 1.153, where we identified the termination of wave ((c)) of Y of (2).
For confirmation of a sustained bullish trend, EURUSD must break above the prior wave (1) peak at 1.2083. Such a move would eliminate the risk of a double correction and reinforce the upward bias. In the near term, as long as the pivot at 1.153 remains intact, expectations favor further extension to the upside. This scenario highlights the importance of the recent inflection area as a foundation for renewed strength in the pair.