
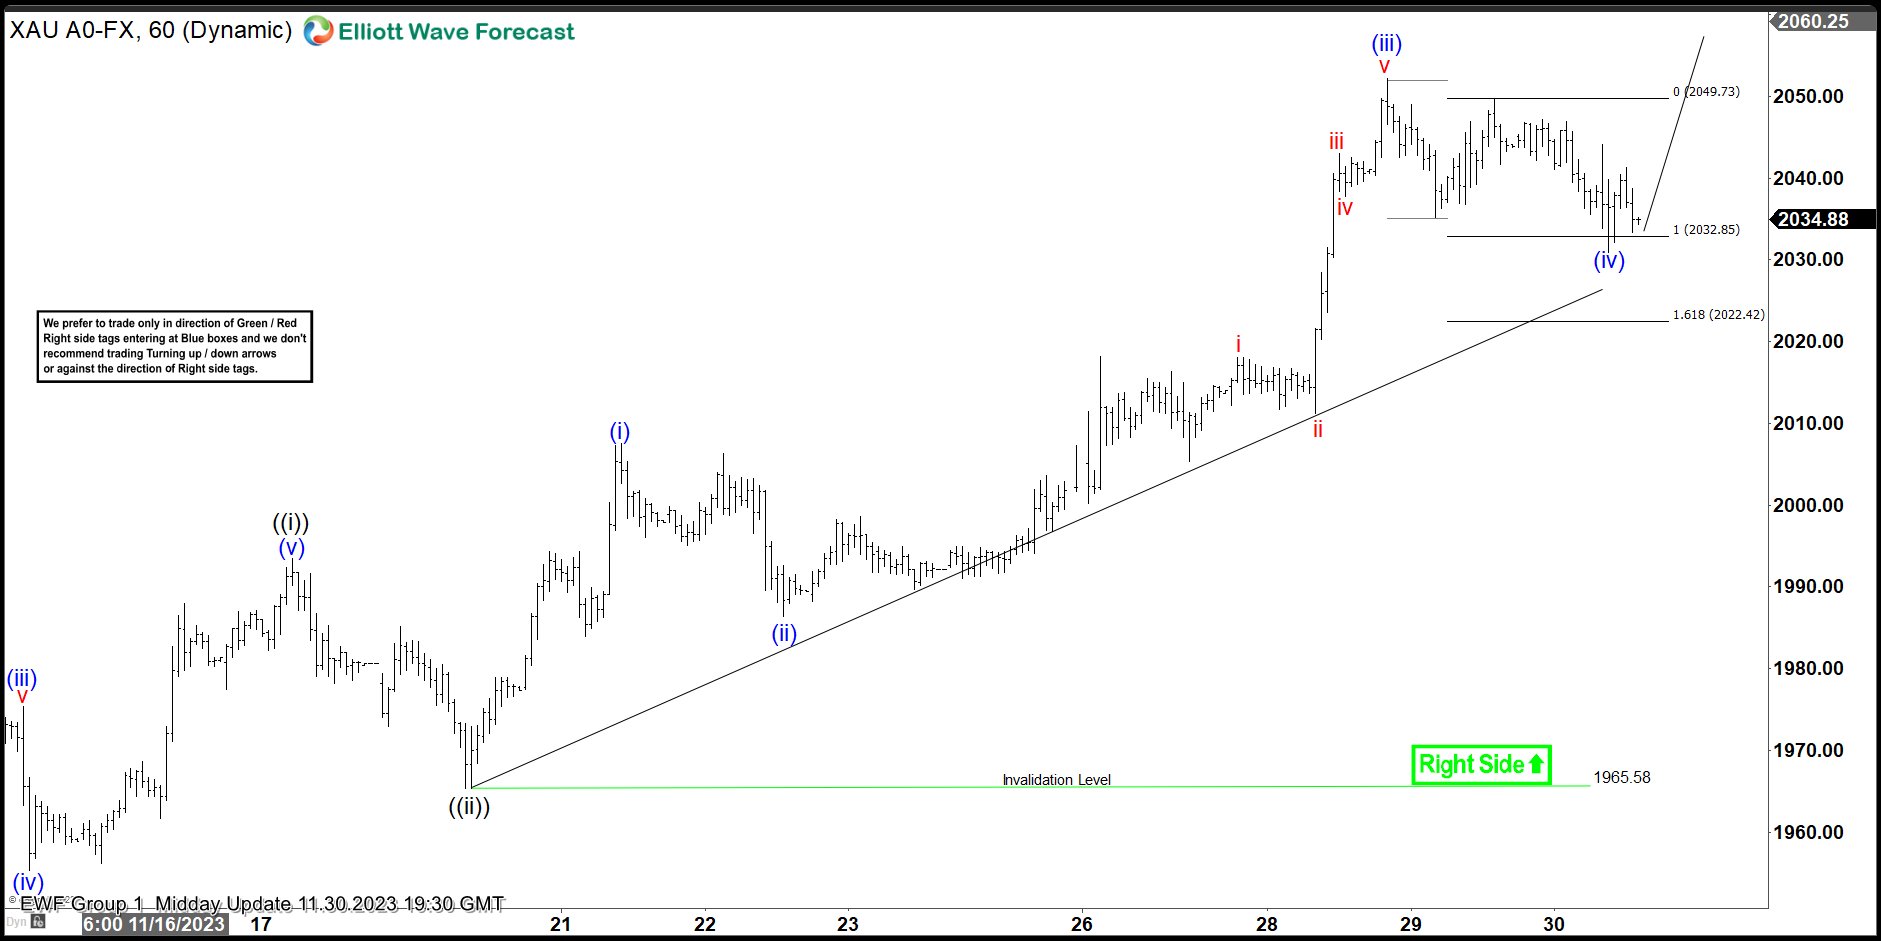
Last year, our live trading room provides 69% return annually across the 3 groups that we cover. In Live Trading Room, we scan the market everyday to find any tradable setup. We believe every serious traders need to have a good trading system with specific rules. A complete system must include the following: 1. Conditions […]
-
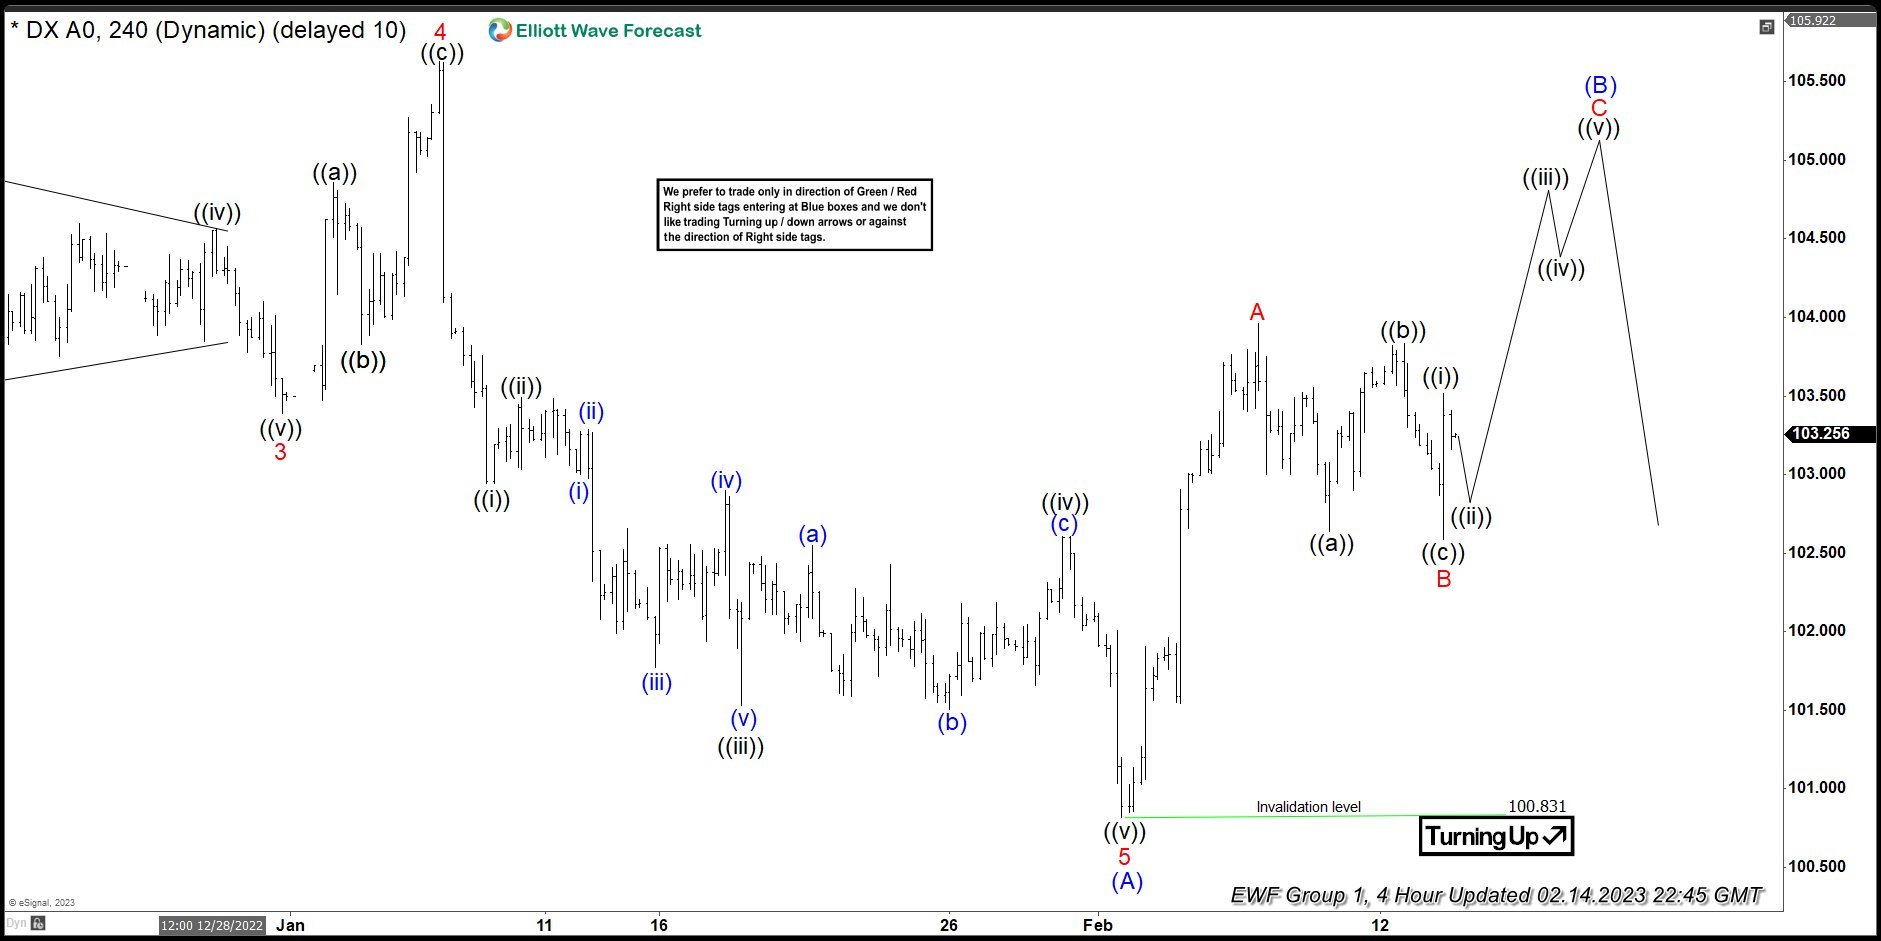
Dollar Index ( DXY ) Forming Elliott Wave Zig Zag Pattern
Read MoreHello fellow traders. In this technical blog we’re going to take a quick look at the Elliott Wave charts of Dollar Index ( $DXY ). As our members know, Dollar is correcting the cycle from the 114.67 peak. Recovery is unfolding as Wave Zig Zag Pattern. In the further text we are going to explain […]
-
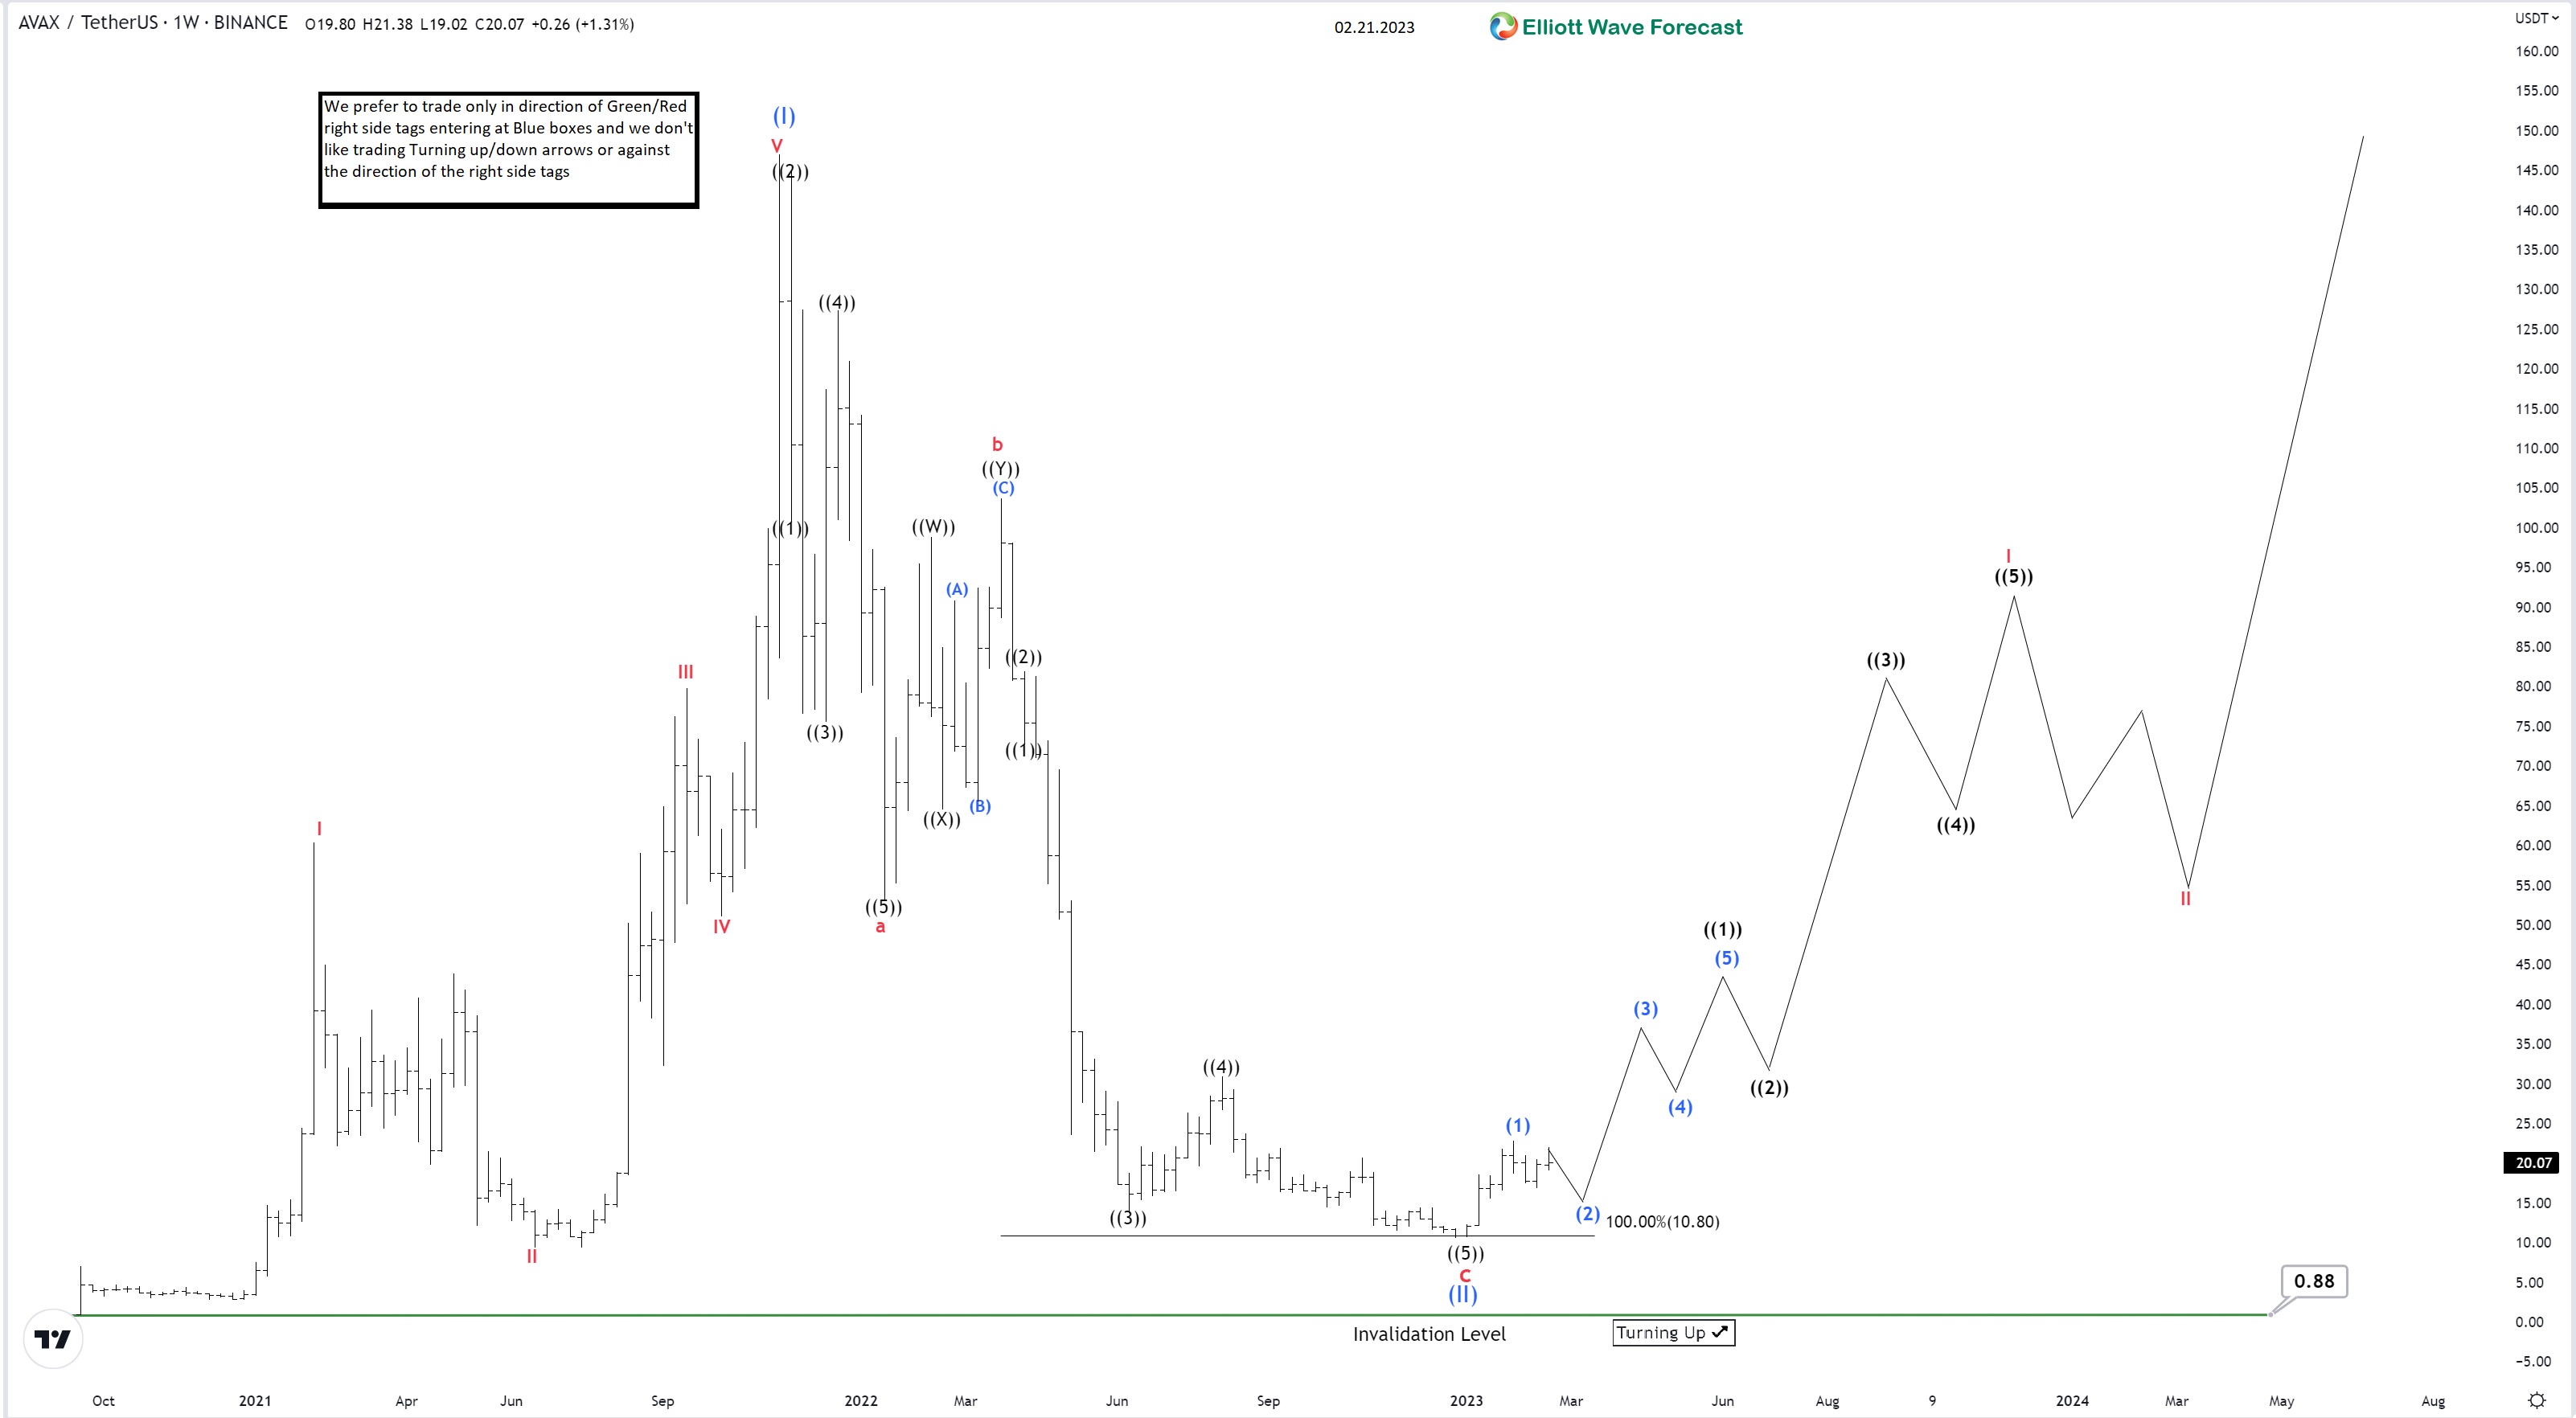
AVALANCHE: Wave (II) Reaching Equal Legs May Provide The Next Leg Higher
Read MoreHello Traders in this blog we will be going through Avalanche which is a crypto related instrument. Since it’s first peak from November 2021 to end a larger degree cycle in (I) it was been correcting lower. It appeared to to have reached equal legs area recently. Already it has been reacting higher from the […]
-
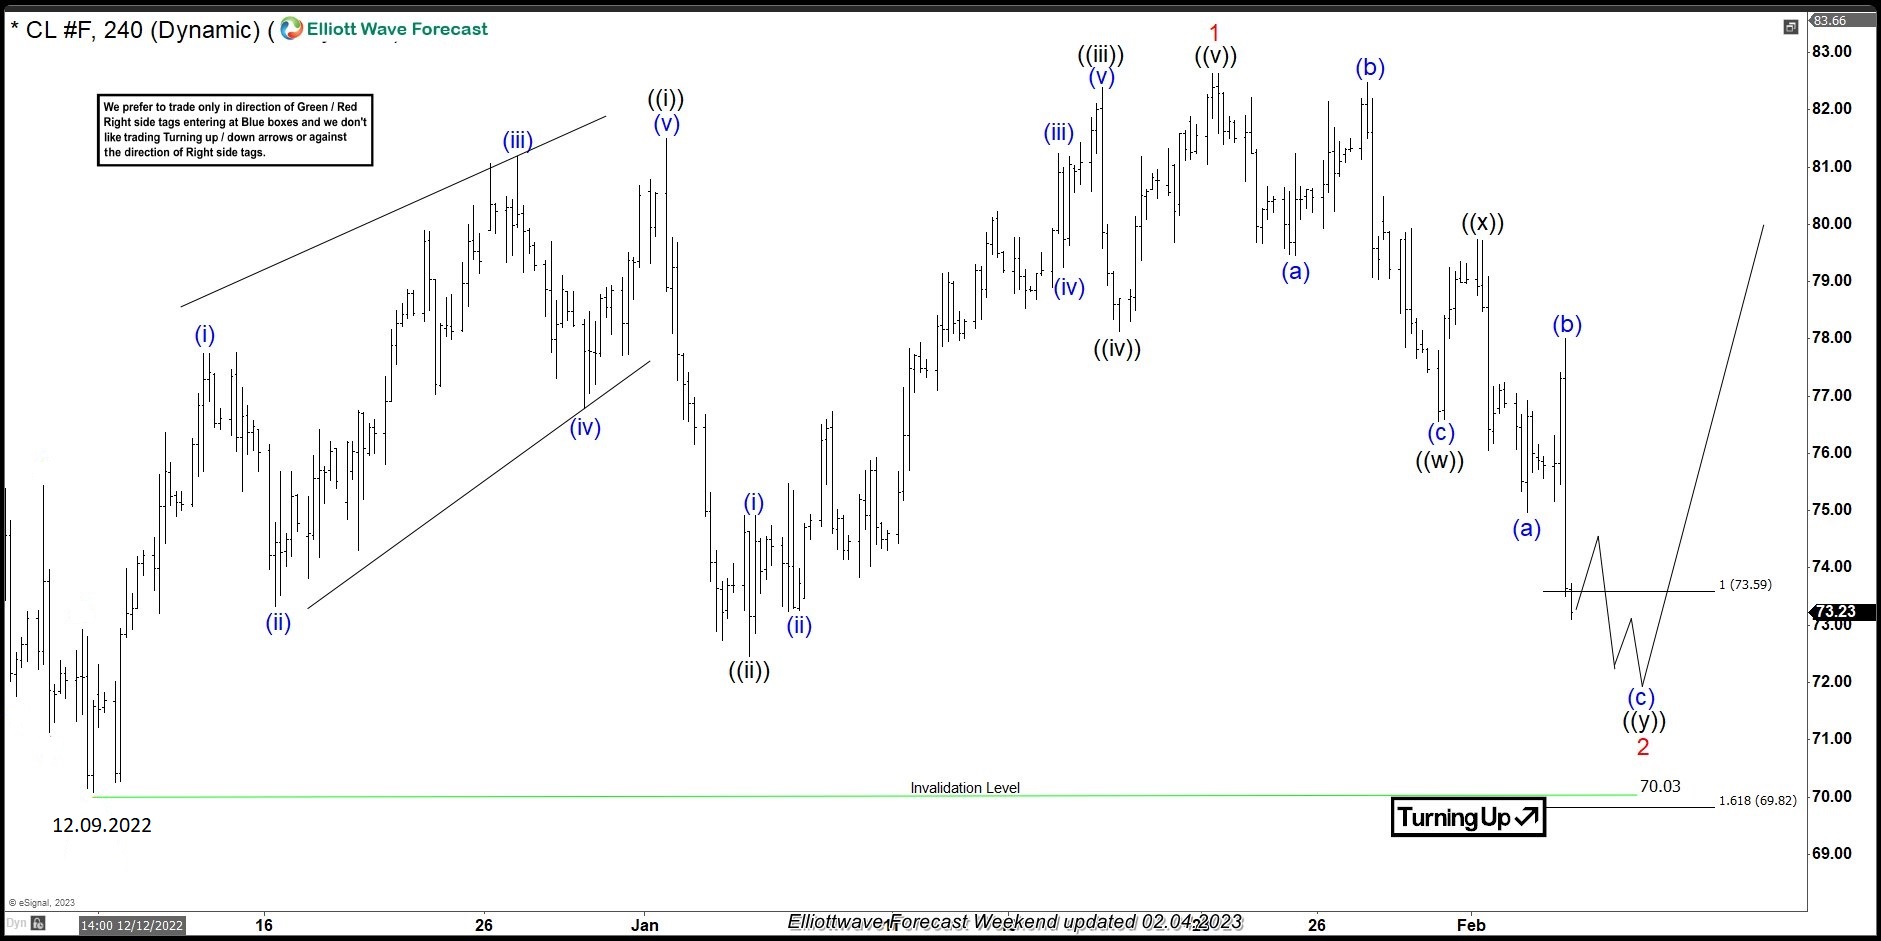
CL_F: Crude Oil Futures Found Support From Equal Legs Area
Read MoreHello Traders in this blog we will see how CL_F Crude Oil Futures found support from equal legs area and reacted higher within wave 2. Many traders are wondering whether Crude Oil will still trade lower or higher after it’s larger degree peak it made from March 7th, 2022. In this article we will only […]
-
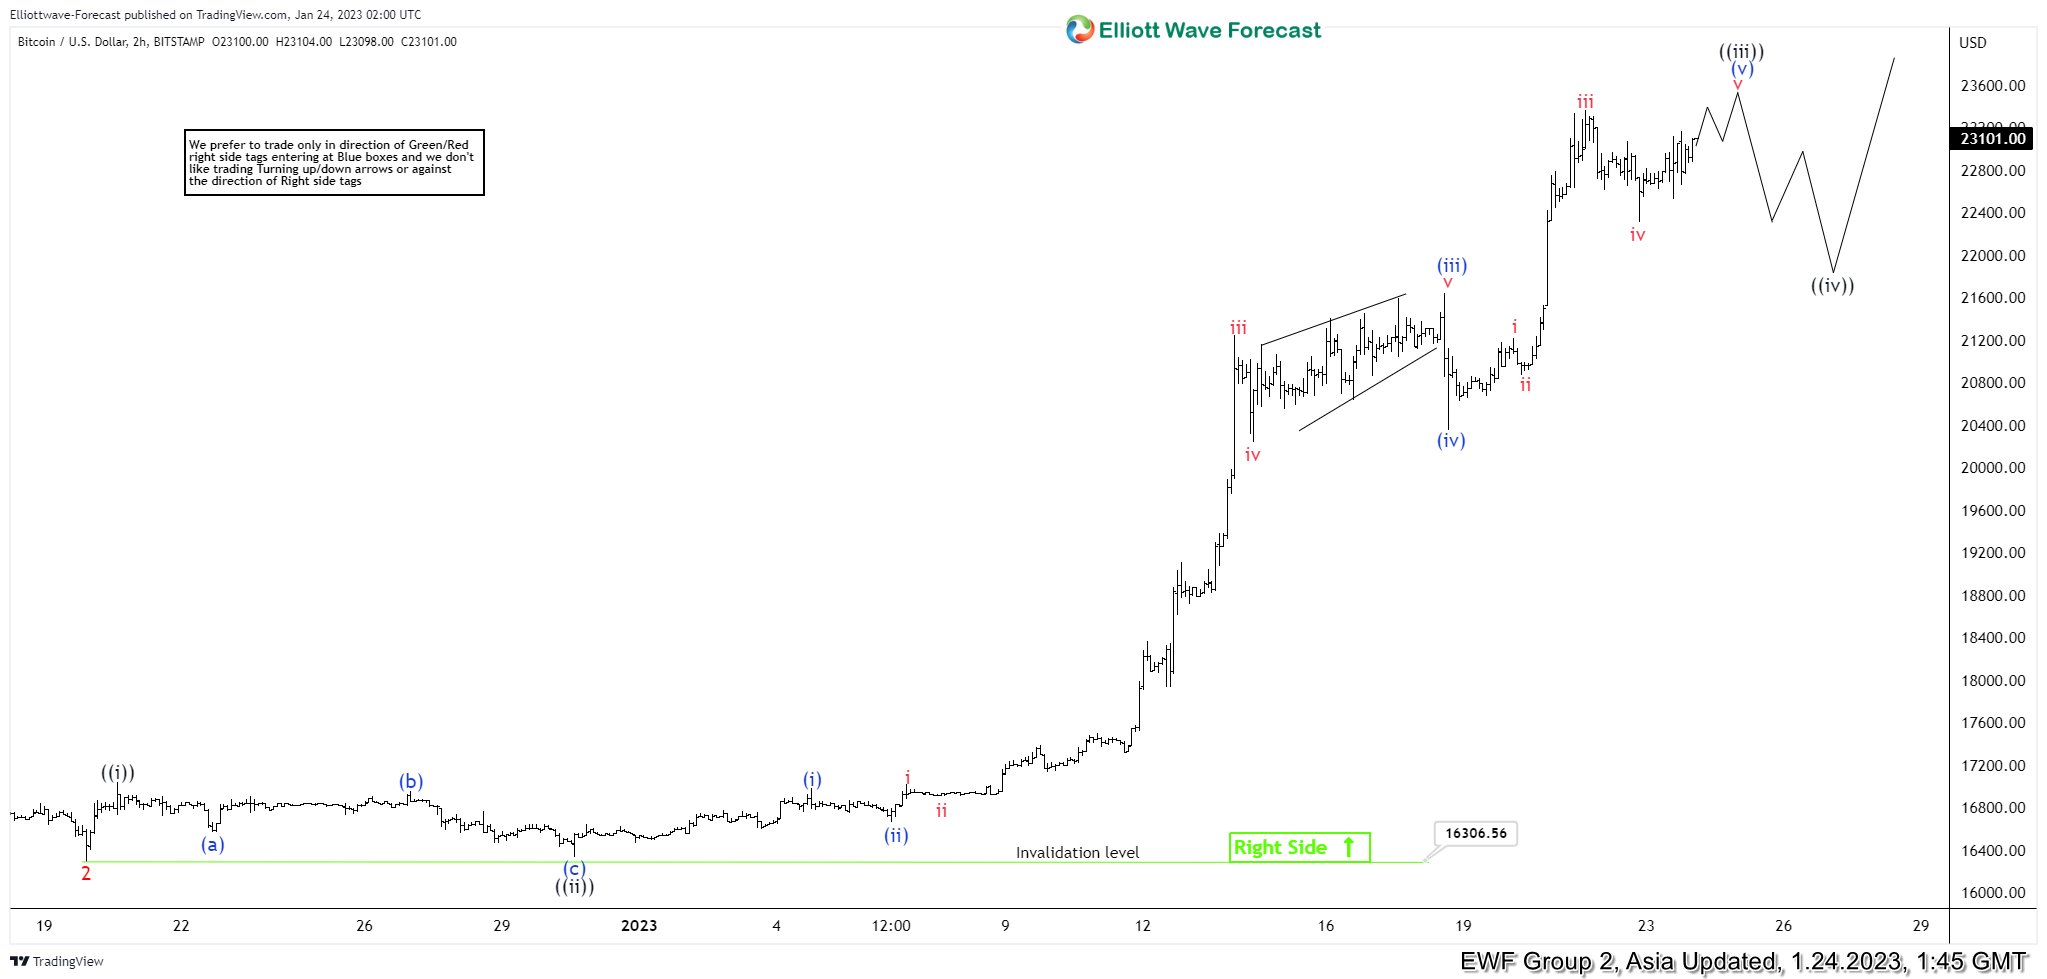
BTC/USD: Forecasting Elliott Wave ((iv)) Correction In Bitcoin
Read MoreHello Traders, in this article we will have a look on BTC/USD. You will see how we were able to forecast in advance the upcoming wave ((iv)) correction. Bitcoin is trading within a larger degree cycle that started from 11.21.2022. Current cycle appears to be within extended wave 3. Inside our members area we cover […]
-
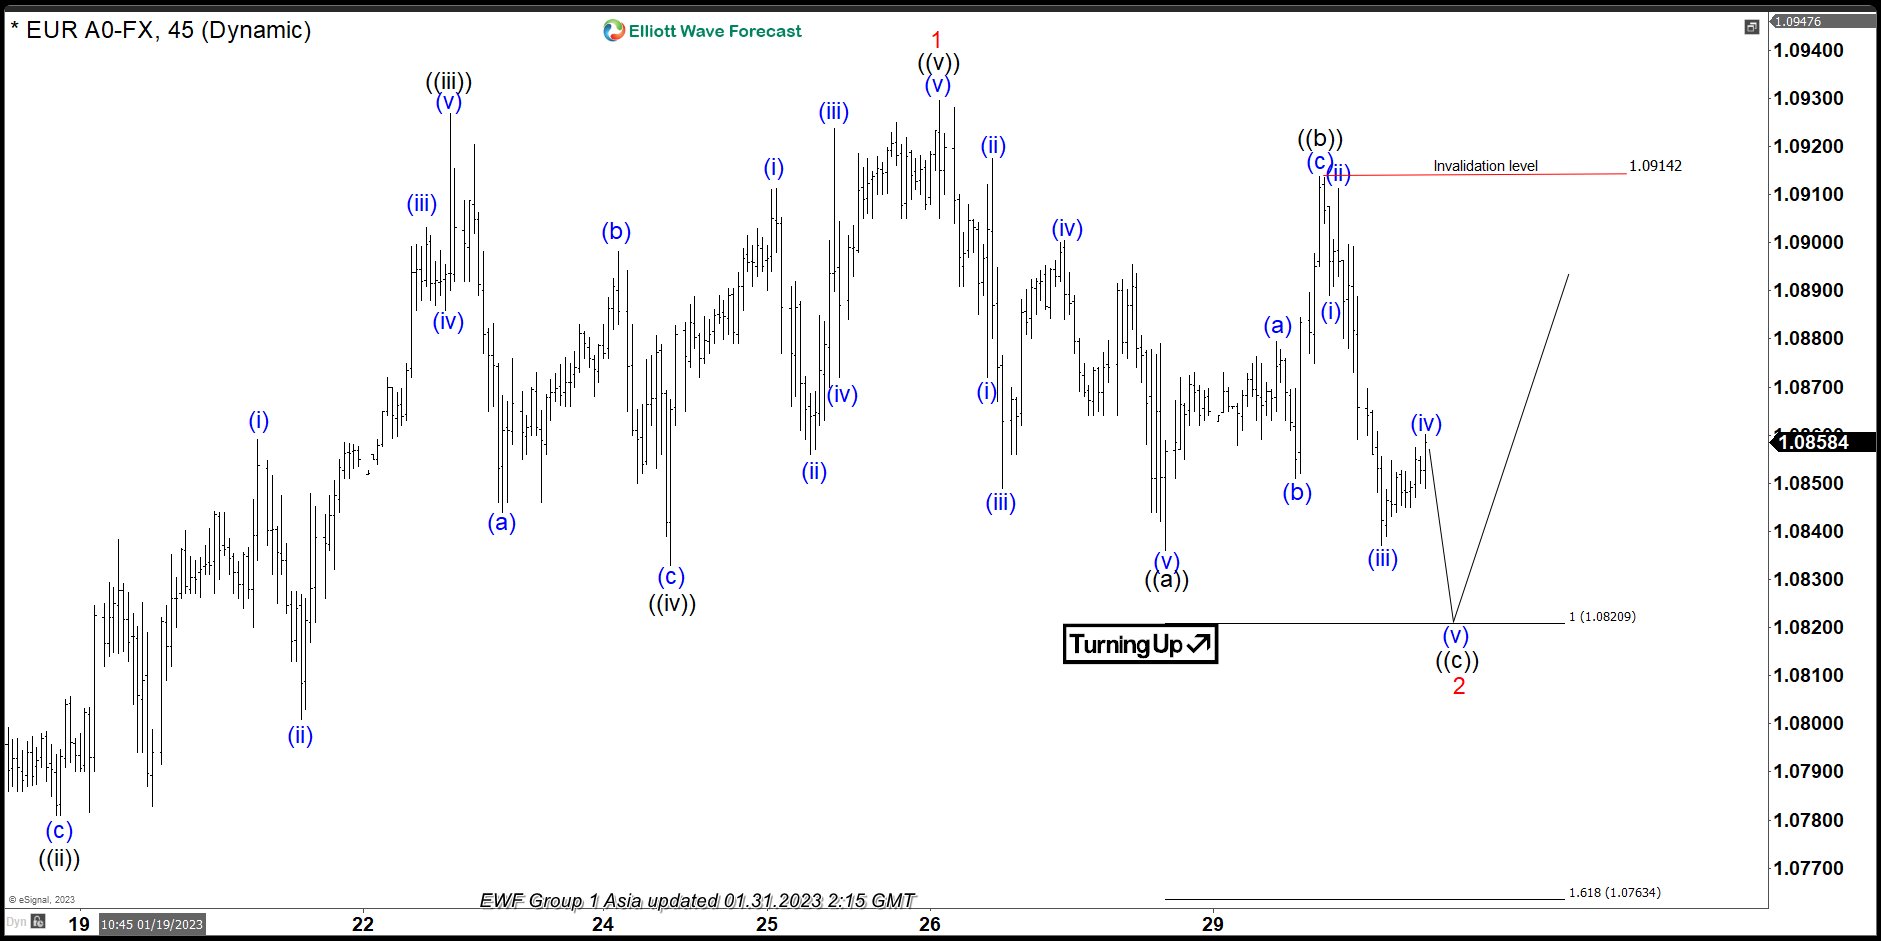
EURUSD Forecasting The Rally After Elliott Wave Zig Zag Pattern
Read MoreHello fellow traders. In this technical blog we’re going to take a quick look at the Elliott Wave charts of EURUSD, published in members area of the website. As our members know, recently EURUSD made a pull back that has had a form of Elliott Wave Zig Zag pattern. We expected the pair to find […]
-
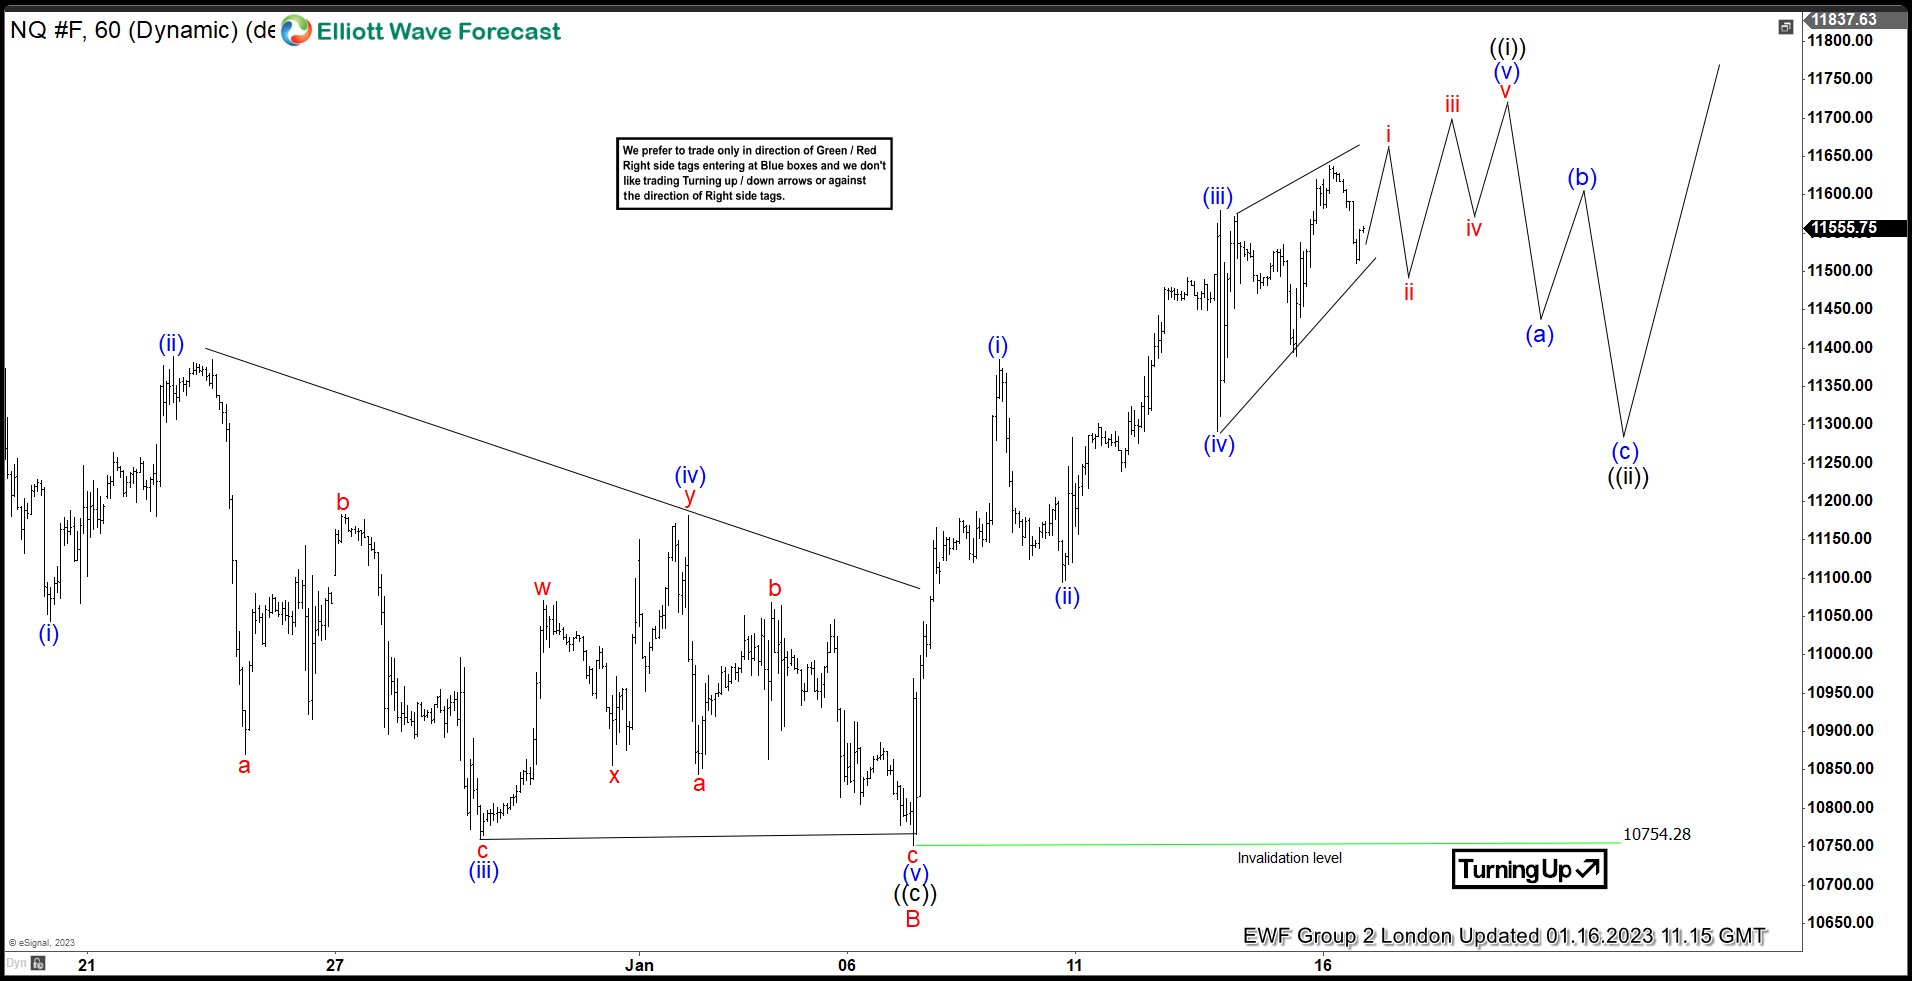
NQ_F: Forecasting Elliott Wave ((iii)) Higher In NASDAQ Futures
Read MoreHello Traders, in this blog we will see how we were able to forecast in advance the wave ((iii)) higher in NQ_F. Nasdaq has been one of the weakest Indices within 2022 and has been seeing a relief bounce rally as of recent. We will see below how here at Elliott Wave Forecast were able […]