

As mentioned in a previous technical article, every trader—besides having the ability to accurately forecast the market—must also possess strong discipline and sound money management in order to be successful. One of the most important aspects of trading is knowing how to manage risk effectively and keep it as low as possible. As the rule goes, you shouldn’t risk more than 2% of your trading account on any single trade. If you think the 2% rule is overrated or believe that following it consistently is unnecessary, keep reading this blog to discover how poor money management can affect your trading account.
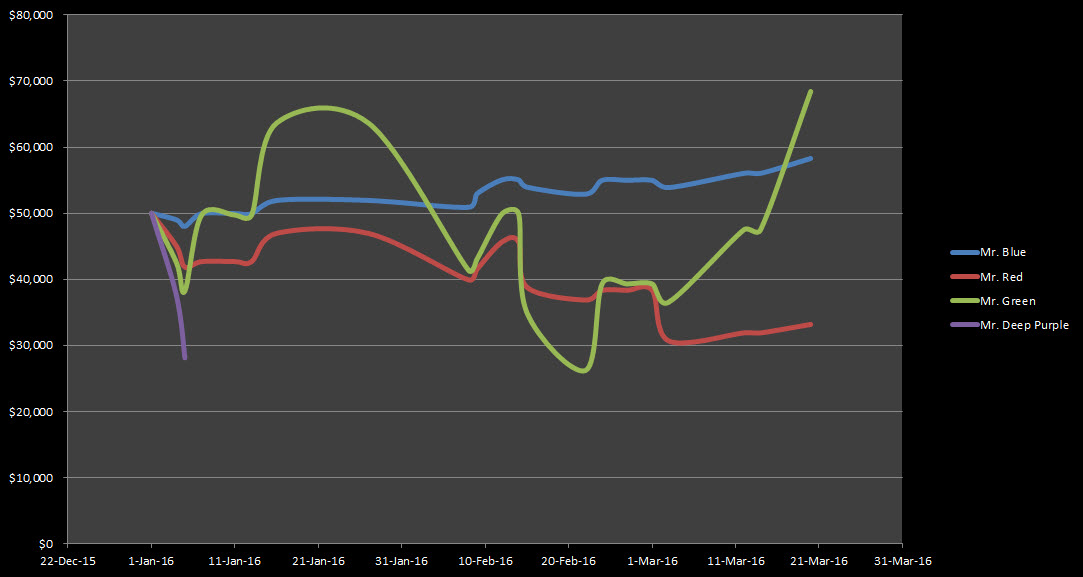
Take a close look at the chart below. It shows the performance of four traders who took exactly the same trade setups but used different risk levels. All of them started with the same initial capital of $50,000, entered at the same prices, used the same stop-loss levels, targeted the same profit areas, and traded with the same risk-to-reward ratio (1:2). The performance review covers a three-month period, from January 4 to March 20, 2016, with the exception of the Purple trader, who stopped trading after just two days, discouraged by a significant drawdown.
Before we continue, here’s a short reminder: check out New Elliott Wave Forecast blog.
Now, let’s take a closer look at each of these traders individually. For simplicity, we’ll refer to them as Mr. Blue, Mr. Red, Mr. Green, and Mr. Deep Purple.
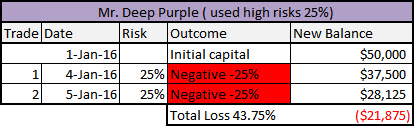
We’ll begin with Mr. Deep Purple, who made only two trades, both of which ended in losses. His total loss reached $21,875—a result that could have been avoided had he not risked an excessive 25% of his account on each trade.
After suffering a 43.75% drawdown in just two trading days, he became discouraged and decided to quit trading altogether. Below is a summary of his trading performance.
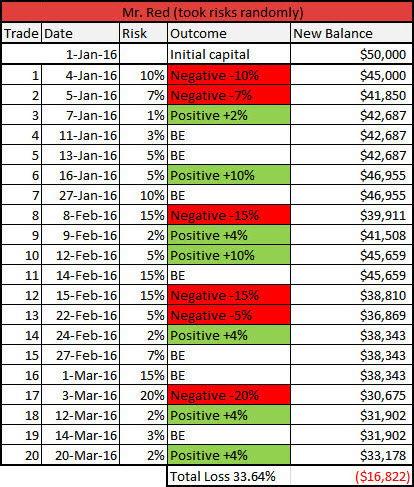
The next trader is Mr. Red. He took positions somewhat randomly, driven by emotions such as greed and fear. Initially overconfident, he started with a 10% risk on his first trade. After that trade resulted in a loss, he reduced his risk to 7% on the next one.
His third trade was profitable, but since he risked only 1%, he generated just a 2% return, consistent with a 1:2 risk-to-reward ratio. Encouraged by this small gain, he gradually began increasing his position sizes again, until he eventually suffered another loss on February 8th.
As shown in the table below, Mr. Red increased his risk after a series of winning trades and reduced it after losing periods—essentially trading in a reactive, inconsistent manner. Ultimately, he lost 33.64% of his initial capital, equivalent to $16,822.
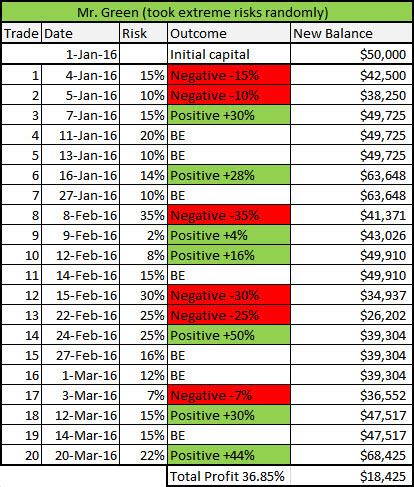
Mr. Green was essentially a gambler. He managed to “survive” and even generate a profit of 36.85%, despite taking completely inconsistent and random risk levels. His approach was an “all or nothing” strategy, which allowed him to recover from a deep drawdown and finish in profit.
However, it is important to understand that this type of trading behavior is fundamentally flawed and typically leads to a complete loss of capital over time. In this case, Mr. Green ended with a profit of $18,425, representing a 36.85% gain.
Further details can be found in the table below.
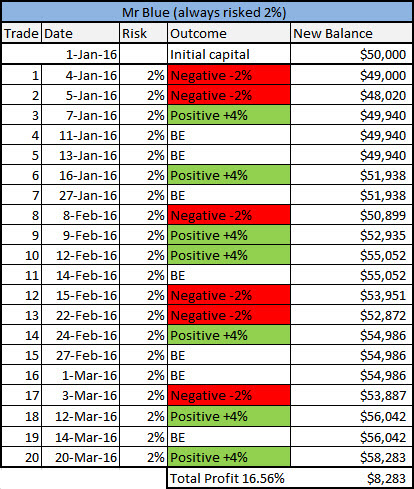
And finally, we have Mr. Blue, the most disciplined trader of the group. He clearly understands the importance of capital protection and consistent risk management. He risked only 2% per trade throughout his trading period.
With each losing trade, he lost just 2%, while winning trades brought him a 4% gain, reflecting a 1:2 risk-to-reward structure. Over a period of three months, he achieved a total profit of 16.56%, equivalent to $8,283.
This is what professional trading looks like in practice.
Just to remind you once again, all traders were using exactly the same trade setups. The only difference between them was the level of risk they were taking on each trade.
For anyone unfamiliar with the term BE, it stands for Break Even, meaning the trade was closed at the exact entry price, resulting in neither profit nor loss.
The risk-to-reward ratio was kept constant throughout the analysis, using an average value of 1:2.
Join us today !
 Elevate your trading with Elliott Wave Forecast!
 Ask unlimited questions during trading hours (Monday to Friday). Our Chat Rooms are an excellent place to learn, with continuous support from our market experts!
 Explore our expert insights and real-time analysis covering Forex, Indices, Commodities, Cryptocurrencies, Stocks, and ETFs across 78 instruments.
 Gain exclusive access to our Official Trading Recommendations in the Live Trading Room, where seasoned experts provide valuable insights and guidance on new trading opportunities.
 For just $0.99, unlock a wealth of knowledge and experience with our 14-day Trial. Experience firsthand our proven trading strategy, which accurately defines Entry, Stop Loss, and Take Profit levels, empowering you to make informed decisions with confidence.
 Ready to take the next step? Get your 14-day Trial in just a few clicks!

Offer Expires Soon!
Get full access to real-time Signals, Live Sessions, 24 Hour Chat Room Support and Expert Analysis — all for only $9.99 during your 14-day trial.
⏳ This limited-time price will expire soon — don’t miss out!
Get the Elliott Wave Trading Mastery Bundle — Free
100% FreeLearn how to read the markets with more structure using practical guides on:
- Elliott Wave rules and market structure
- Fibonacci levels and price targets
- 3, 7 and 11-swing patterns
- Forex, stocks, ETFs and crypto
- Technical analysis and risk management
Plus, get free market insights, educational emails, and our Chart of the Day to keep building your skills.
Start learning today — no cost, no card required.
Related Articles
Don’t Chase Price: The Power of the 3-Wave Pullback
Many traders make Elliott Wave more complicated than necessary. Instead of trying to memorize every...

XAUUSD Climbs as Elliott Wave Analysis Predicts Upside
XAUUSD Climbs as Technical Wave Analysis Predicts Upside Hello Traders, in today’s blog, we’re reviewing...

New to Elliott Wave? Don’t Trade Until You Understand This Pattern
Hello, fellow traders! If you’re new to Elliott Wave, this article will show you where...

Your next trading opportunity awaits!

✓ Live Trading Rooms (Signals) & Live Analysis Sessions
✓ High-probability trade setups & more
