

In this technical blog, we’ll cover the fundamentals of Elliott Wave Theory to help you get started with one of the most powerful forms of Technical Analysis. Elliott Wave Theory is widely used to forecast financial market trends and cycles by identifying recurring patterns driven by investor psychology and market sentiment.
What Is Elliott Wave Theory?
One of the greatest strengths of Elliott Wave Theory is that virtually every price movement can be classified into a specific wave structure. Whether the market is trending or correcting, there is an Elliott Wave pattern that helps traders understand the current market position and anticipate the next move.
Mastering Elliott Wave patterns is a long-term journey that can take months or even years. However, every successful trader starts with the basics, and learning the core concepts is the first step toward building confidence in reading market structure.
Since today’s financial markets are largely dominated by corrective patterns. One of the most important skills to develop is the ability to identify 3-wave corrective structures. Fortunately, this is one of the easiest concepts to begin with and provides a solid foundation for more advanced Elliott Wave analysis.
In the example below, you’ll see a textbook bullish trend followed by a 3-wave corrective pullback labeled WXY. Recognizing this common Elliott Wave pattern is an essential skill for traders looking to improve their market analysis and identify high-probability trading opportunities.
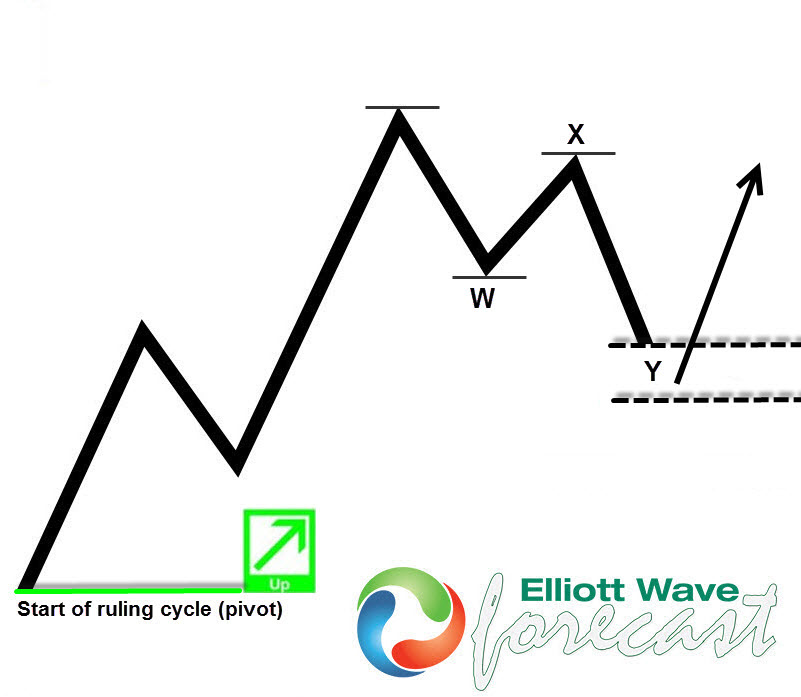
How to Identify 3-Wave Corrective Patterns
Note: 3 waves could be labeled with ABC but also with WXY like shown on the chart above. The way 3 waves are labeled depends on the internal price structure of the waves subdivisons. Learn more about that by downloading Free Elliott Wave book from our homepage and checking out previous lessons on Flat, Zig-Zag and Double Three Patterns in Technical Blogs Section.
If you take a look at the chart of almost any financial market, you’ll notice that many major turning points are preceded by a 3-wave corrective pattern. Sometimes these structures are easy to identify, while other times they can be more complex. However, learning to recognize them is one of the most valuable skills you can develop. 3 waves pattern will become the foundation of your Elliott Wave trading strategy.
Important note
Let’s assume you have already identified the overall market trend and have a strong directional bias. The mistake many traders make is entering a position in the middle of an impulsive move without first analyzing the wave structure. More often than not, this leads to being stopped out before the trend resumes.
Instead, you should wait for a 3-wave corrective pullback against the prevailing trend before looking for an entry. This approach allows you to enter the market at a higher-probability location while keeping your risk under control.
Over the years, we have developed a highly effective Elliott Wave trading strategy that identifies high-probability trading opportunities by defining precise Entry, Stop Loss, and Take Profit levels. The strategy also enables traders to move their positions to risk-free shortly after entry whenever market conditions allow, helping to protect trading capital while maximizing potential returns.
Imagine Trading With A Clear Plan Every Day.
Imagine opening your charts knowing exactly what you’re waiting for.
No chasing.
No guessing.
No emotional decisions.
Just a structured trading plan built on professional Elliott Wave analysis.
That’s exactly what thousands of Elliott Wave Forecast members experience every day.
Our analysts continuously monitor 78 markets, identifying high-probability opportunities while providing the education and guidance that help traders become more consistent over time.
Inside your membership you’ll gain access to:
✓ Daily Elliott Wave Market Analysis
✓ Official Trading Recommendations
✓ Live Trading Room
✓ Unlimited Questions During Trading Hours
✓ Professional Market Coverage Across Forex, Stocks, ETFs, Commodities & Crypto
✓ Entry, Stop Loss & Take Profit Levels
The market will always create new opportunities.
The question is whether you’ll be prepared when they arrive.
Experience Elliott Wave Forecast risk-free for 14 days for only $9.99.
Your next great trading decision could begin today.
Offer Expires Soon!
Get full access to real-time Signals, Live Sessions, 24 Hour Chat Room Support and Expert Analysis — all for only $0.99 during your 14-day trial.
⏳ This limited-time price will expire soon — don’t miss out!




