Hello fellow traders. In this technical article, we are going to present Elliott Wave charts of Bitcoin BTCUSD . As our members know Bitcoin has given us good trading setups recently. The crypto is now showing impulsive bullish sequences in the cycle from the 98,374 low calling for further strength. In the following sections, we will delve into the specifics of the Elliott Wave pattern.
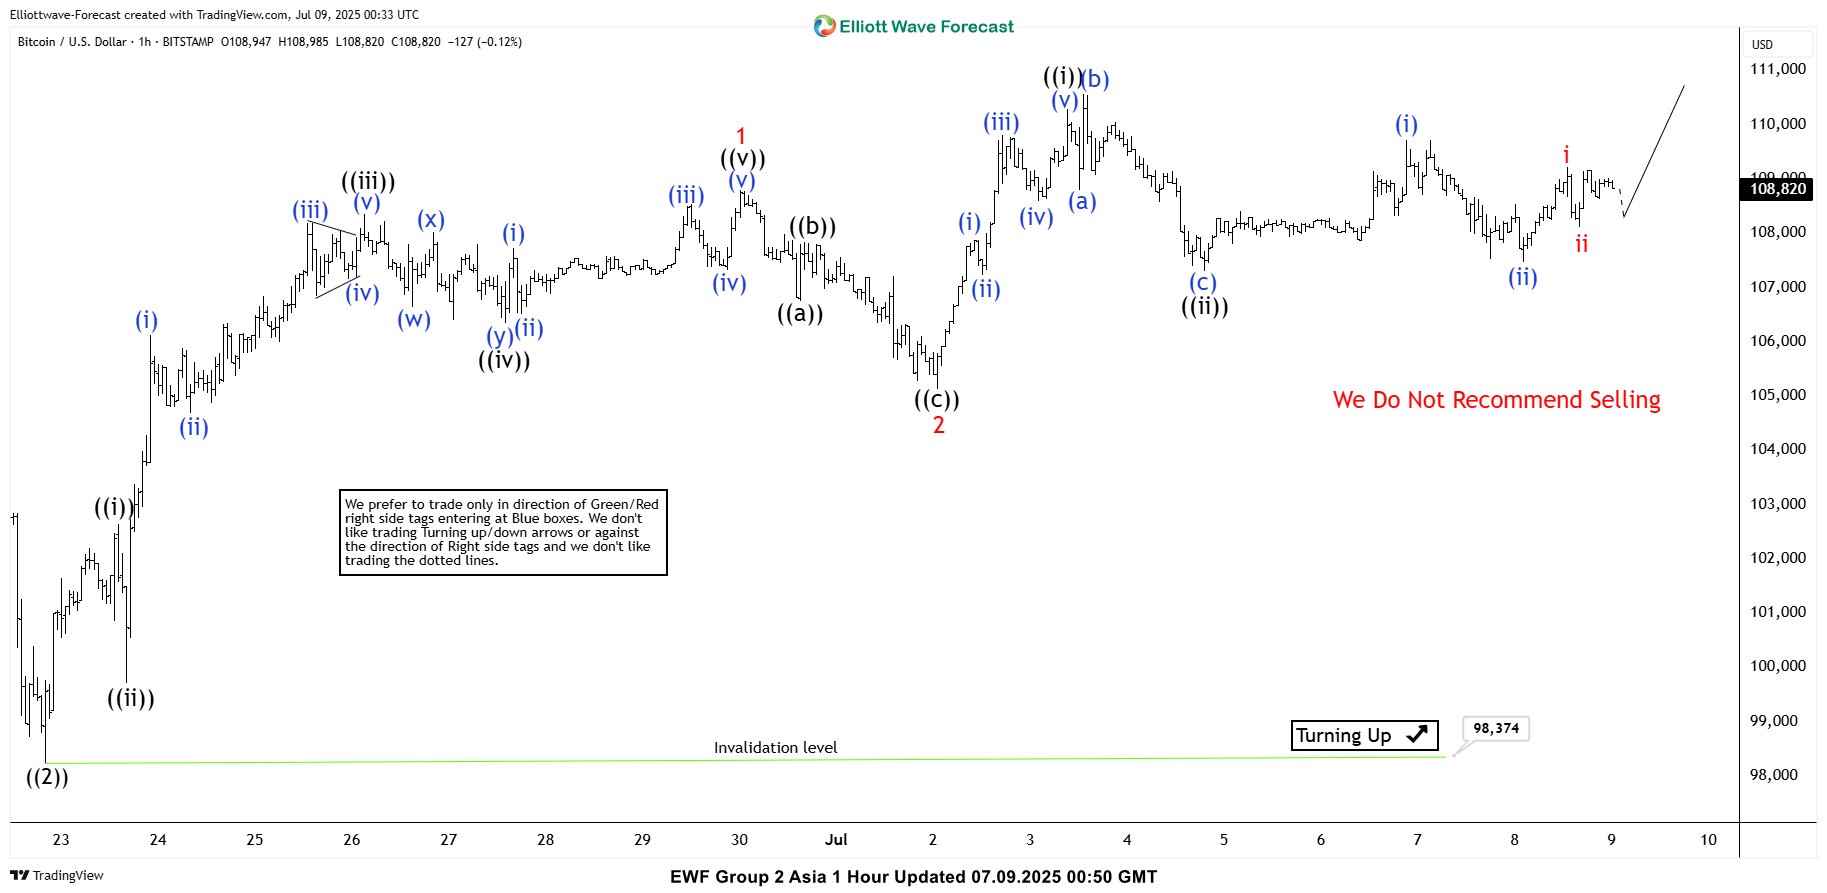
BTCUSD Elliott Wave 1 Hour Chart 07.09.2025
The current analysis suggests that BTCUSD is trading within the cycle from the 98,374 low. The price structure is showing higher high bullish sequences. Intraday pull back ((ii)) black is counted completed at the 107,328 low. While above that level and more importantly while above 2 red low we expect further strength in the crypto, targeting 115,606-122,033 area
90% of traders fail because they don’t understand market patterns. Are you in the top 10%? Test yourself with this advanced Elliott Wave Test
BTCUSD Elliott Wave 1 Hour Chart 07.09.2025
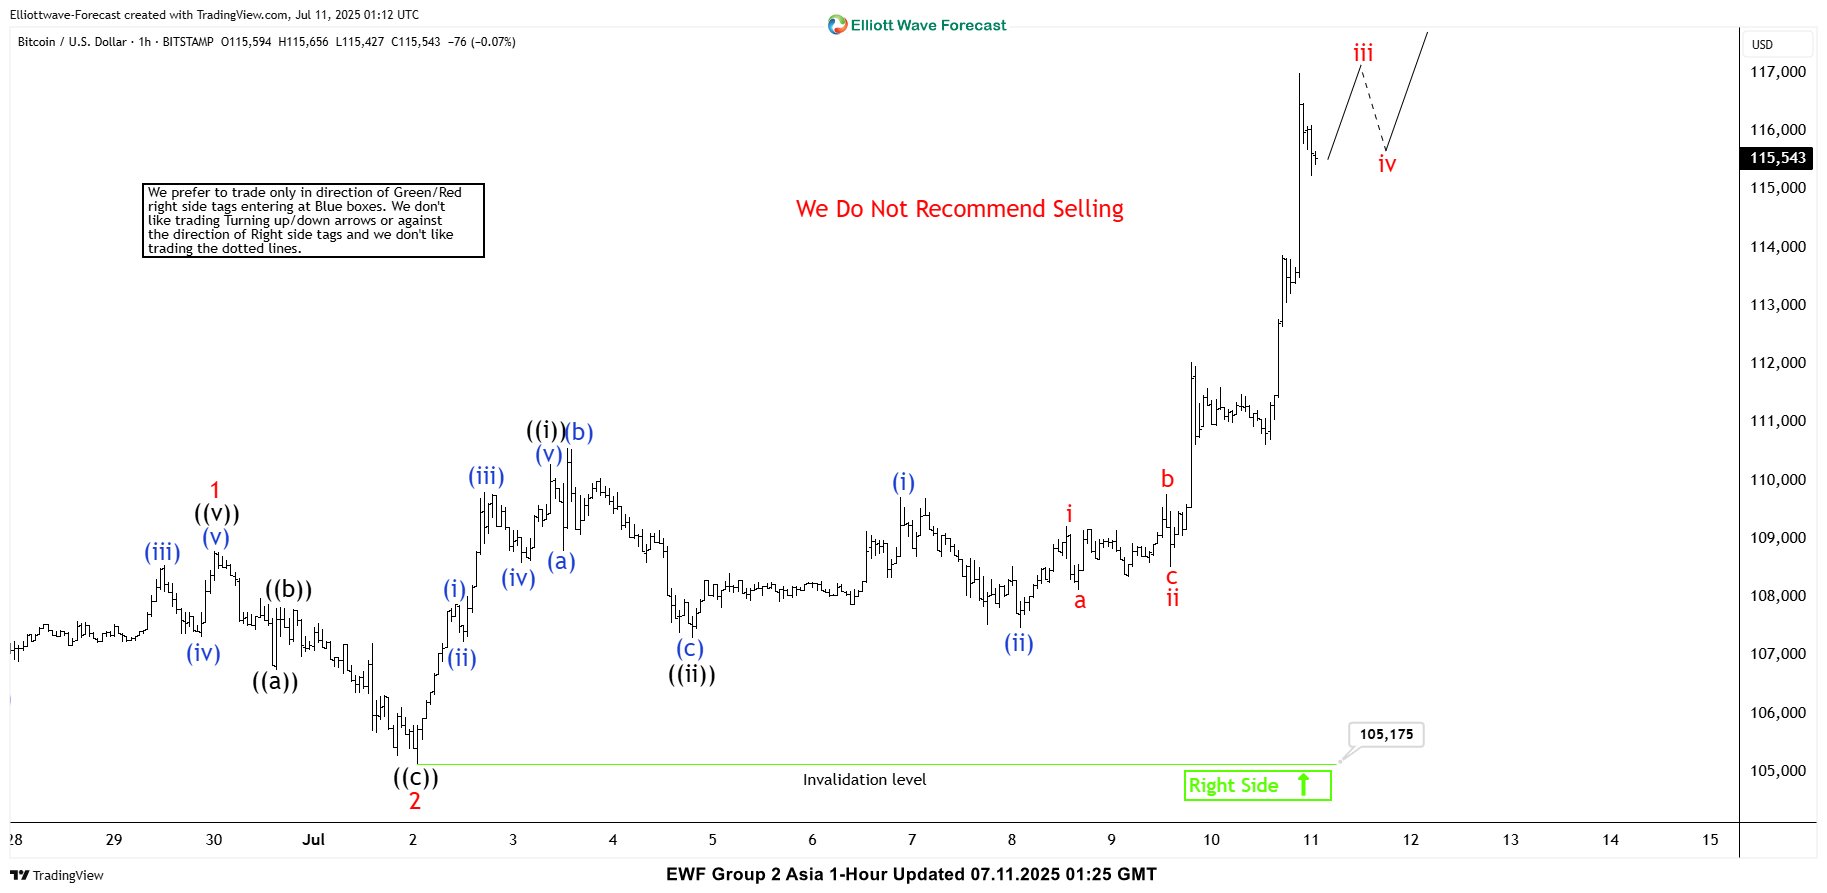
The crypto held above the 107,328 low and continued to rally, as expected. The price made a break toward new all-time highs. We do not recommend selling the crypto at this time and favor the long side. Bitcoin should ideally keep trading higher in the upcoming days. However, keep in mind that the target for wave 3 has been reached at the 115,606–122,033 area, from where we can see a 3-wave pullback in red wave 4 before the continuation of the trend resumes. We don’t recommend selling the crypto.
Reminder for members: Our chat rooms in the membership area are available 24 hours a day, providing expert insights on market trends and Elliott Wave analysis. Don’t hesitate to reach out with any questions about the market, Elliott Wave patterns, or technical analysis. We’re here to help.