In the world of trading, precision is everything. Reacting to a market move after it happens is easy but anticipating where buyers will step in before a single green candle prints is where the real edge lies.
Today, we’re breaking down a textbook technical setup on Apple Inc. (AAPL) using Elliott Wave theory, focusing on our high probability “Blue Box” forecasting area.
The Setup: Mapping the Correction
When analyzing the price action of AAPL, our primary focus was tracking a clear corrective structure against the dominant uptrend. In technical analysis, markets rarely move in a straight line; they breathe in impulses and breathe out in corrections.
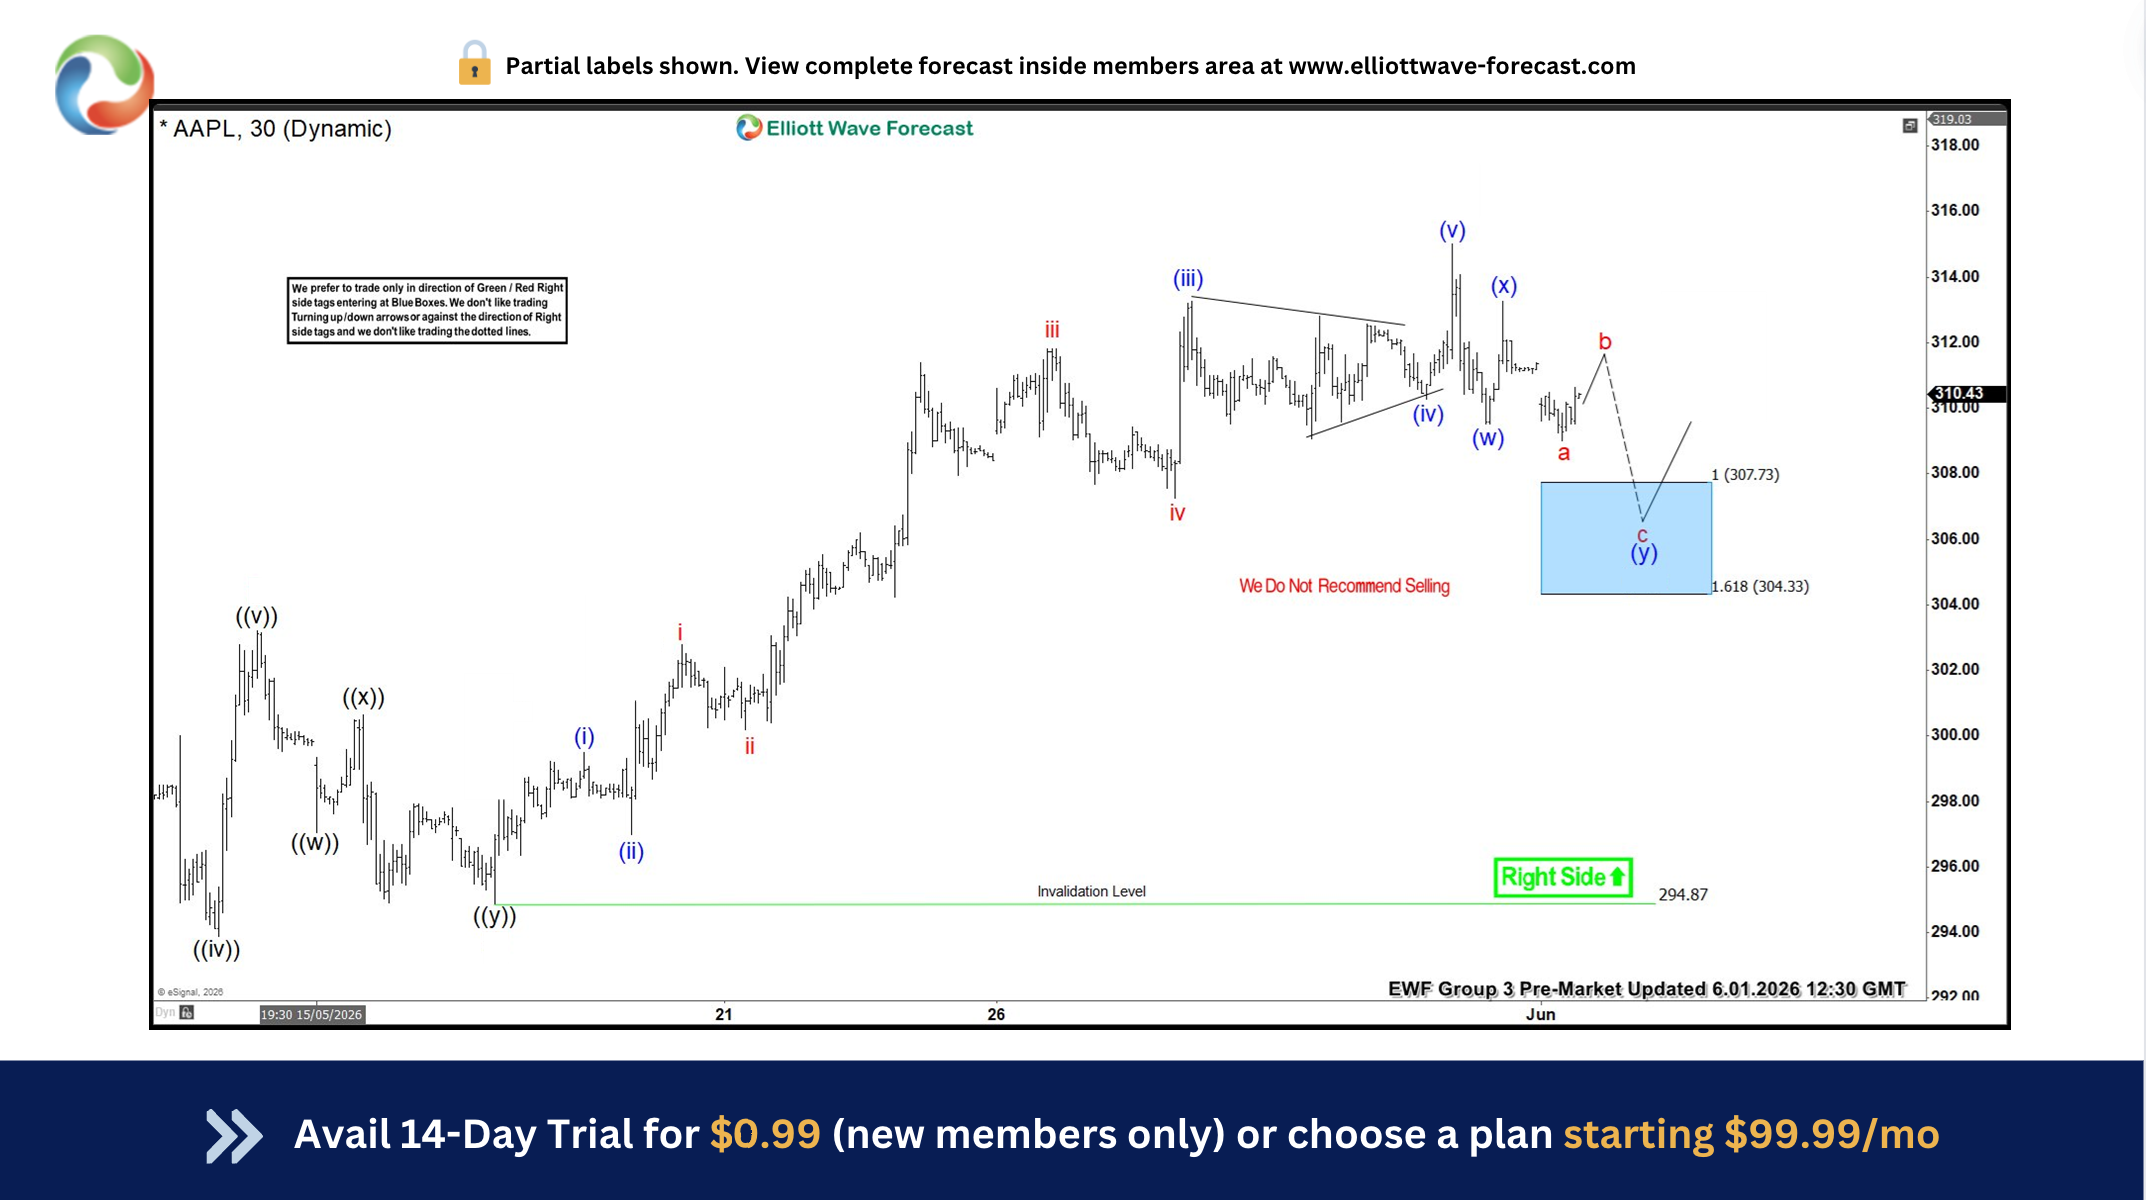
As shown in the chart AAPL from 06.01.2026 chart below, AAPL completed a multi-wave bullish cycle and began pulling back in a corrective sequence. Instead of guessing a random support level, we utilized Elliott Wave structures and Fibonacci extensions to identify a precise inflection point.
The Anatomy of the Blue Box
Our chart highlighted a highly reliable area known as the Blue Box. For those unfamiliar with our methodology, a Blue Box represents a high-probability technical zone where 3, 7, or 11 waves of a corrective pattern are expected to terminate, clearing the path for the market to resume its primary trend.
- The Pattern: The correction unfolded as a double three structure, labeled (w)‑(x)‑(y). Later, as charts progress, this can transition into ((a))‑((b))‑((c)) with charts moving to future.
- The Target Zone: The 100%–161.8% Fibonacci extension of the initial leg down gave us a defined value range between 307.73 and 304.33.
- The Directive: Right on the chart, our system displayed two clear, disciplined reminders:
“Right Side ⬆“ (indicating the primary trend remains bullish)
“We Do Not Recommend Selling”
The Execution: Precision Inside the Blue Box
When we first looked at the setup, AAPL was completing a corrective sequence. Rather than chasing the market or guessing support levels blindly, we trusted our system’s Blue Box—our signature high-probability inflection zone.
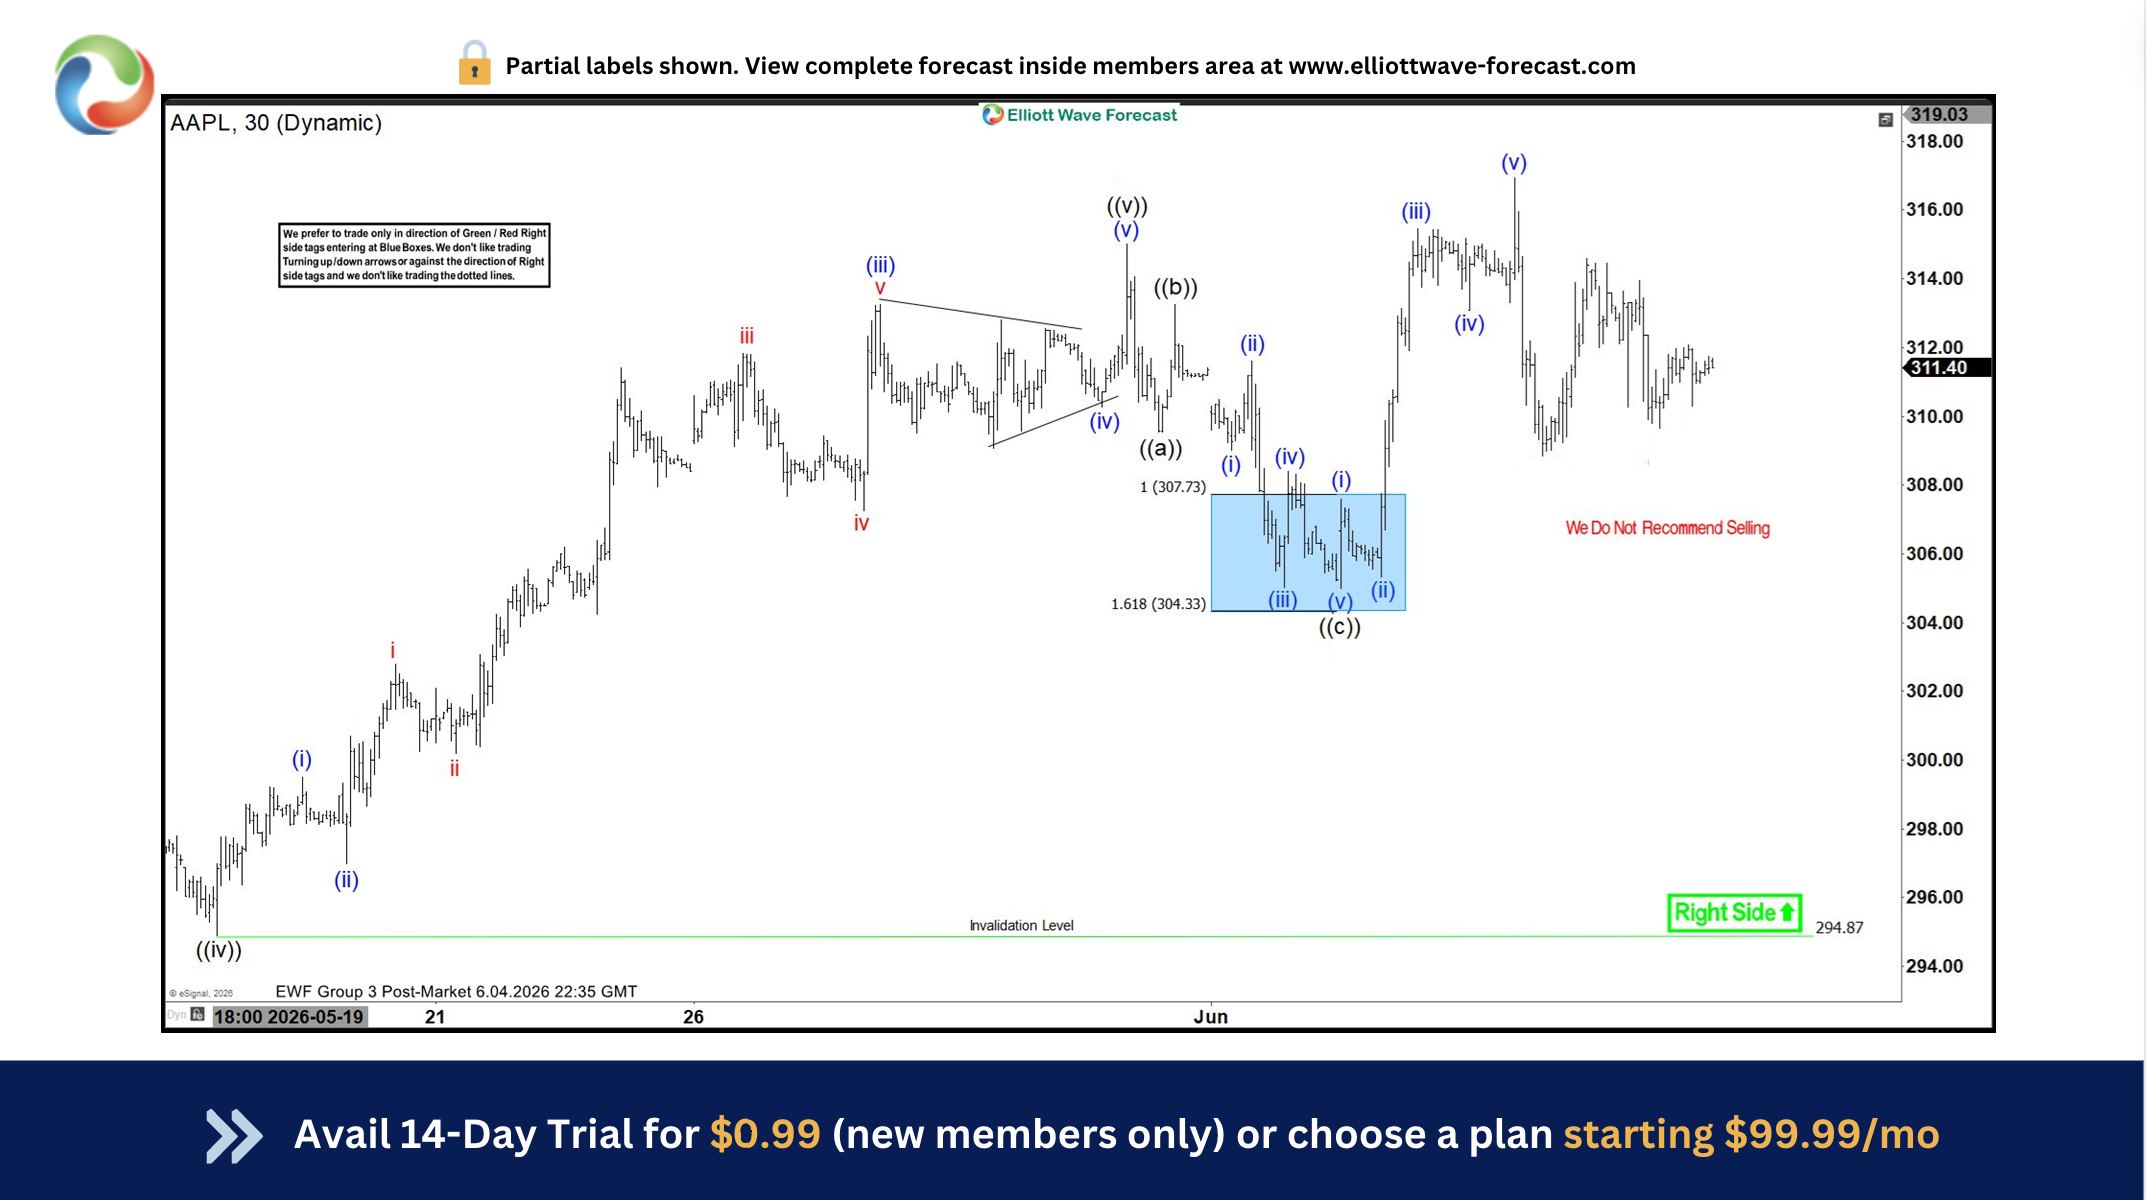
As seen in the updated chart AAPL 06.04.2026 chart below, the price followed our blueprint with incredible technical accuracy.
The Result: A Powerful Bullish Turn
Once wave ((c)) wrapped up inside the blue box, the “Right Side ⬆” bullish trend reasserted itself with authority.
As captured in AAPL 06.04.2026 chart above, AAPL launched out of the blue box into an aggressive, multi-wave impulsive rally. The stock quickly cleared previous short-term resistance levels, pushing up toward the $315–$316 region to complete subsequent impulsive waves (iii) and (v) allowing longs to take partial profits.
This textbook reaction gave disciplined traders an incredibly low-risk entry point with maximum reward potential, proving once again why we emphasize waiting for the market to come to the blue box rather than forcing trades.
Why the Blue Box Works?
Many traders make the mistake of trying to “catch a falling knife” during a pullback. The Blue Box acts as a filter. It tells us to be patient, wait for the market to reach an area where buyers have a mathematical advantage, and then look for the turn.
By looking at AAPL chart from 06.01.2026, our members knew well in advance exactly where the correction was projected to exhaust itself. This completely eliminates the emotional guesswork from trading.
At Elliottwave Forecast (EWF), we deliver consistent market updates through regular charts update. Our analysts update 1‑hour charts four times daily and 4‑hour charts once per day across all 78 instruments. In addition, we host five live sessions each day and maintain a 24‑hour chatroom, providing clients with real‑time market guidance and answers to any questions they may have.
You can start a 14‑day trial with us today here and cancel anytime by emailing support@elliottwave-forecast.com


