
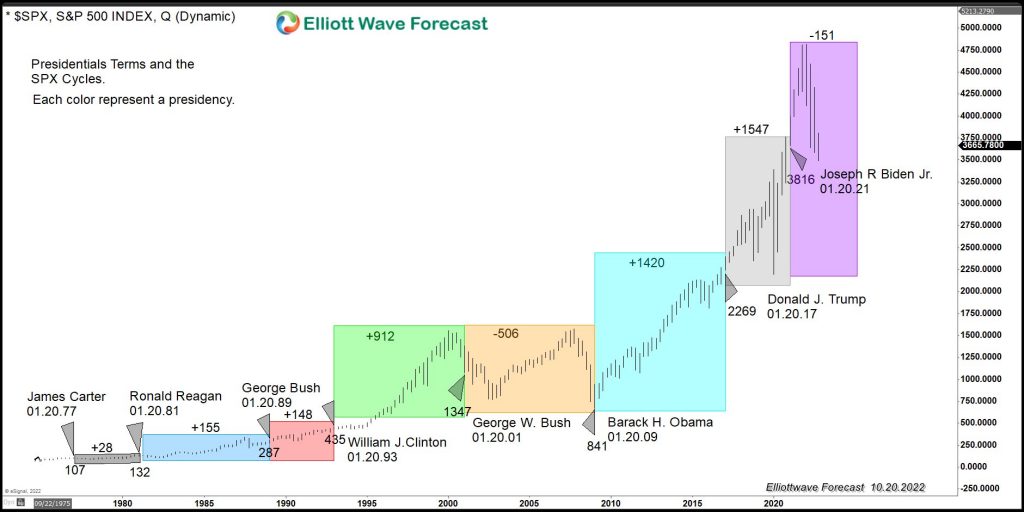
A lot has been said and written about both the Democrat and Republican economic plans for a better economy. We believe in free enterprise and limited regulation, allowing humans to create and expand at their own will for the better but there is a vast difference between the two parties regarding the economic agenda. Most […]
-
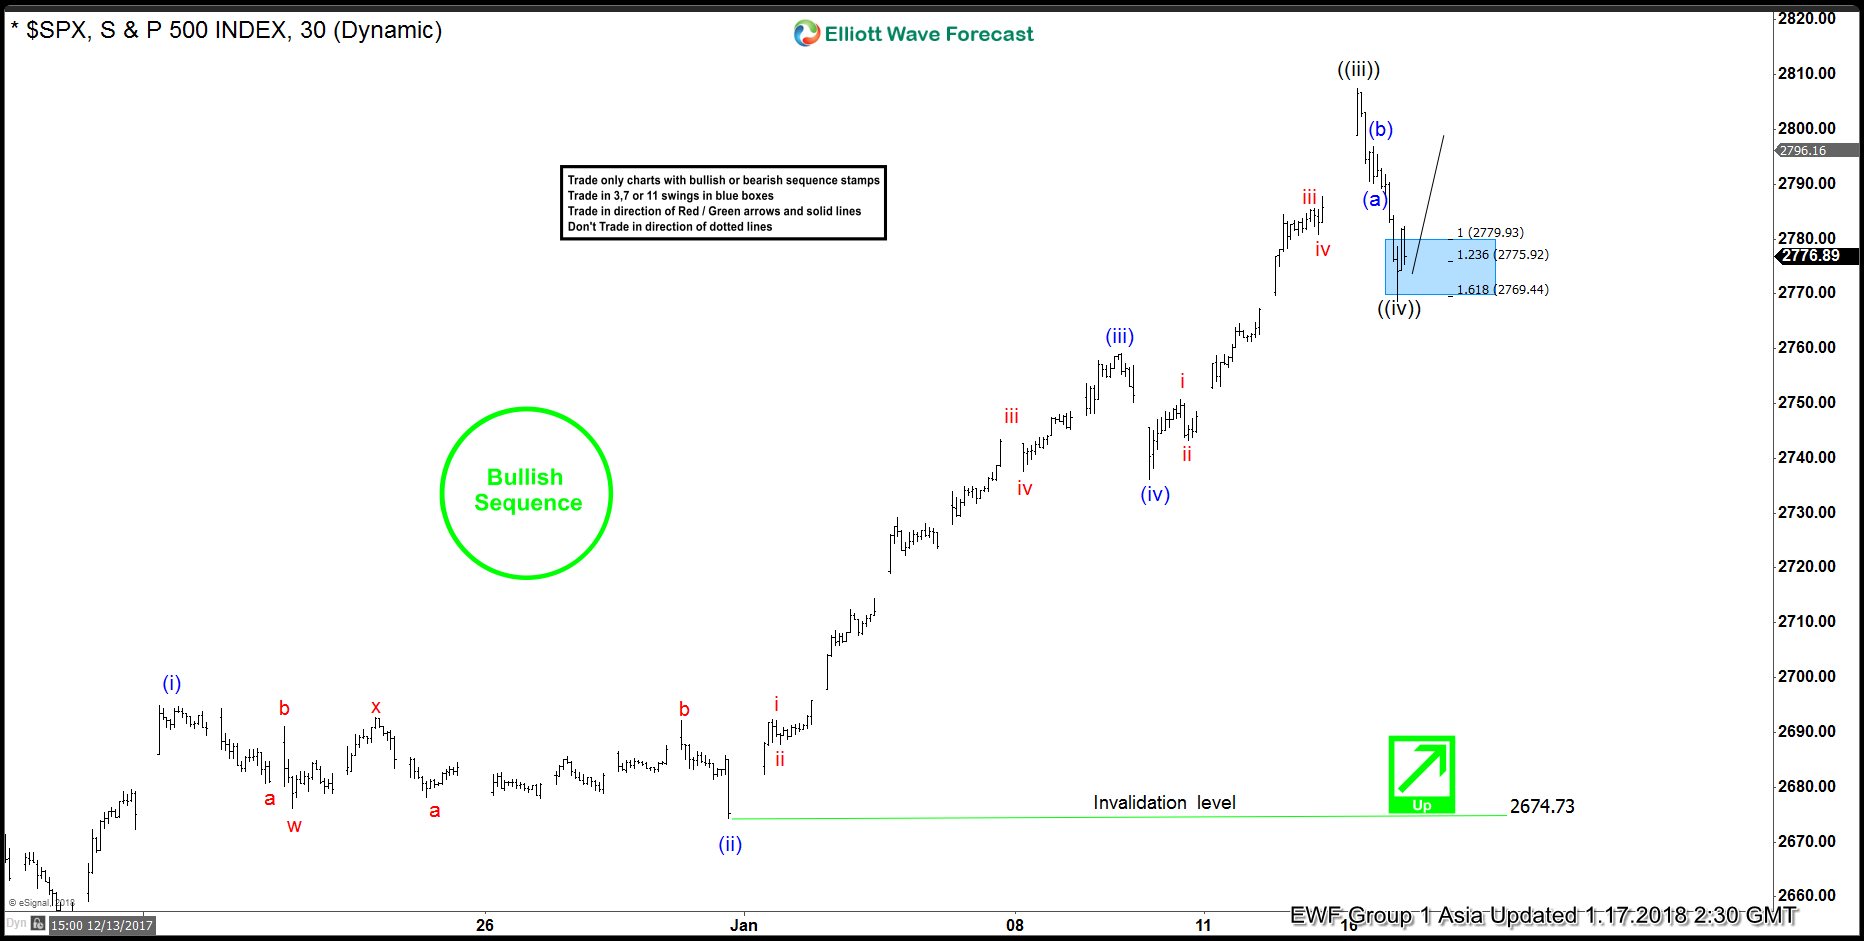

Elliott Wave Analysis: SPX Remains Buy in Dips
Read MoreSPX Short Term Elliott Wave view suggests that rally from 12/2/2017 low is unfolding as 5 waves impulsive Elliott Wave structure where Minute wave ((i)) ended at 2665.19, Minute wave ((ii)) ended at 2624.75, Minute wave ((iii)) ended at 2807.54, and Minute wave ((iv)) appears complete at 2768.64. Index still needs to break to a new high […]
-
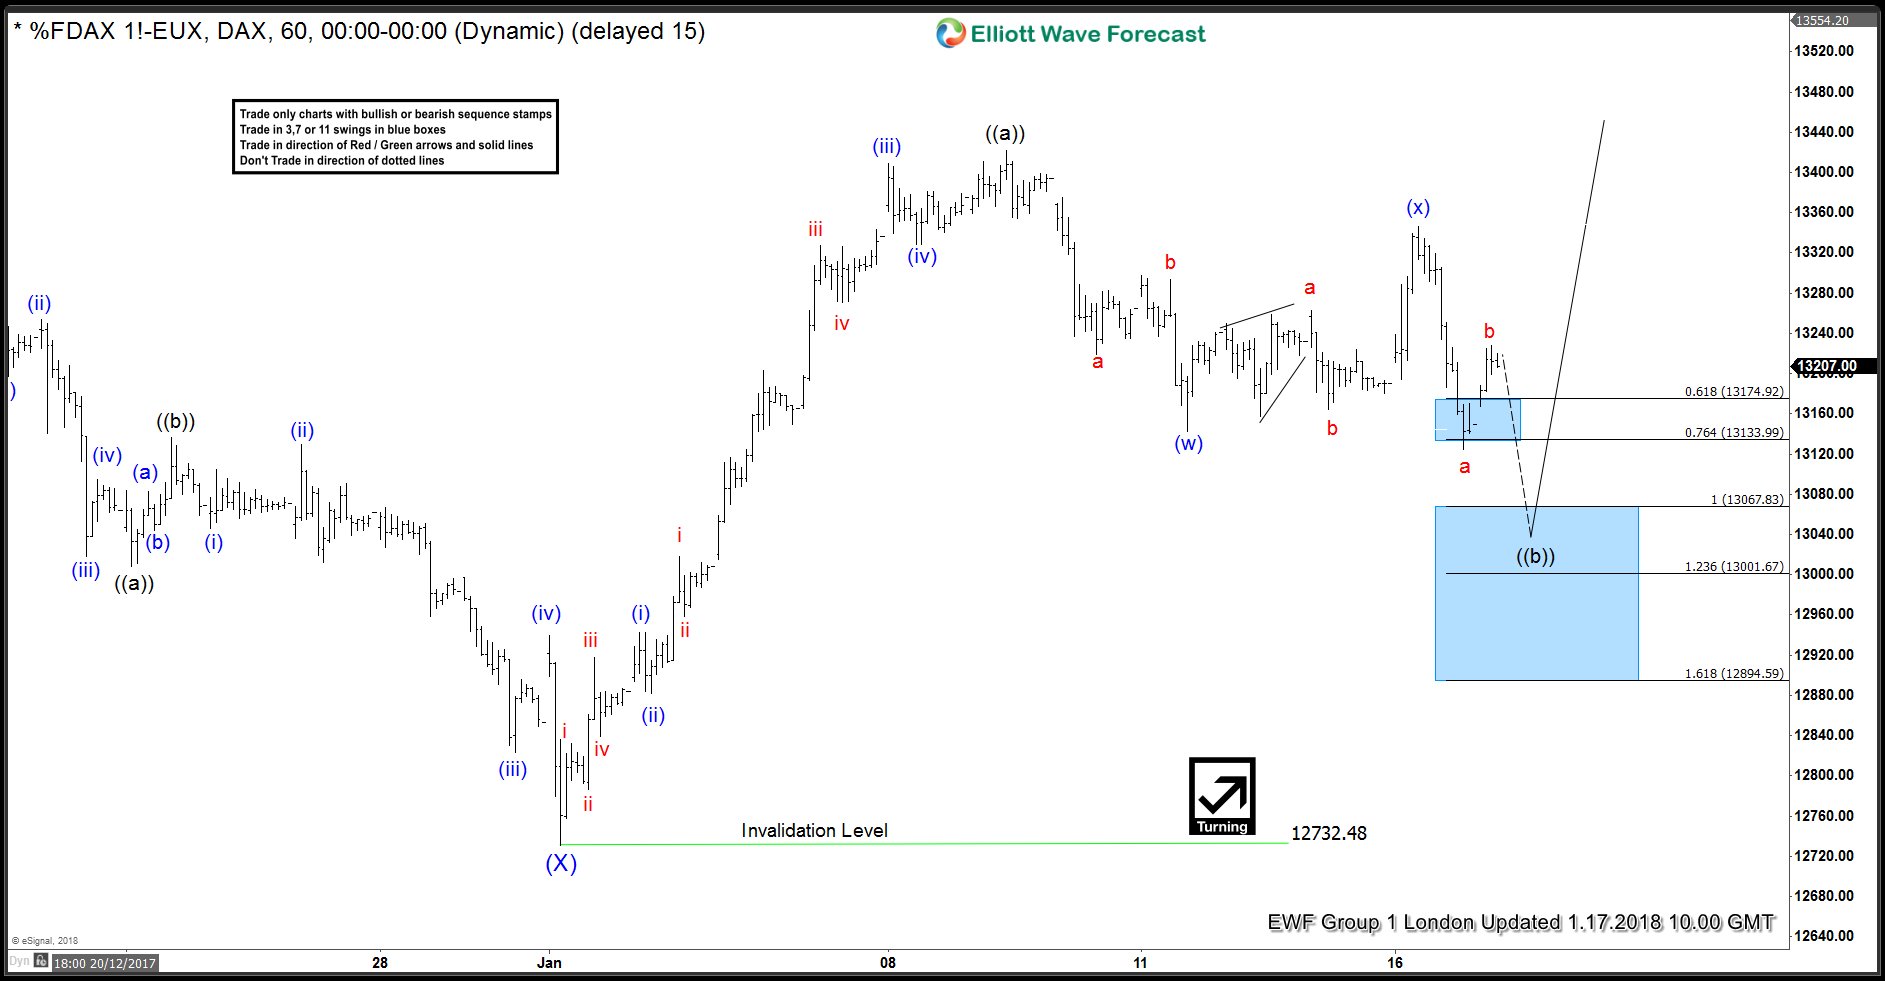
DAX Elliott Wave View: Doing Double Correction
Read MoreDAX Short Term Elliott Wave view suggests that Intermediate wave (X) ended at 12732.48 on 1/02 low. A rally from there is unfolding as a 5 waves impulsive Elliott Wave structure where Minutte wave (i) ended at 12943. Minutte wave (ii) ended at 12881.5, Minutte wave (iii) ended at 13408.5. Minutte wave (iv) ended at 13328.5, and Minutte wave (v) of […]
-
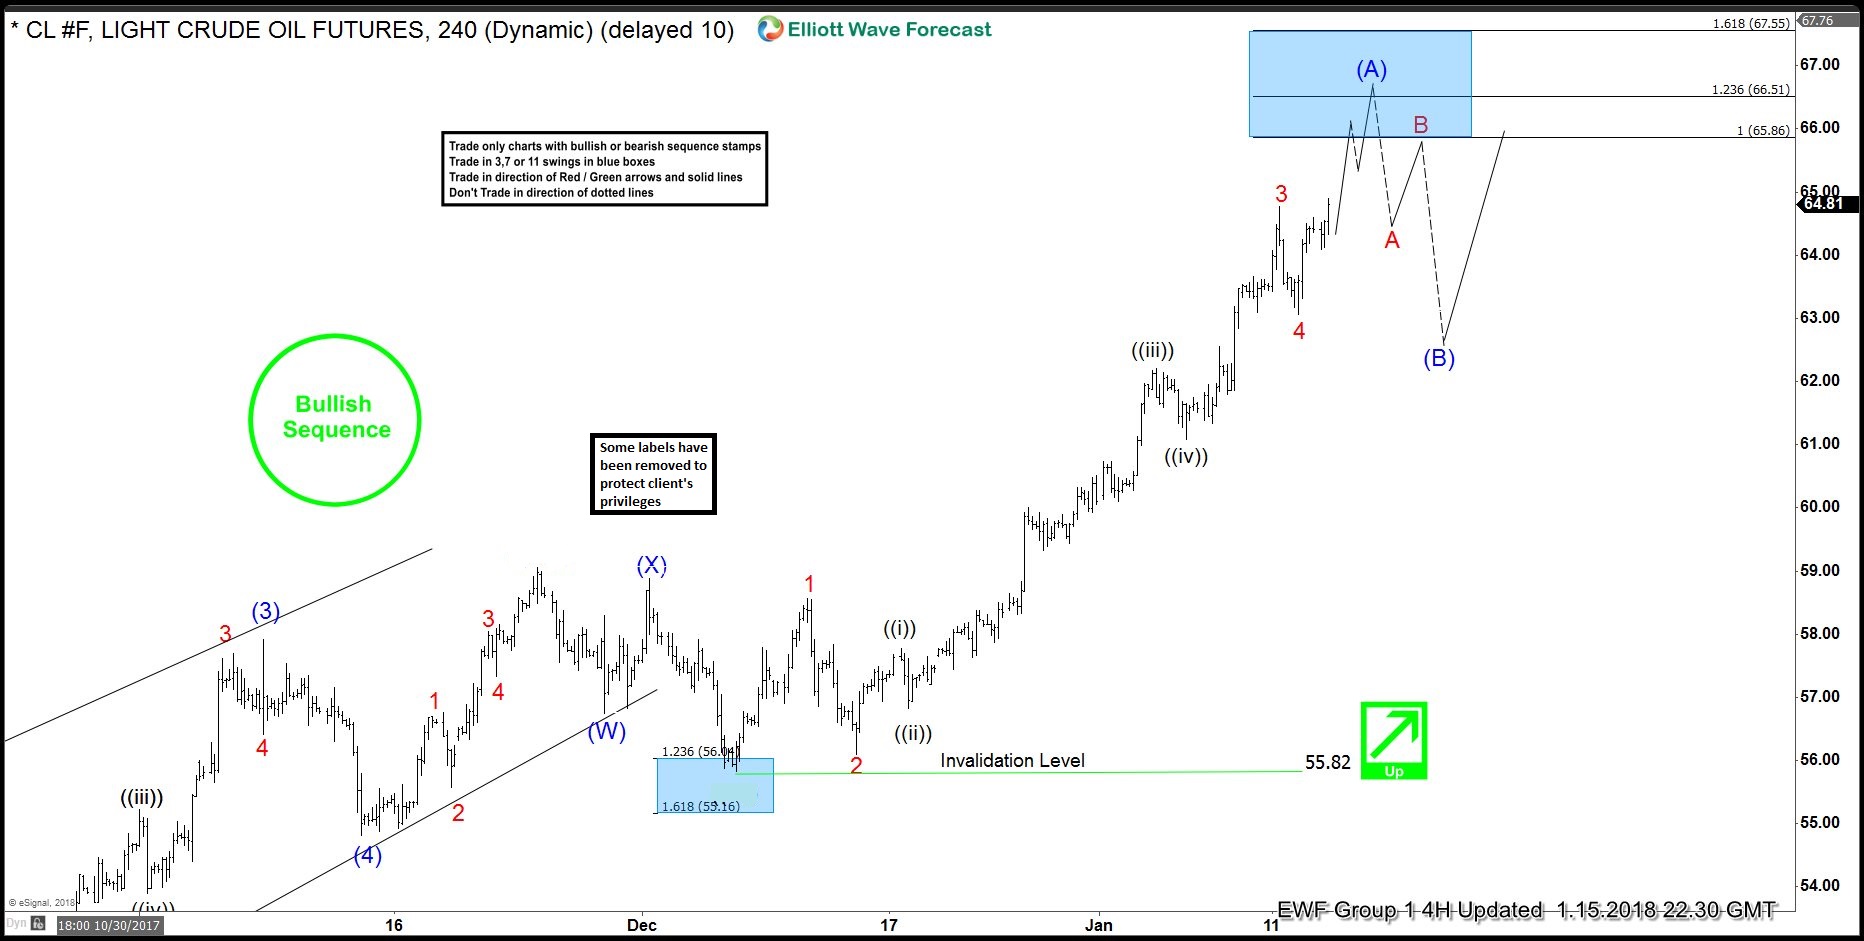
OIL (CL #F) Showing Impulsive Sequence
Read MoreOIL (CL #F) Short-term Elliott Wave view suggests that the rally from 55.82 December 07 low is unfolding as an impulse Elliott Wave structure with extension in 3rd swing higher, where each leg has internal oscillations of 5 waves thus favoring it to be an impulse. These 5 waves move higher should end the Intermediate wave (A) higher in an Impulse sequence. Afterwards, the […]
-
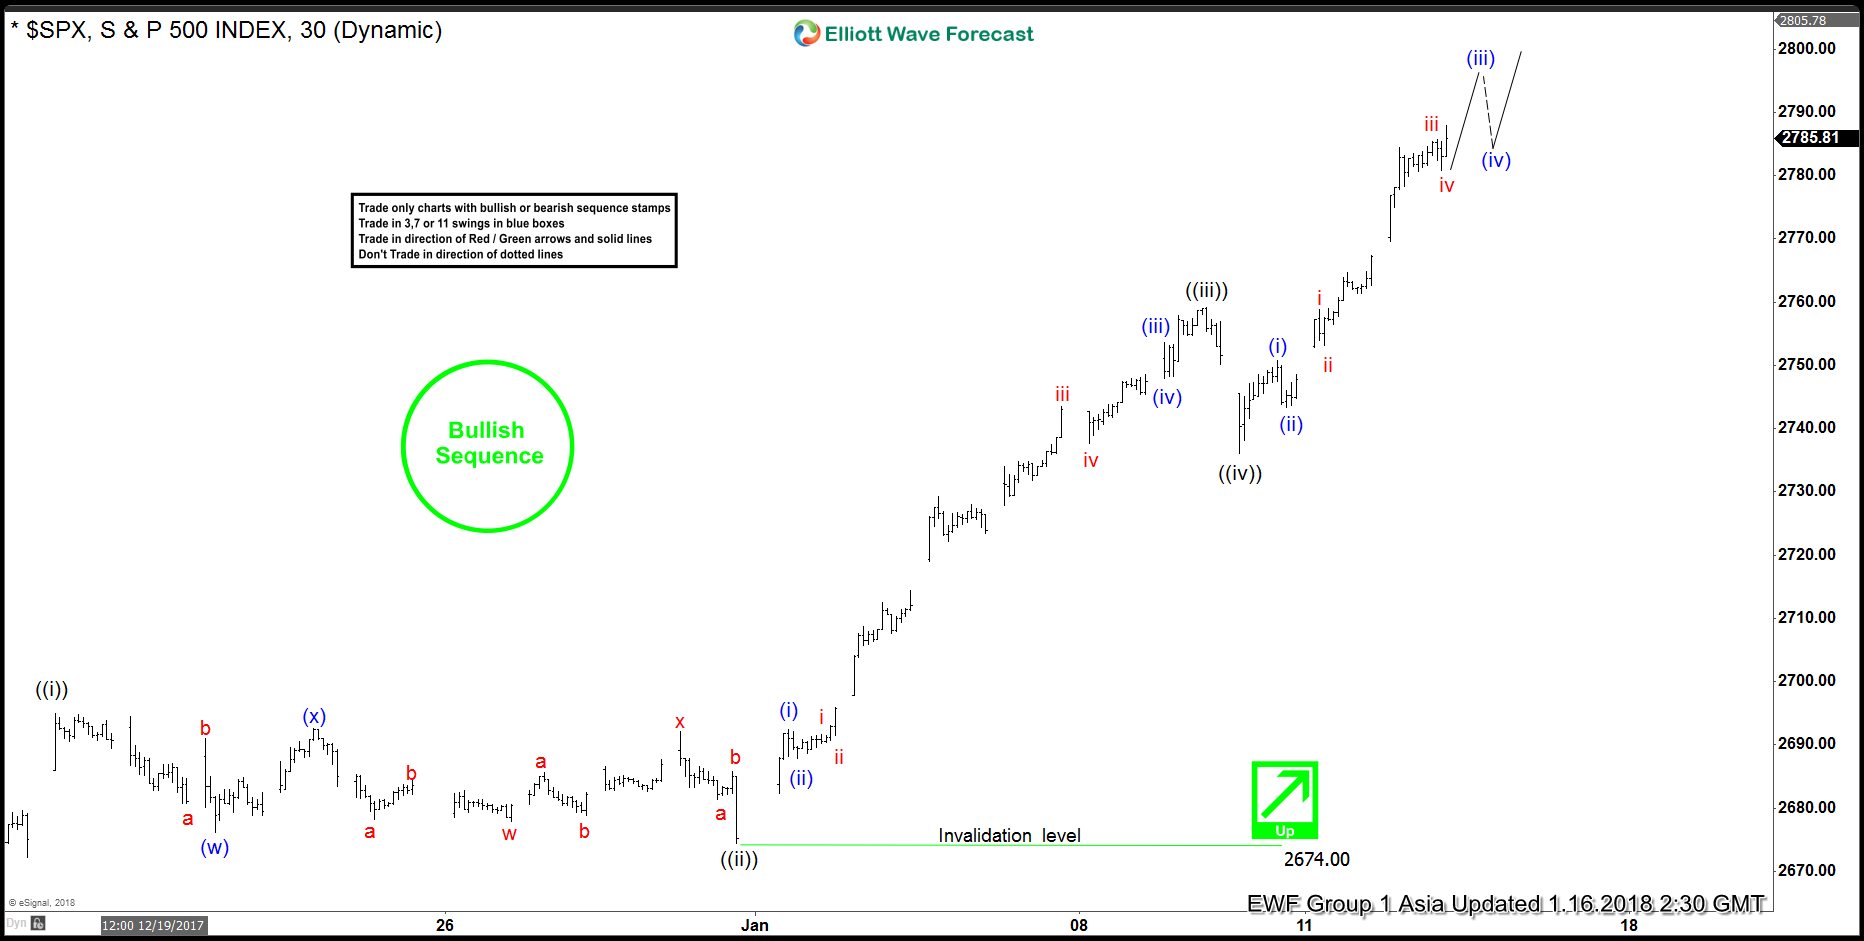
Elliott Wave Analysis: SPX Extending Higher
Read MoreSPX Short Term Elliott Wave view suggests that rally from 12/2/2017 low is unfolding as 5 waves impulsive Elliott Wave structure where Minute wave ((i)) ended at 2694.97, Minute wave ((ii)) ended at 2673.61, Minute wave ((iii)) ended at 2759.14, and Minute wave ((iv)) ended at 2736.06. Internal of Minute wave ((v)) is unfolding also as 5 waves […]