
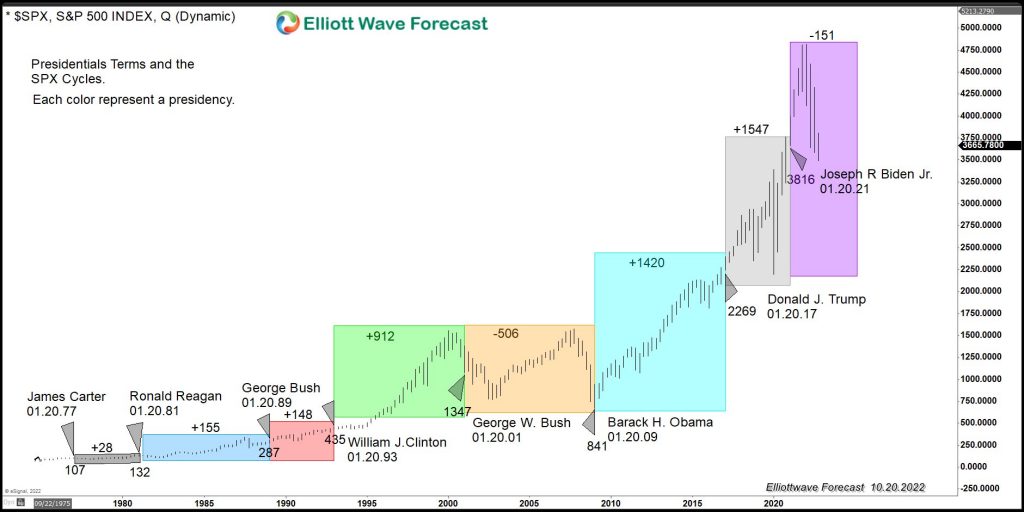
A lot has been said and written about both the Democrat and Republican economic plans for a better economy. We believe in free enterprise and limited regulation, allowing humans to create and expand at their own will for the better but there is a vast difference between the two parties regarding the economic agenda. Most […]
-
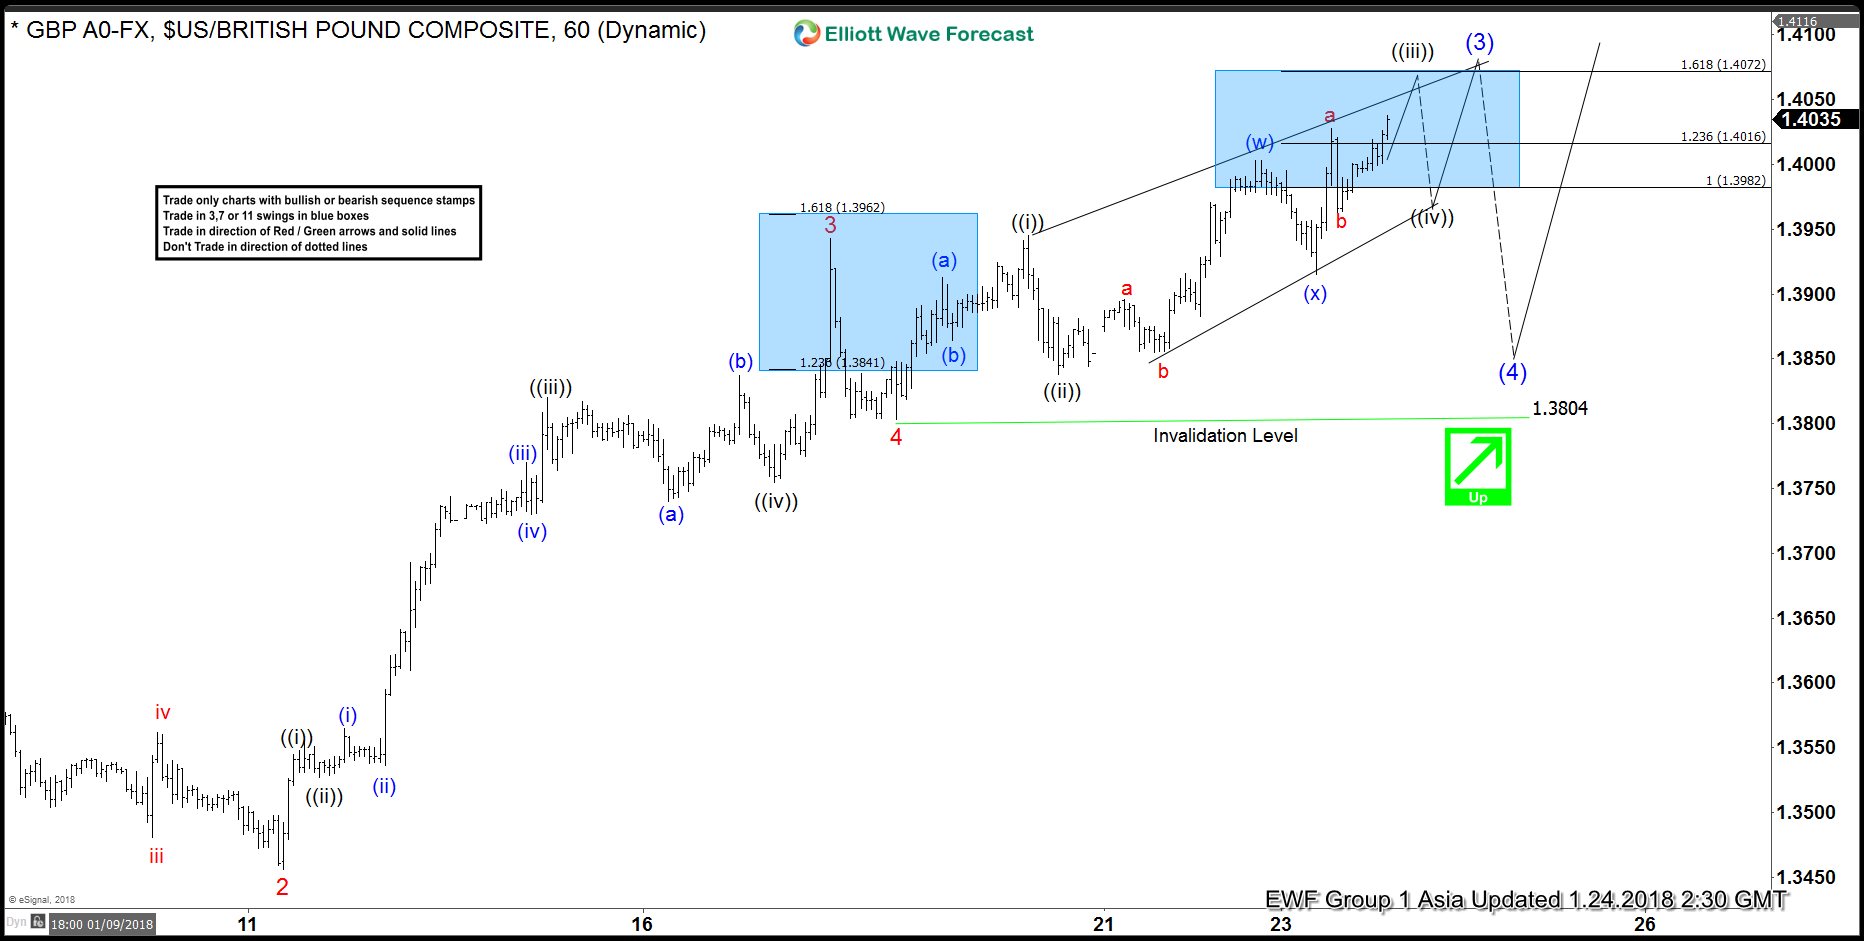

Elliott Wave Analysis: GBPUSD doing an ending diagonal
Read MoreGBPUSD Short Term Elliott Wave view suggests that the pair rallies as 5 waves impulse Elliott Wave structure from 16 December 2017 low. Up from 16 December 2017 low (1.33), Minor wave 1 ended at 1.3613, pullback to 1.3456 ended Minor wave 2, rally to 1.3943 ended Minor wave 3, and Minor wave 4 ended at 1.3803. […]
-
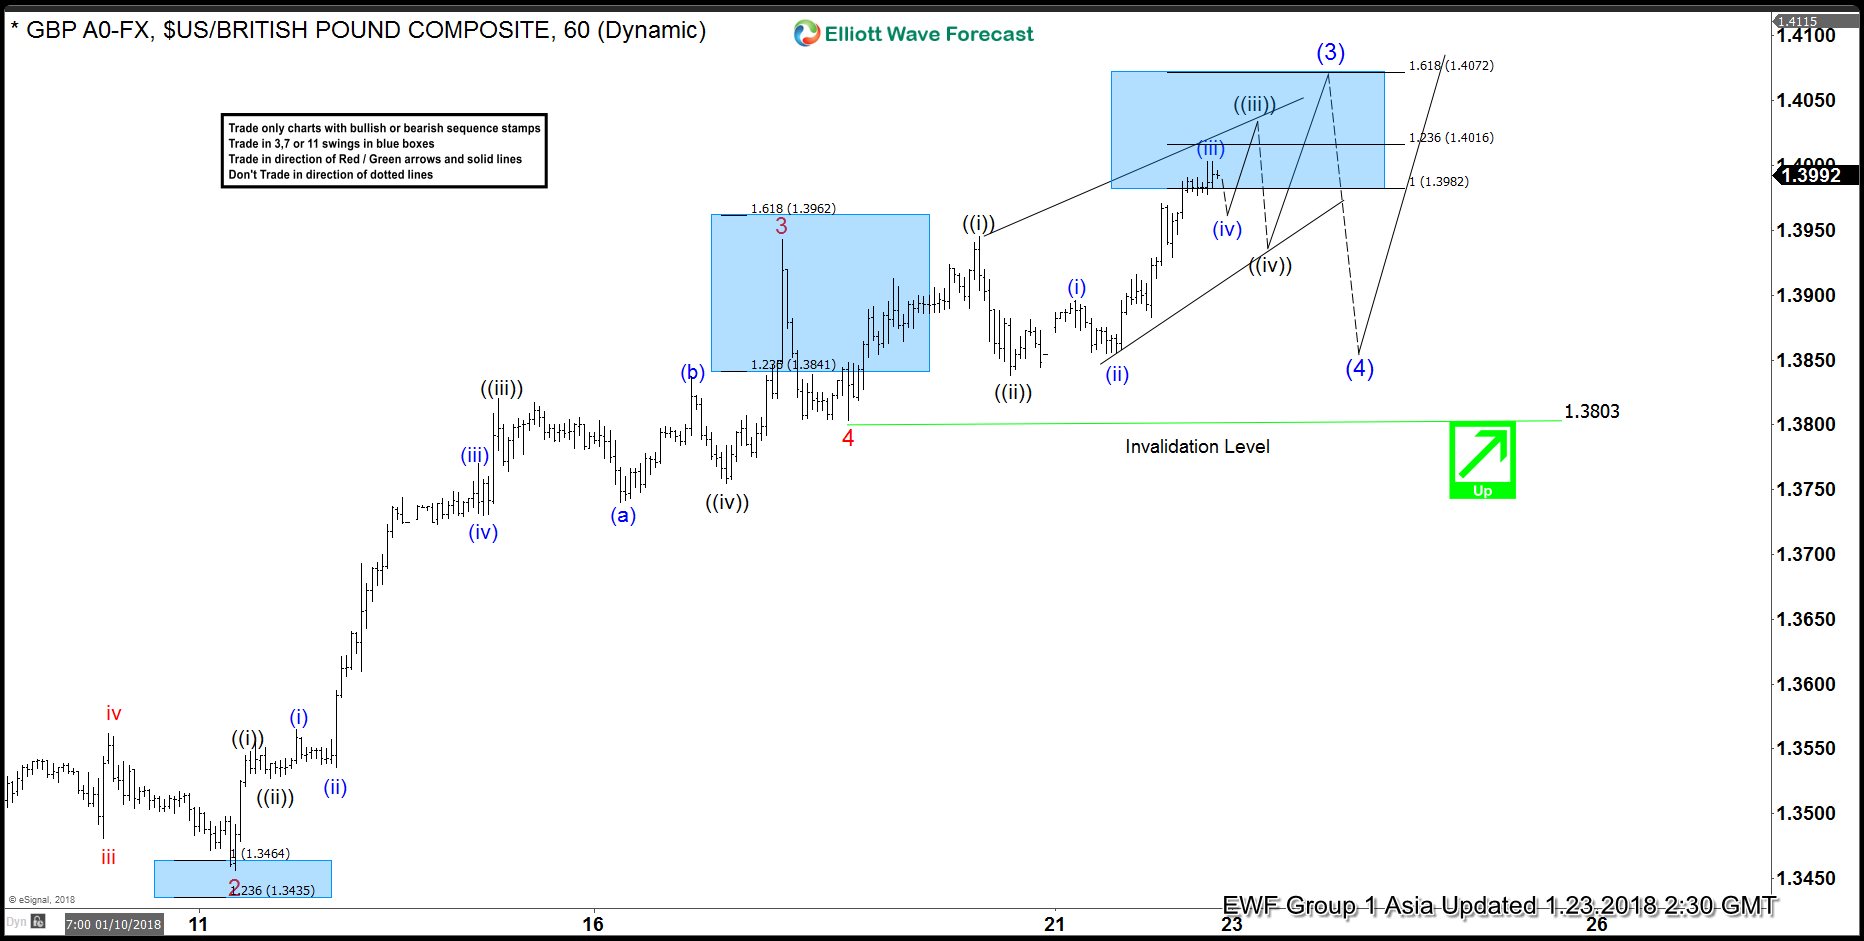
GBPUSD Elliott Wave Analysis: More Upside Expected
Read MoreGBPUSD Short Term Elliott Wave view suggests that rally from 16 December 2017 low is unfolding as 5 waves impulse Elliott Wave structure. Up from 16 Dec 2017 low (1.33), Minor wave 1 ended at 1.3613, Minor wave 2 ended at 1.3456, Minor wave 3 ended at 1.3943, and Minor wave 4 ended at 1.3803. Pair has […]
-
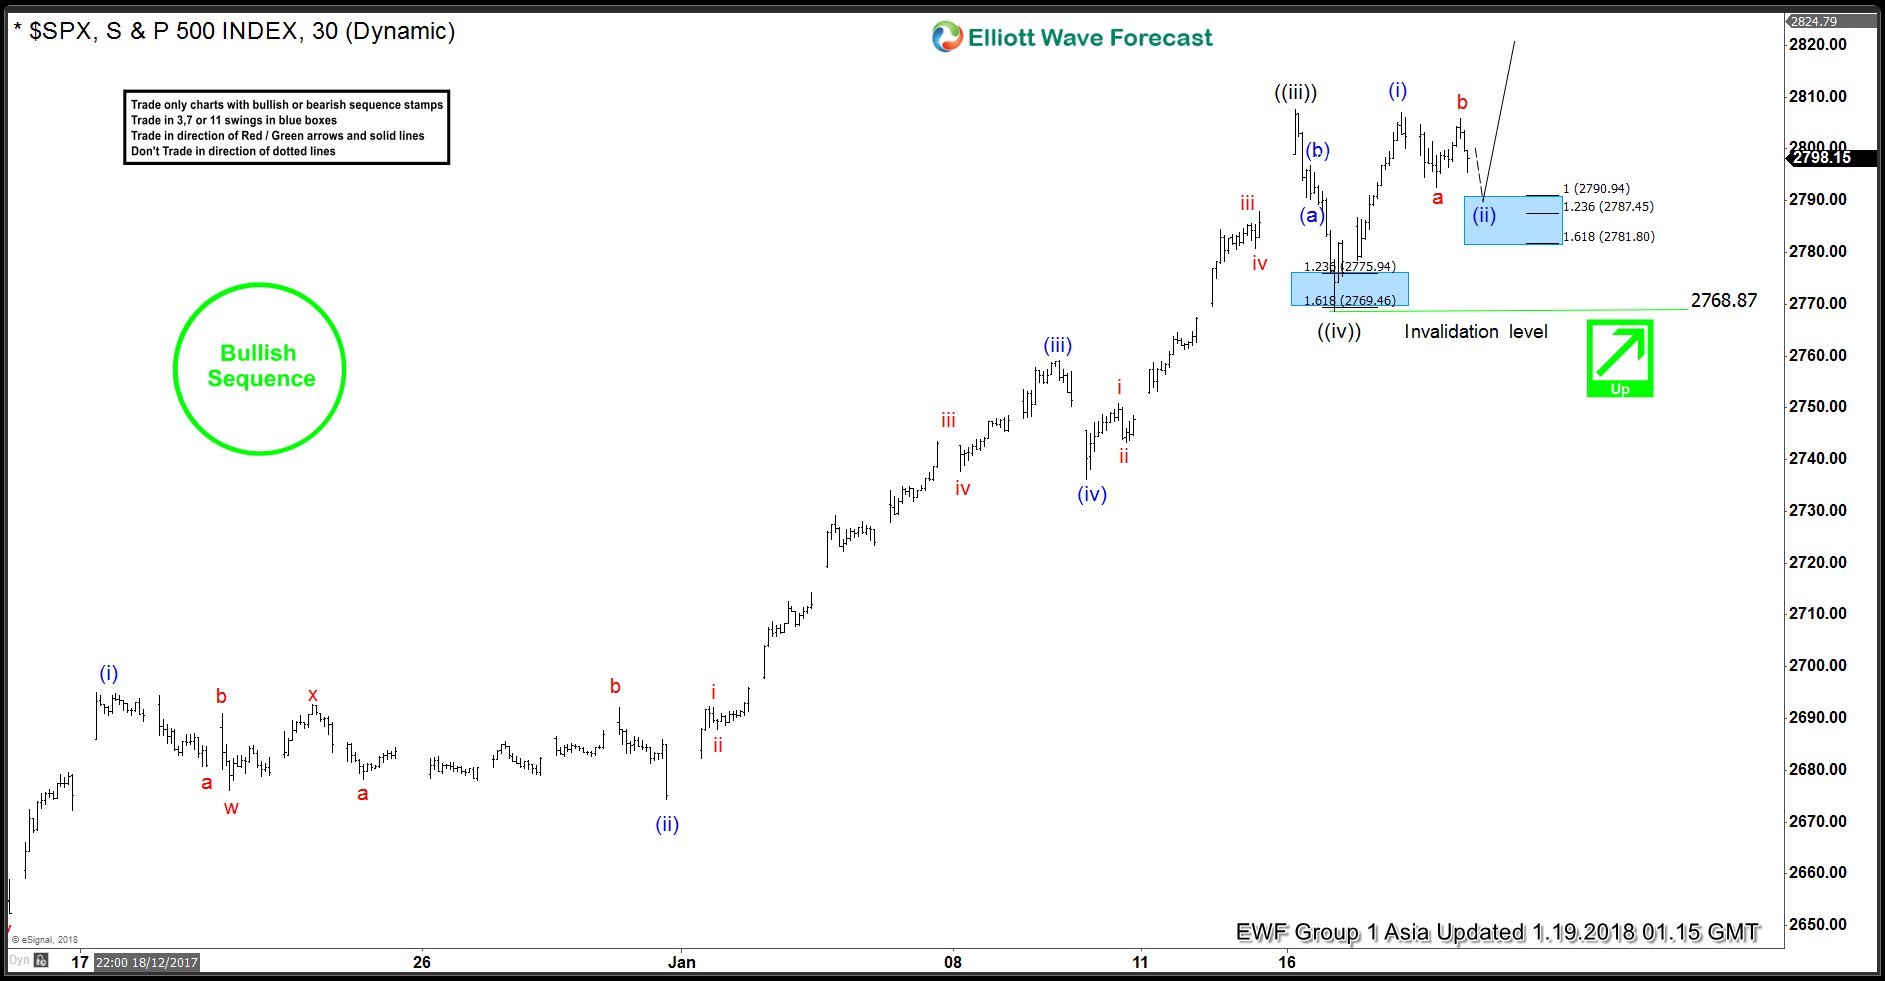
SPX Elliott Wave Analysis: More Upside Expected
Read MoreSPX Short Term Elliott Wave view suggests that Index is rallying as 5 waves impulse Elliott Wave structure from 12/2/2017 low. Up from 12/2/2017 low (2605.52), Minute wave ((i)) ended at 2665.19, Minute wave ((ii)) ended at 2624.75, Minute wave ((iii)) ended at 2807.54, and Minute wave ((iv)) ended at 2768.87. Index has since broken above Minute […]
-
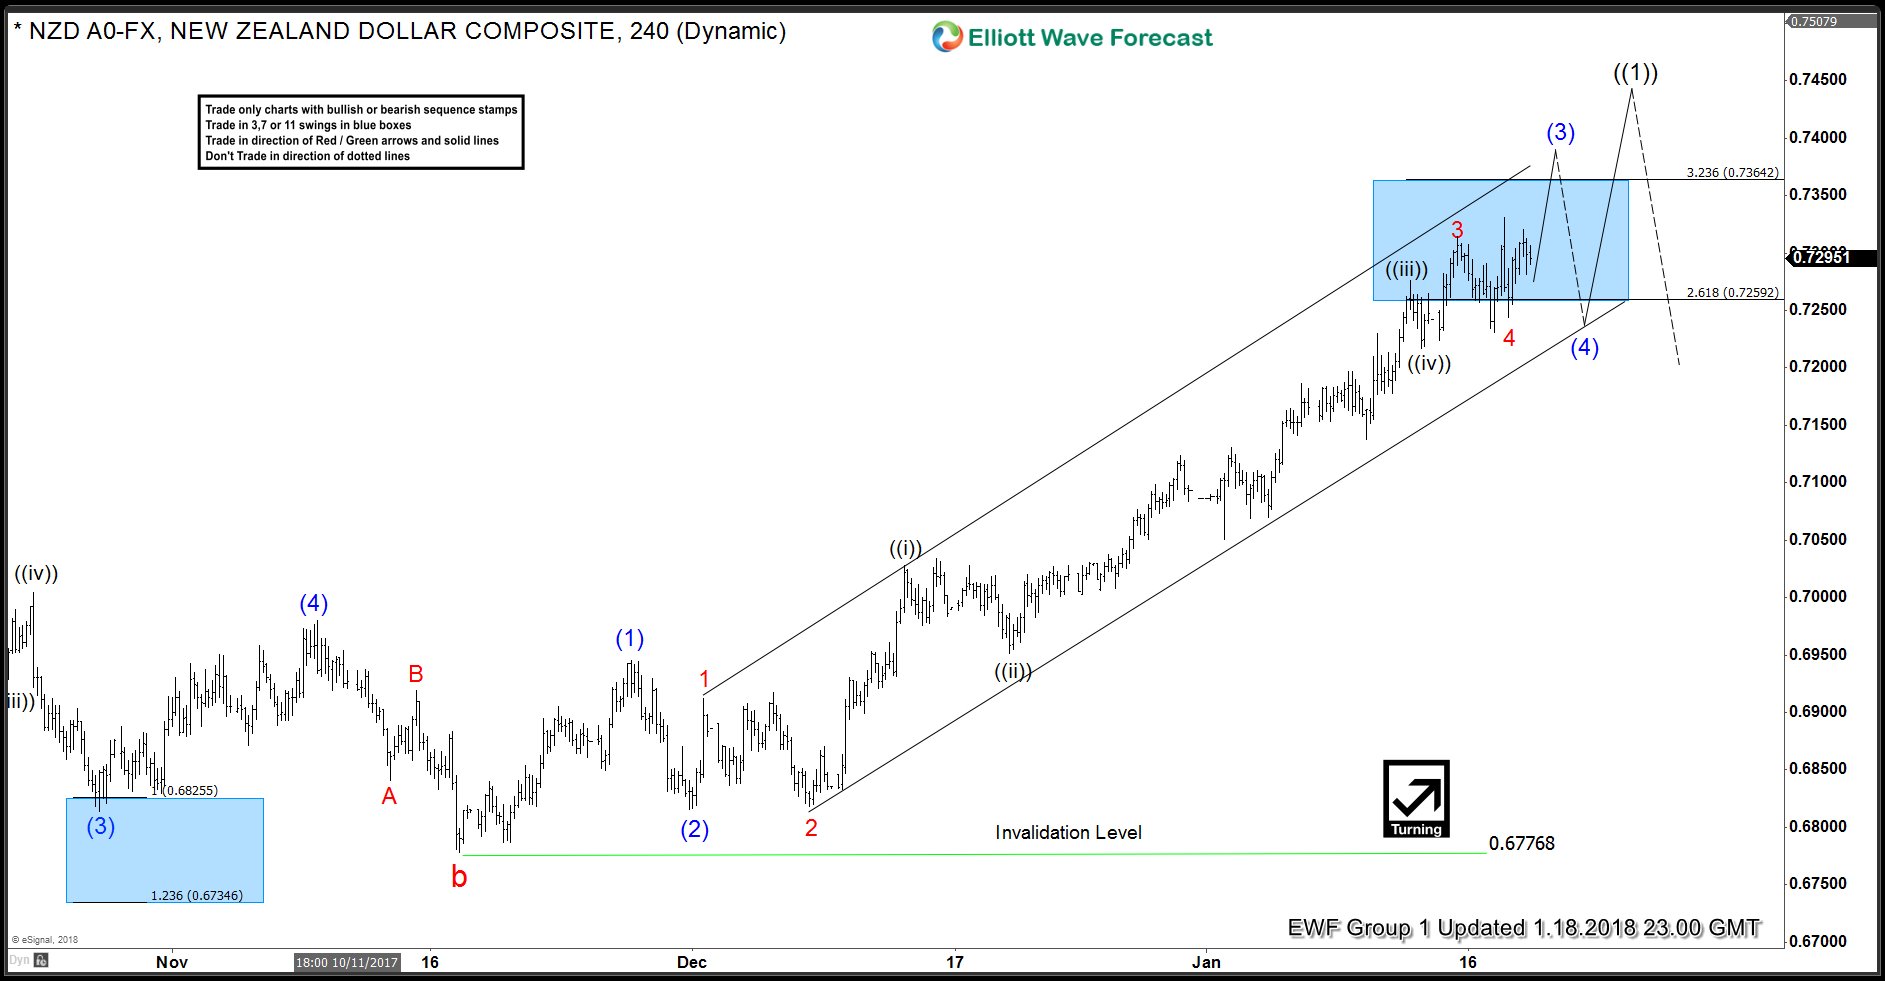
NZDUSD Impulsive Elliott Wave Advance
Read MoreNZDUSD has been in a strong up trend since 11/17/2017 (0.6776) low. Pair has gained 7.7% since then advancing from a low of 0.6776 to a high of 0.7331 before backing off a bit from the highs. Advance from 0.6776 low is unfolding as an Impulse where blue wave (1) ended at 0.6945, blue wave […]