
-
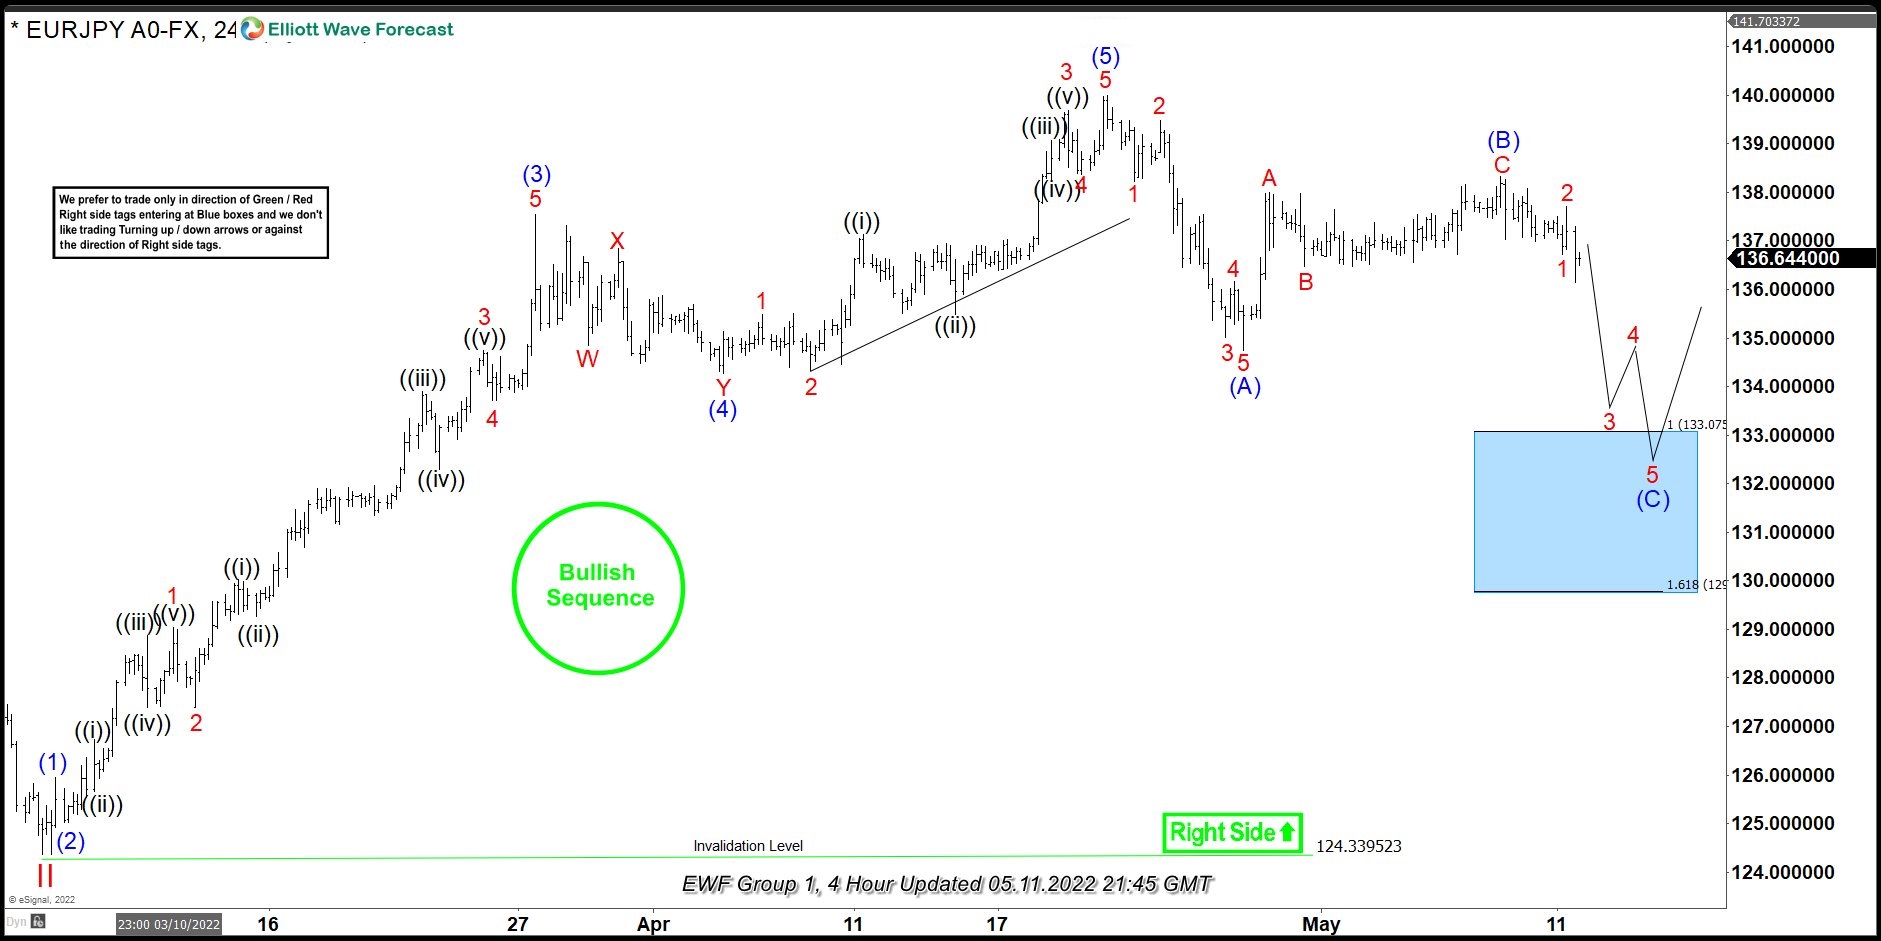
EURJPY Forecasting The Path & Buying The Dips After Zig Zag Pattern
Read MoreHello fellow traders. In this technical blog we’re going to take a quick look at the Elliott Wave charts of EURJPY , published in members area of the website. As our members know, we’ve been favoring the long side in EURJPY due to incomplete bullish sequences the pair is showing in the cycles from the […]
-
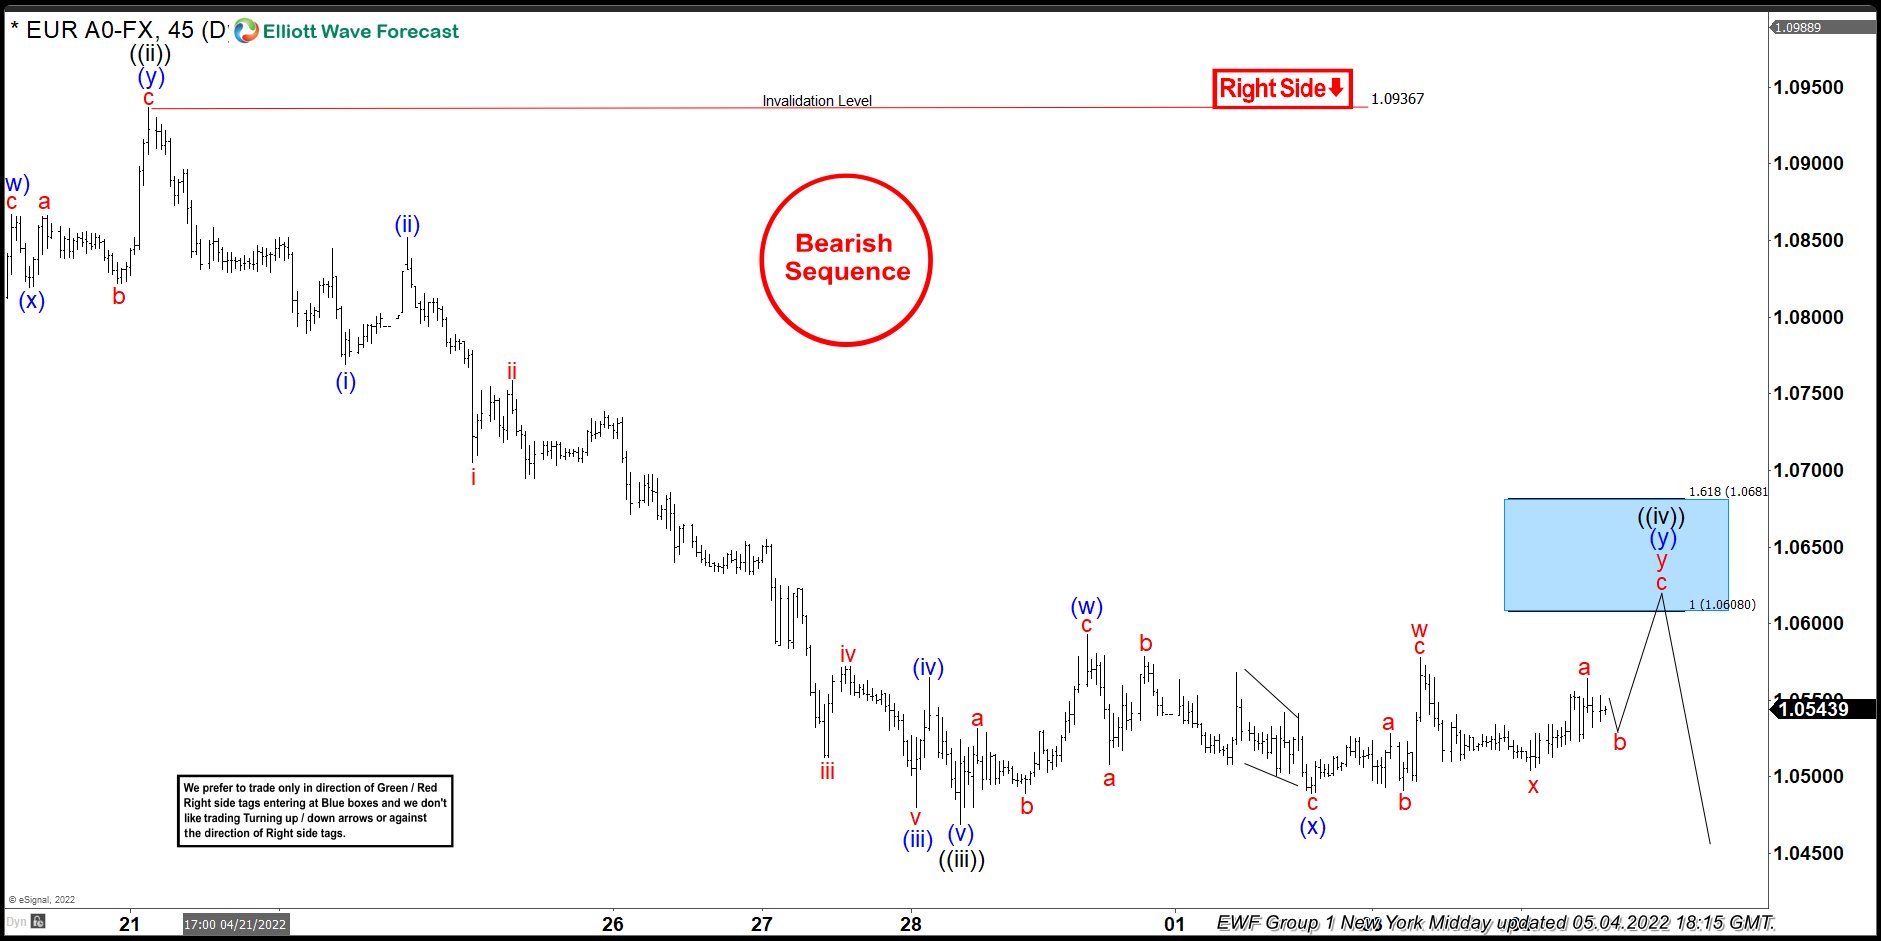
EURUSD Forecasting The Decline & Selling The Blue Box
Read MoreHello fellow traders. Another instrument that we have been trading lately is $EURUSD. In this technical blog we’re going to take a quick look at the Elliott Wave charts of EURUSD and explain the trading strategy. As our members know, EURUSD has been showing incomplete bearish sequences. Recently he pair has made 3 waves bounce […]
-
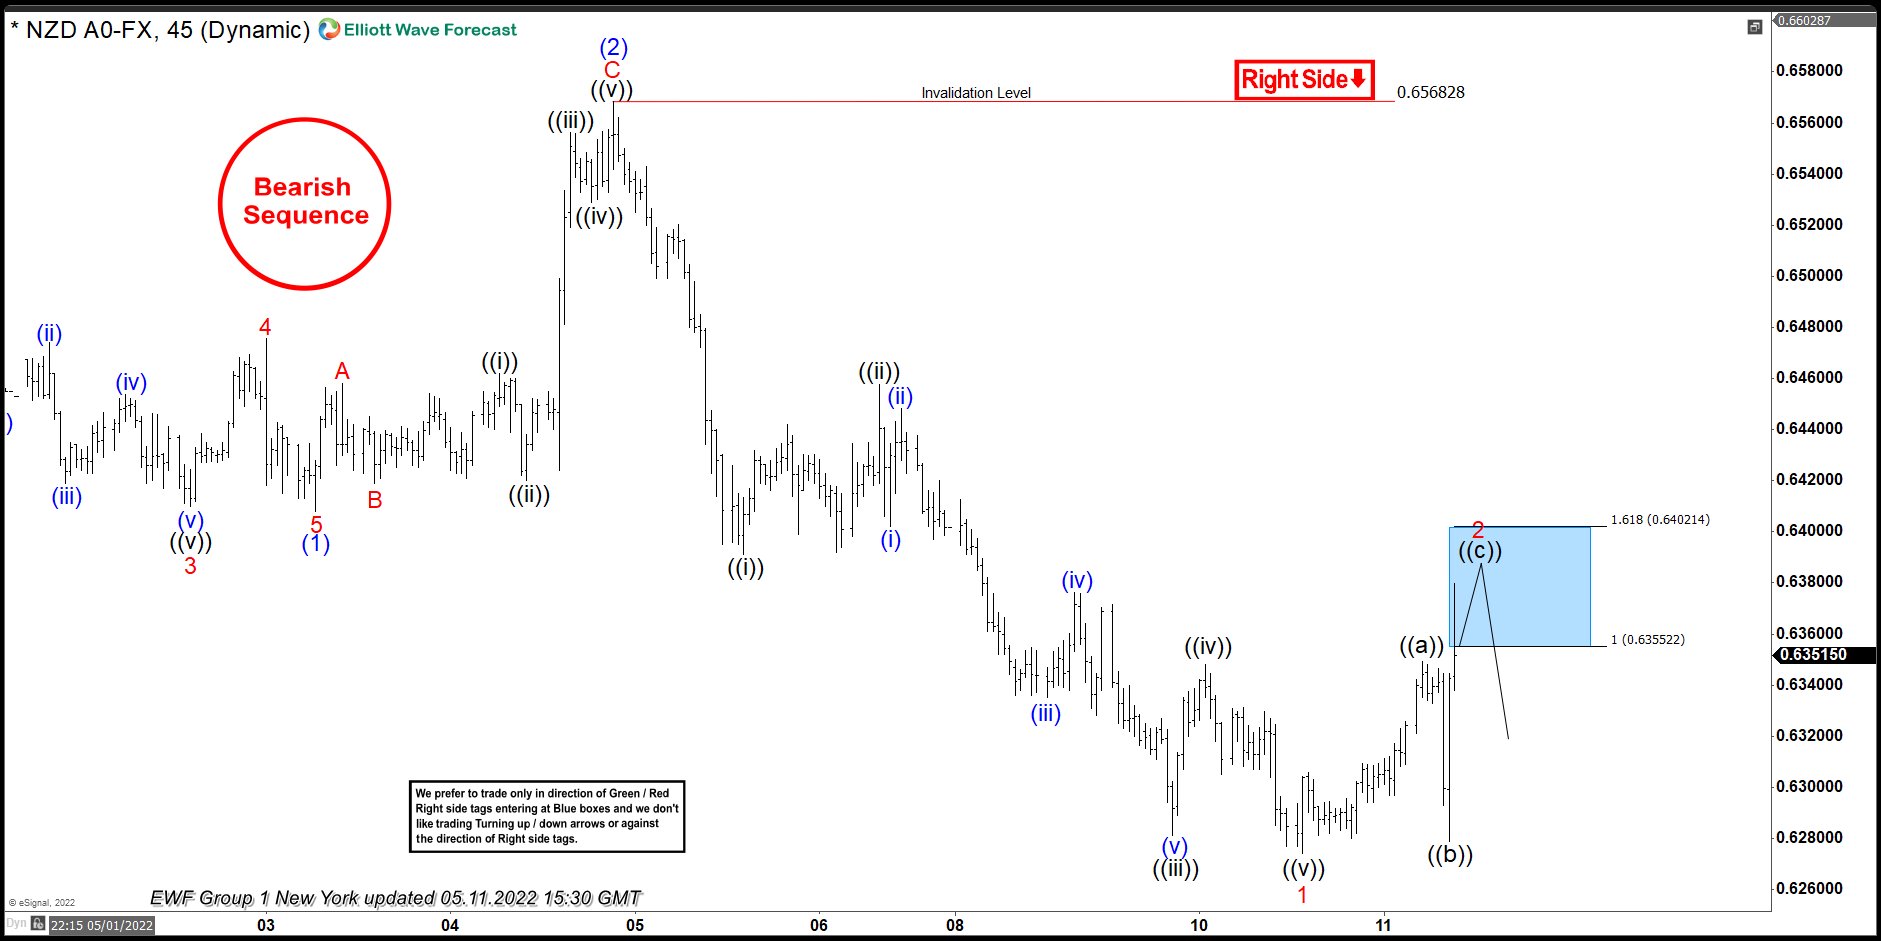
NZDUSD Selling The Rallies At The Blue Box Area
Read MoreIn this technical blog we’re going to take a quick look at the Elliott Wave charts of NZDUSD forex pair. As our members know, the pair shows bearish sequences in the cycle from the February 2021 peak. The pair has made 3 waves bounce recently, that has reached our selling zone and gave us good trading […]
-
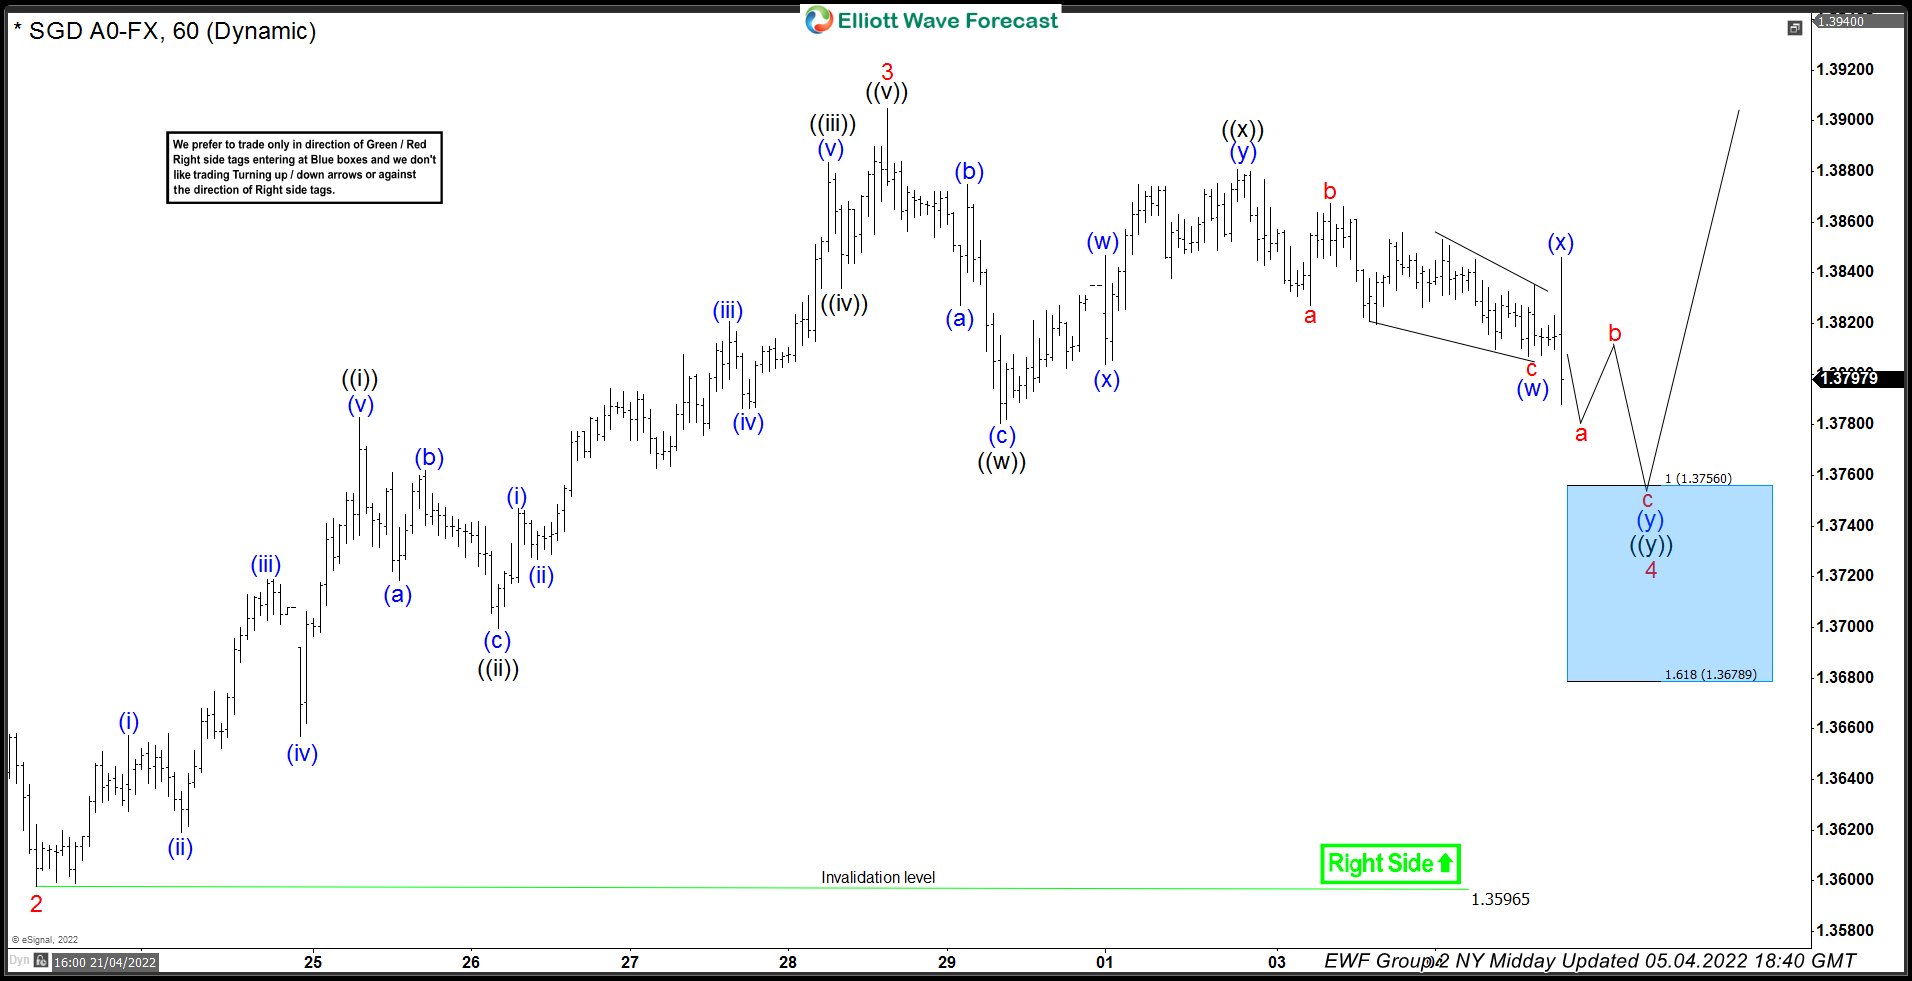
USDSGD Elliott Wave : Buying The Dips At the Blue Box Area
Read MoreUSDSGD is another instrument that has given us trading opportunity lately . Break of November 2021 peak made bullish sequence in the cycle from the January 2021 low. The price structure is suggesting further rally within that cycle. We recommended members to avoid selling the pair at this stage while favoring the long side. Recently […]
-
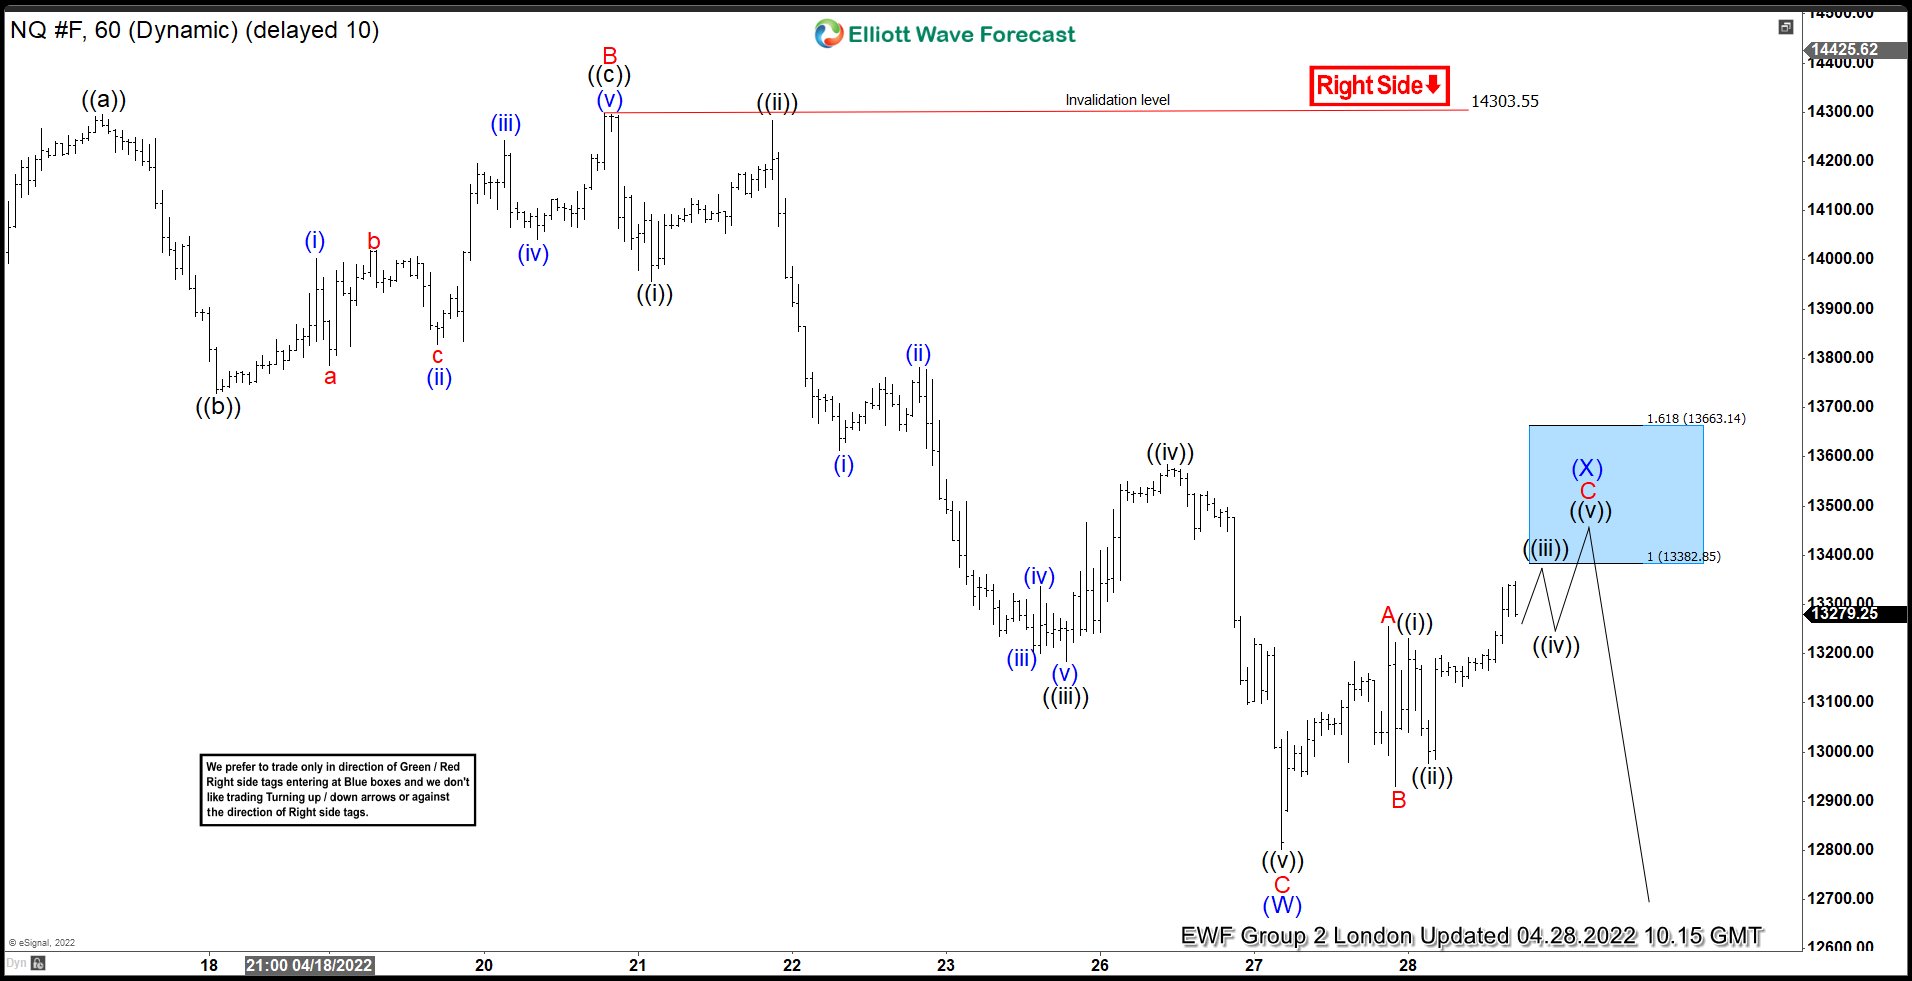
Nasdaq ( NQ_F ) Forecasting The Decline & Selling The Rallies At The Blue Box
Read MoreHello fellow traders. In this technical blog we’re going to take a quick look at the Elliott Wave charts of Nasdaq. As our members know, the Index shows bearish sequences in the cycle from the November 22. 2021 peak. Incomplete structure calls for a further decline, targeting 12181.4 area. Nasdaq has made 3 waves bounce recently, […]
-
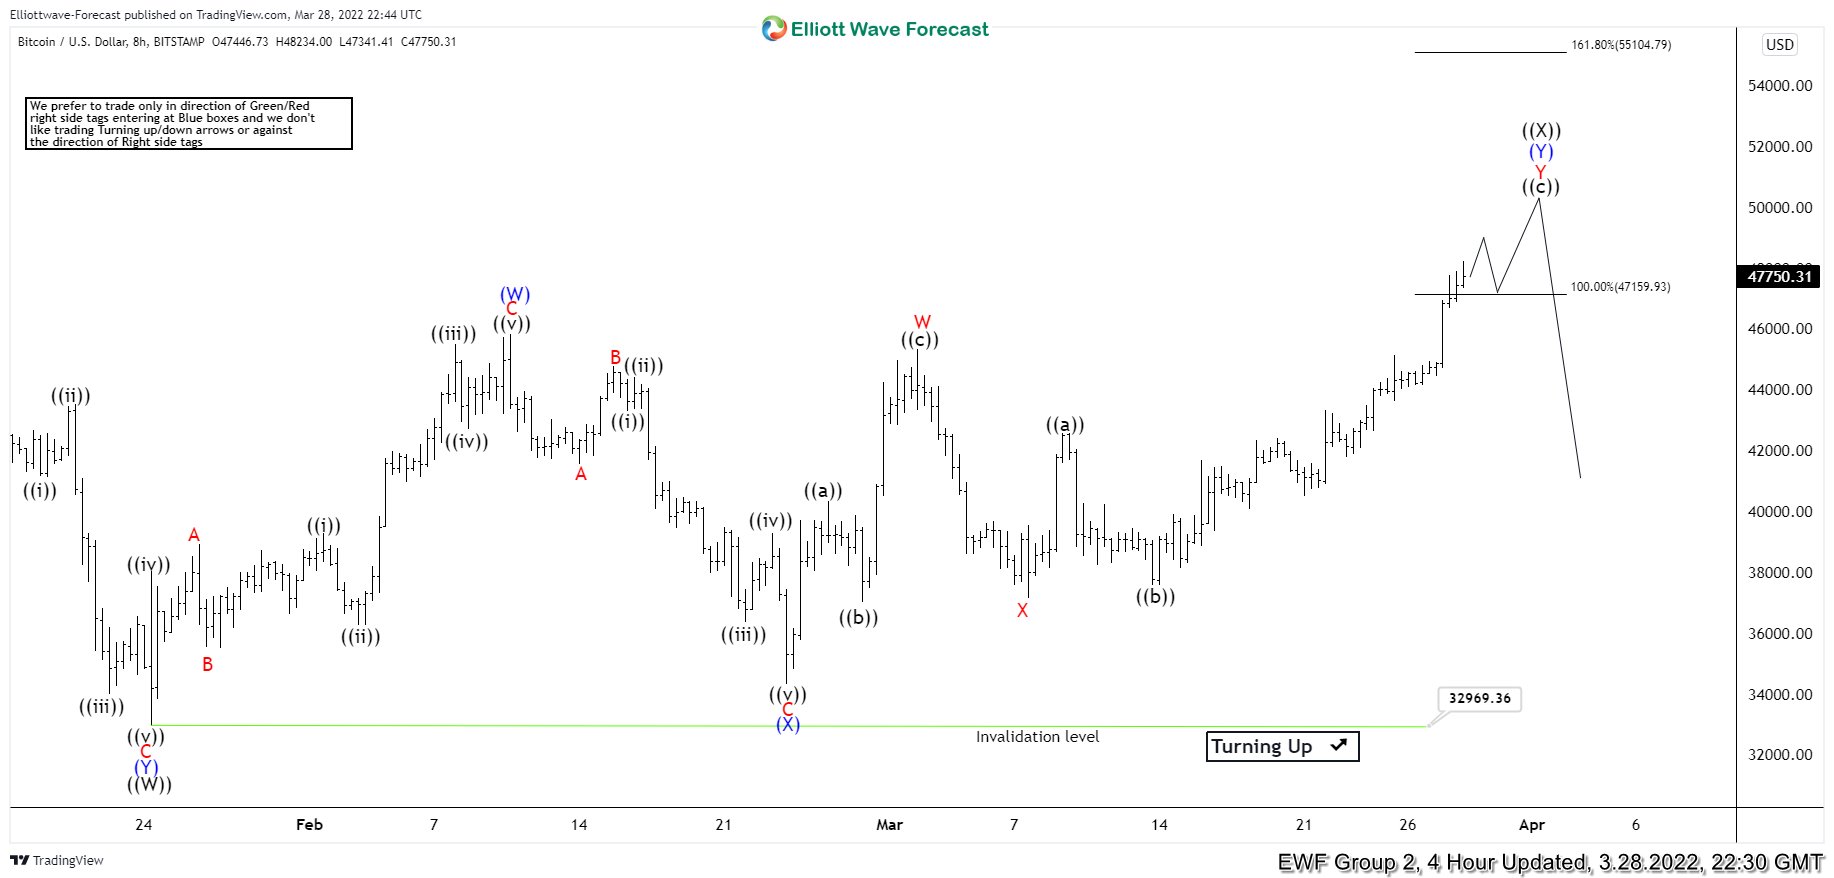
Bitcoin ( BTCUSD ) Forecasting The Decline After Elliott Wave Double Three Pattern
Read MoreHello fellow traders. In this technical article we’re going to take a look at the Elliott Wave charts charts of BTCUSD published in members area of the website. Recently Bitcoin made recovery against the 69097.5 peak that has unfolded as Elliott Wave Double Three Pattern. It made clear 7 swings from the lows and complete […]