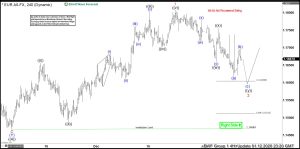
Hello fellow traders. In this technical article we’re going to look at the Elliott Wave charts of EURUSD forex pair published in members area of the website. The pair has...
Read More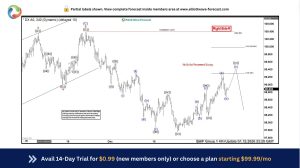
Hello fellow traders. In this technical article we’re going to look at the Elliott Wave charts of Dollar index DXY published in members area of the website. US Dollar...
Read More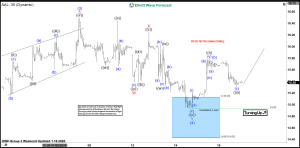
Hello fellow traders, As our members know we have had many profitable trading setups recently. In this technical article, we are going to present another Elliott Wave trading...
Read More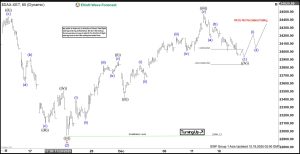
Hello fellow traders. In this article we’re going to take a quick look at the Elliott Wave charts of DAX index , published in the members area of...
Read More
Hello fellow traders, As our members know we have had many profitable trading setups recently. In this technical article, we are going to present another Elliott Wave trading...
Read More
As our members know we have had many profitable trading setups recently. In this technical article, we are going to talk about another Elliott Wave trading setup we...
Read More