
-
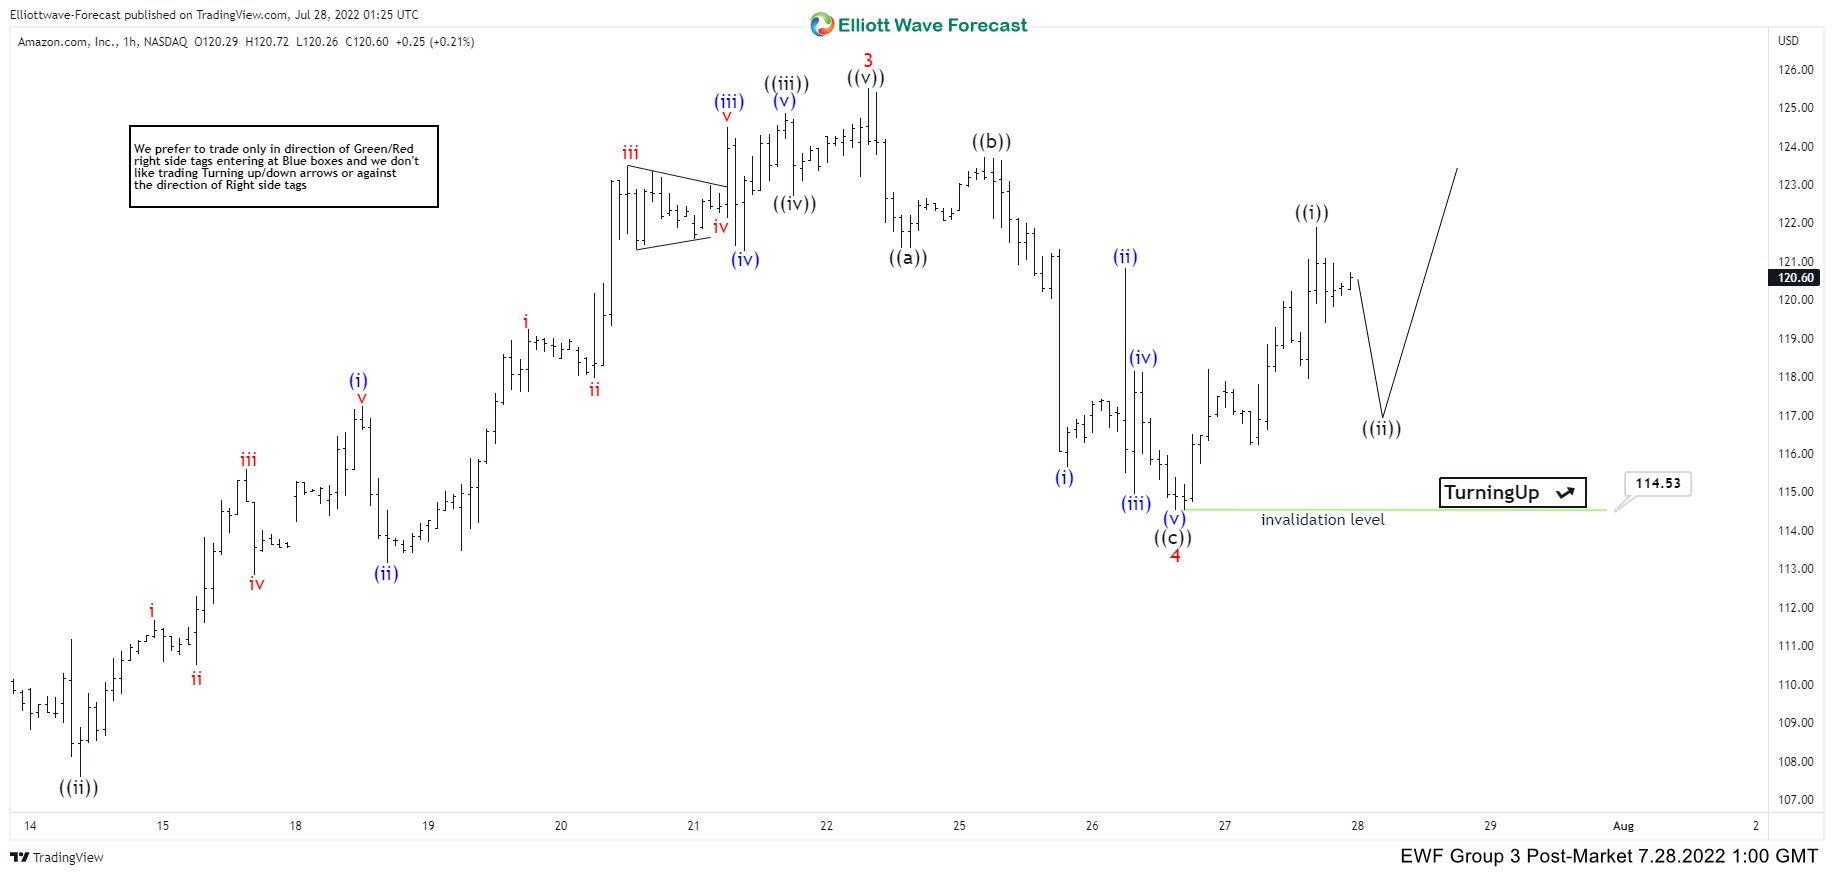
Amazon (AMZN) Elliott Wave : Impulsive Sequences Calling The Rally
Read MoreHello fellow traders. In this technical article we’re going to take a quick look at the Elliott Wave charts of Amazon stock. We have been calling for the rally in the stock due to impulsive bullish sequences in the cycles from the June lows. Consequently, we recommended members to avoid selling the stock, while keep […]
-
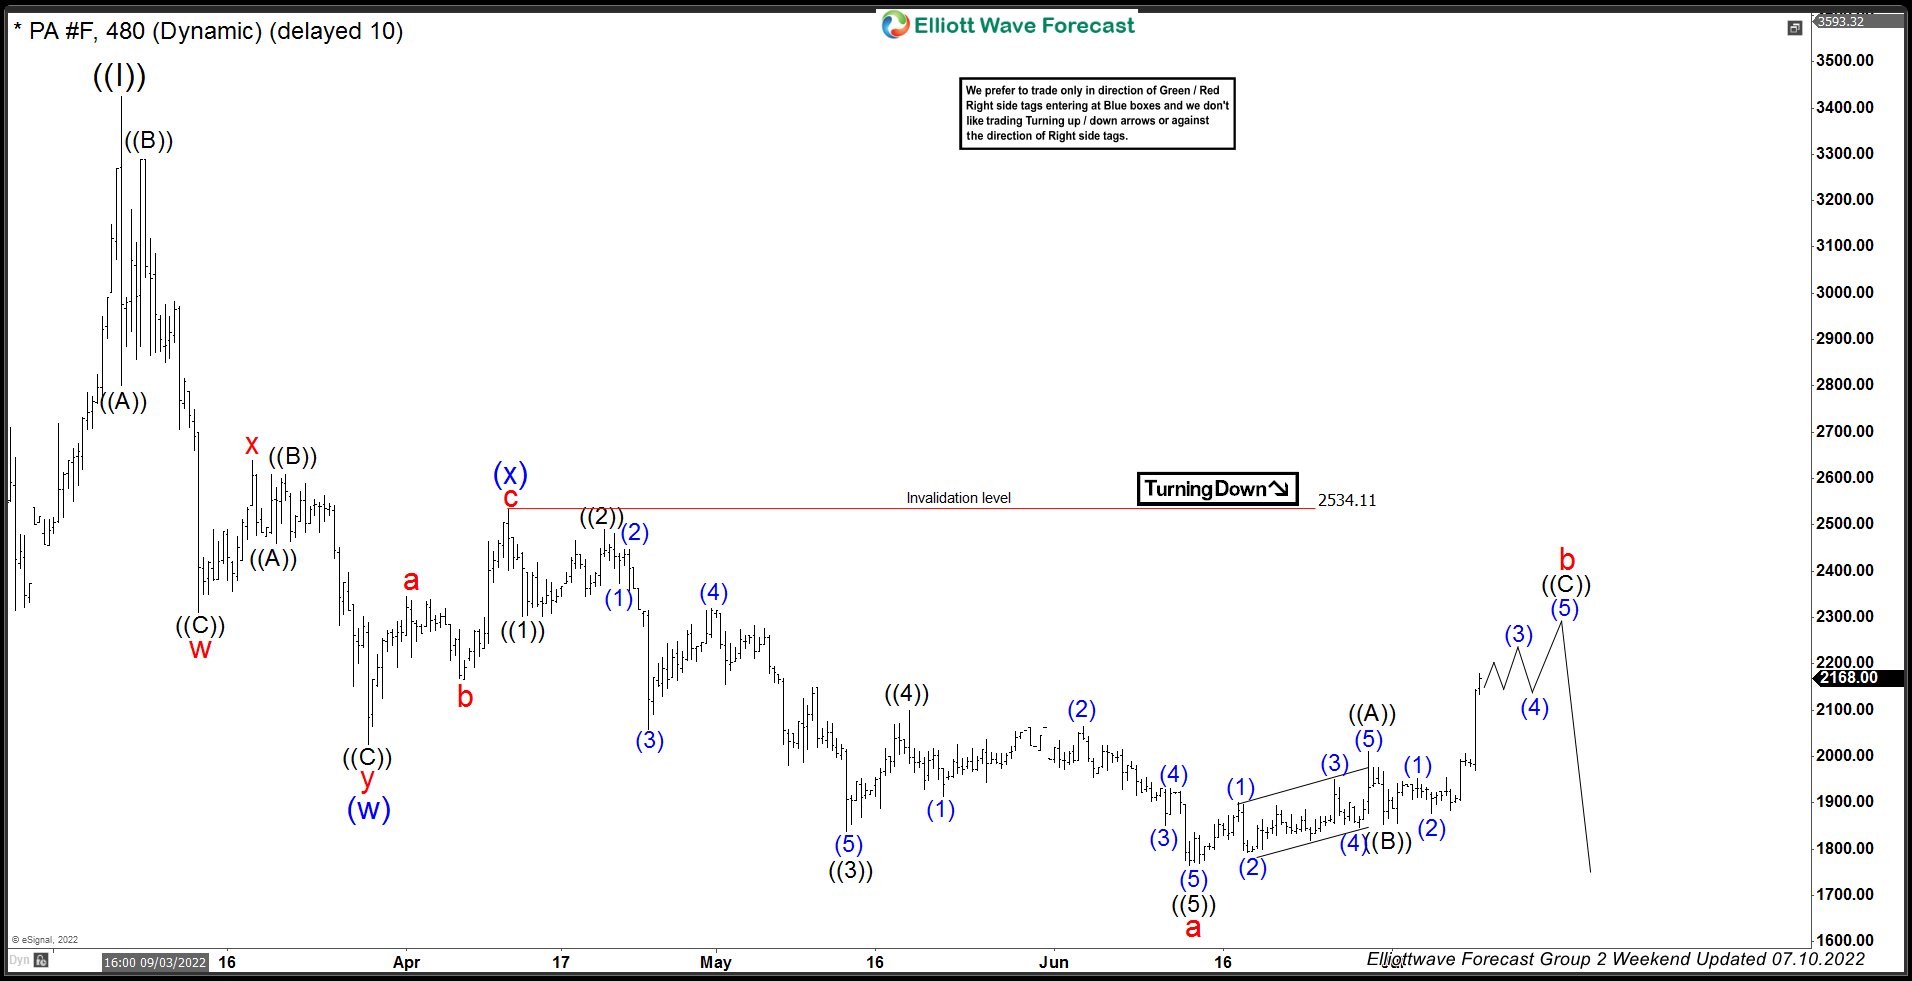
Palladium ( $PA_F ) Forecasting The Decline After Elliott Wave Zig Zag
Read MoreHello fellow traders. In this technical blog we’re going to take a quick look at the Elliott Wave charts of Palladium ( $PA_F ) . As our members know, Palladium is showing incomplete bearish sequences in the cycle from the March peak (3425). Recently the commodity has given us 3 waves bounce against the 2354 […]
-
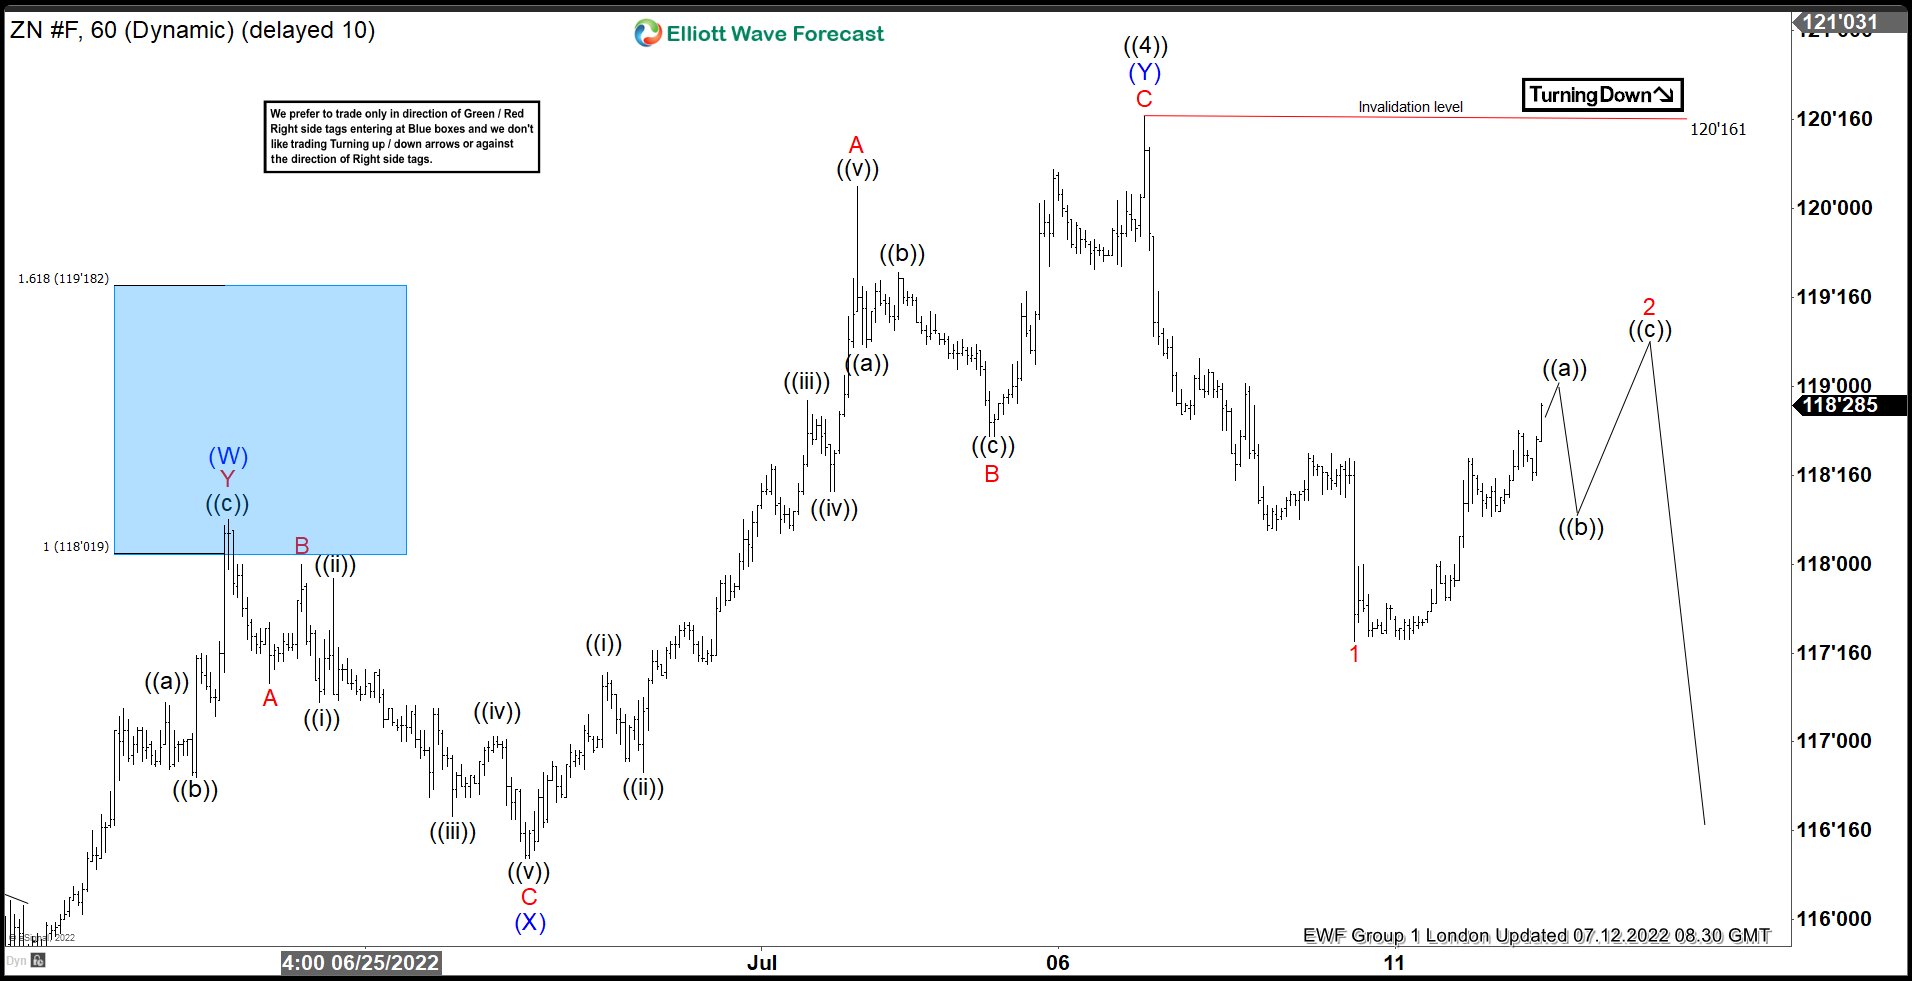
10 Year Note (ZN_F) Elliott Wave Forecasting The Path
Read MoreHello fellow traders. In this technical blog we’re going to take a quick look at the Elliott Wave charts of 10 Year Note. As our members know, ZN_F has been giving us good trading opportunities recently. We have explained trading setup in our previous technical article on 10 Year Note. In this blog we are […]
-
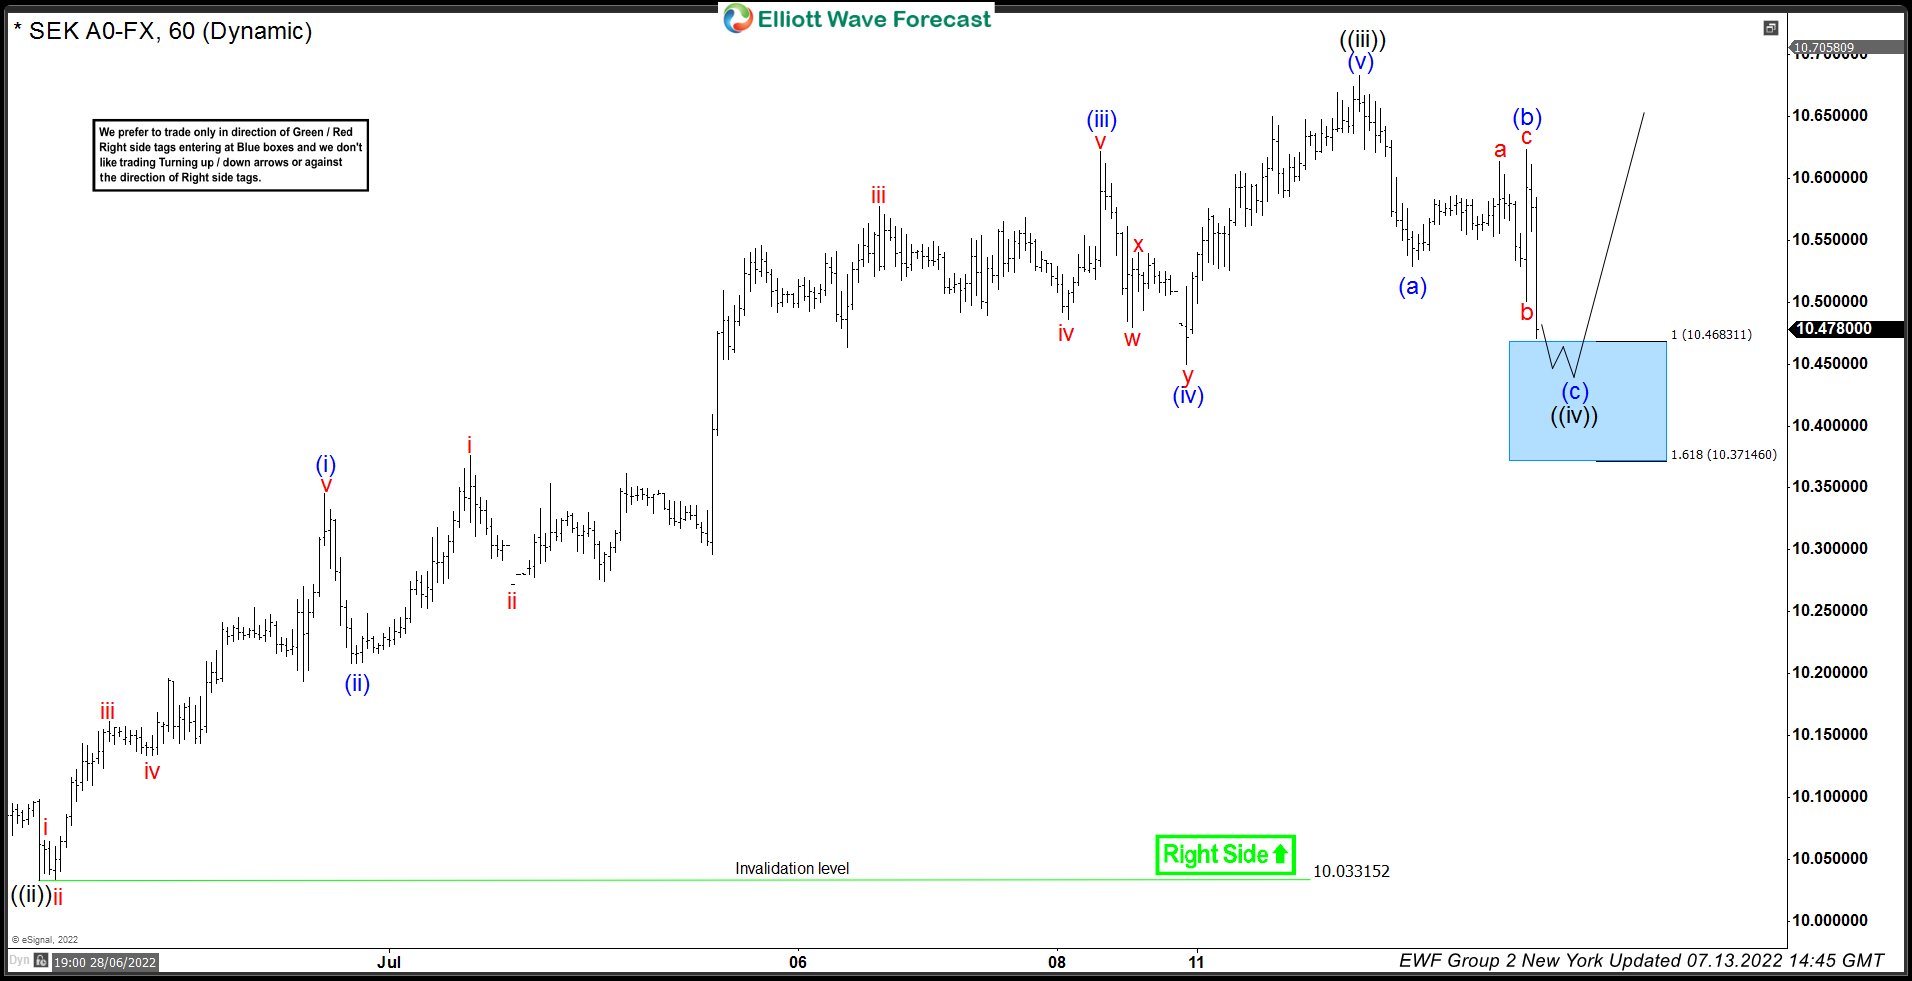
USDSEK Showing Reaction From Intraday Buying Zone
Read MoreIn this technical article we’re going to take a quick look at the Elliott Wave charts of USDSEK, another forex pair we have traded in EWF. As our members know we have been calling for the rally in the pair due to impulsive bullish sequences. Consequently, we recommended members to avoid selling the pair, while […]
-
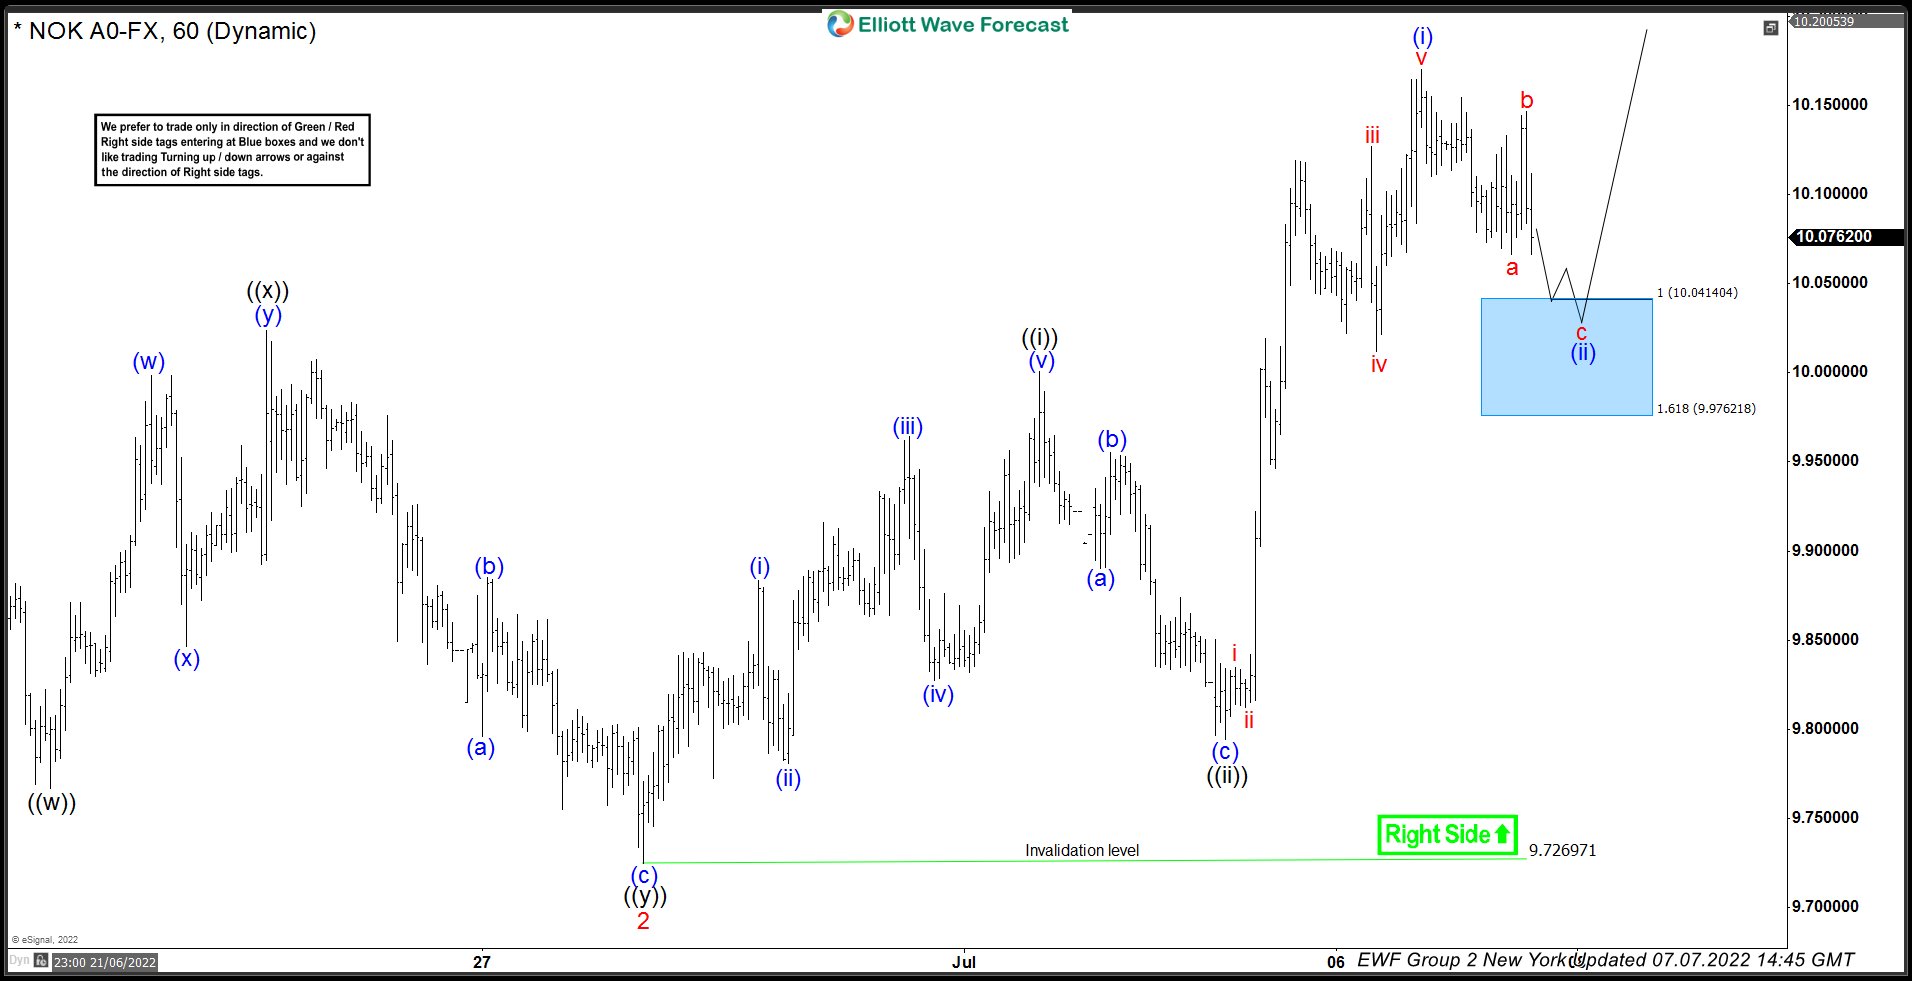
USDNOK Buying The Dips At The Blue Box
Read MoreHello fellow traders. In this article we’re going to take a quick look at the Elliott Wave charts of USDNOK, published in members area of the website. We have favoring the long side due to impulsive bullish sequences the pair is showing in the cycle from the 9.33 low. Consequently, we recommended members to avoid […]
-
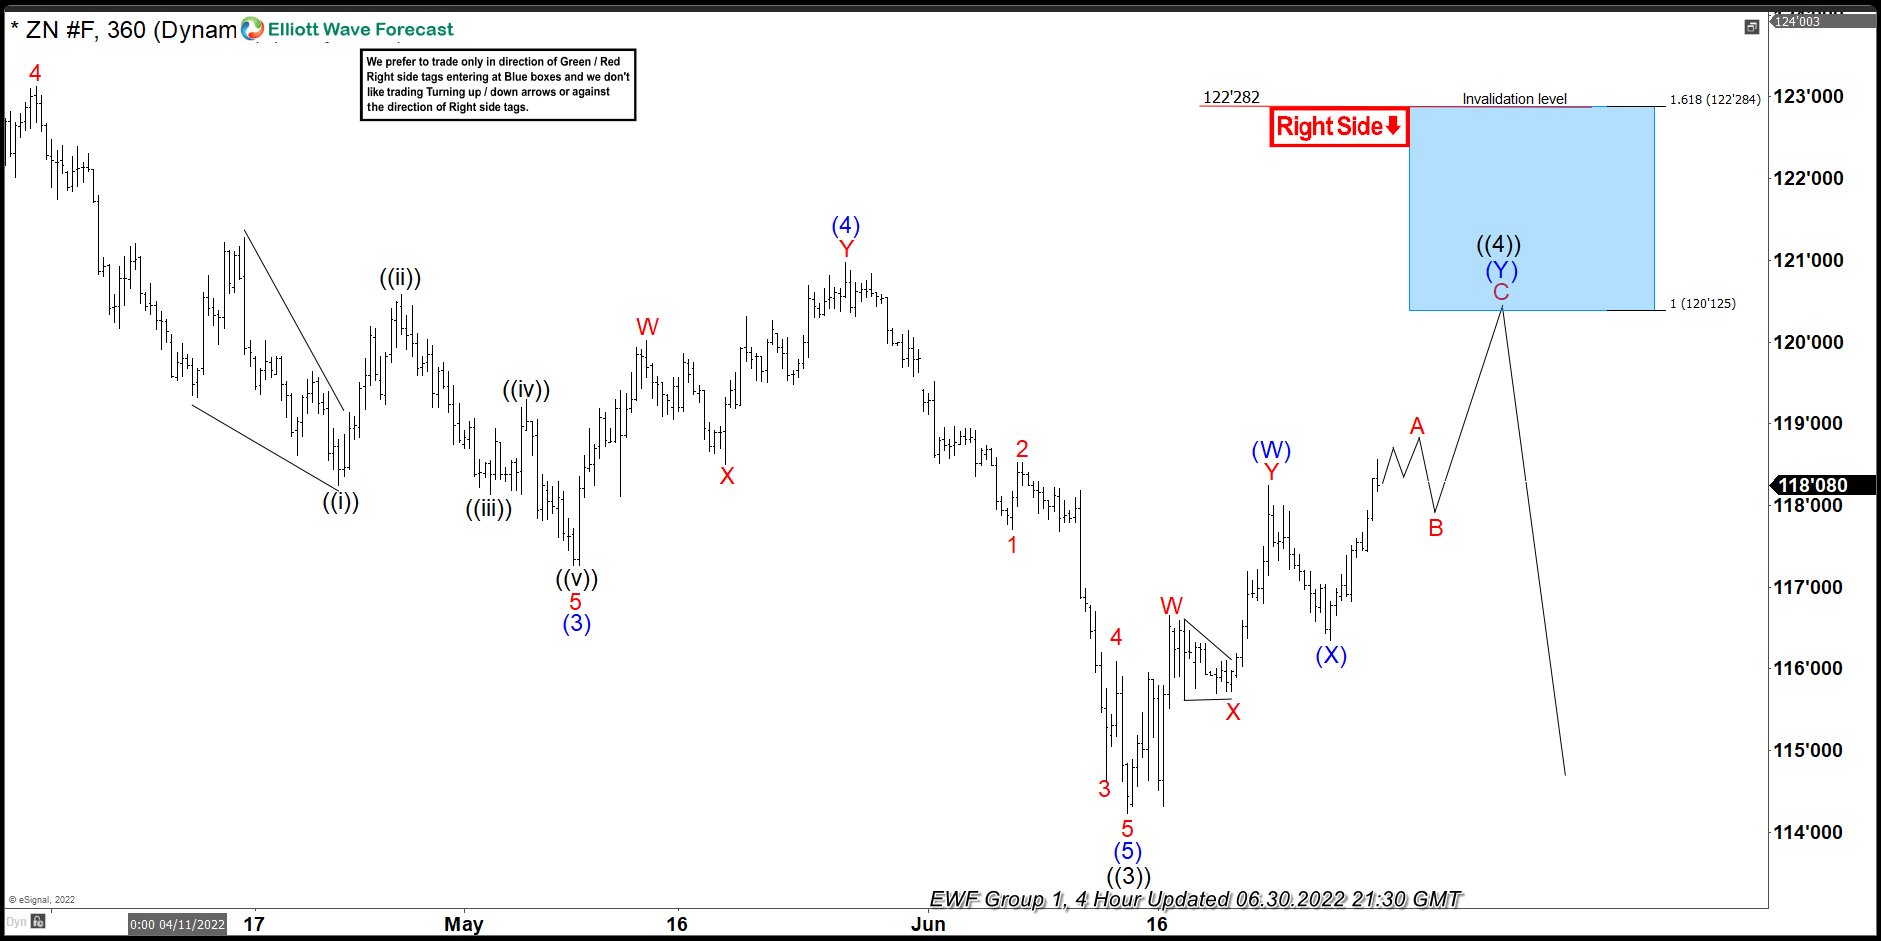
10 Year Note (ZN_F) Forecasting The Path & Selling The Rallies
Read MoreHello fellow traders. Another instrument that we have been trading lately is ZN_F. In this technical blog we’re going to take a quick look at the Elliott Wave charts of 10 Year Note and explain the trading strategy. As our members know, ZN_F has been giving us good trading opportunities recently. We recommended members to […]