
-
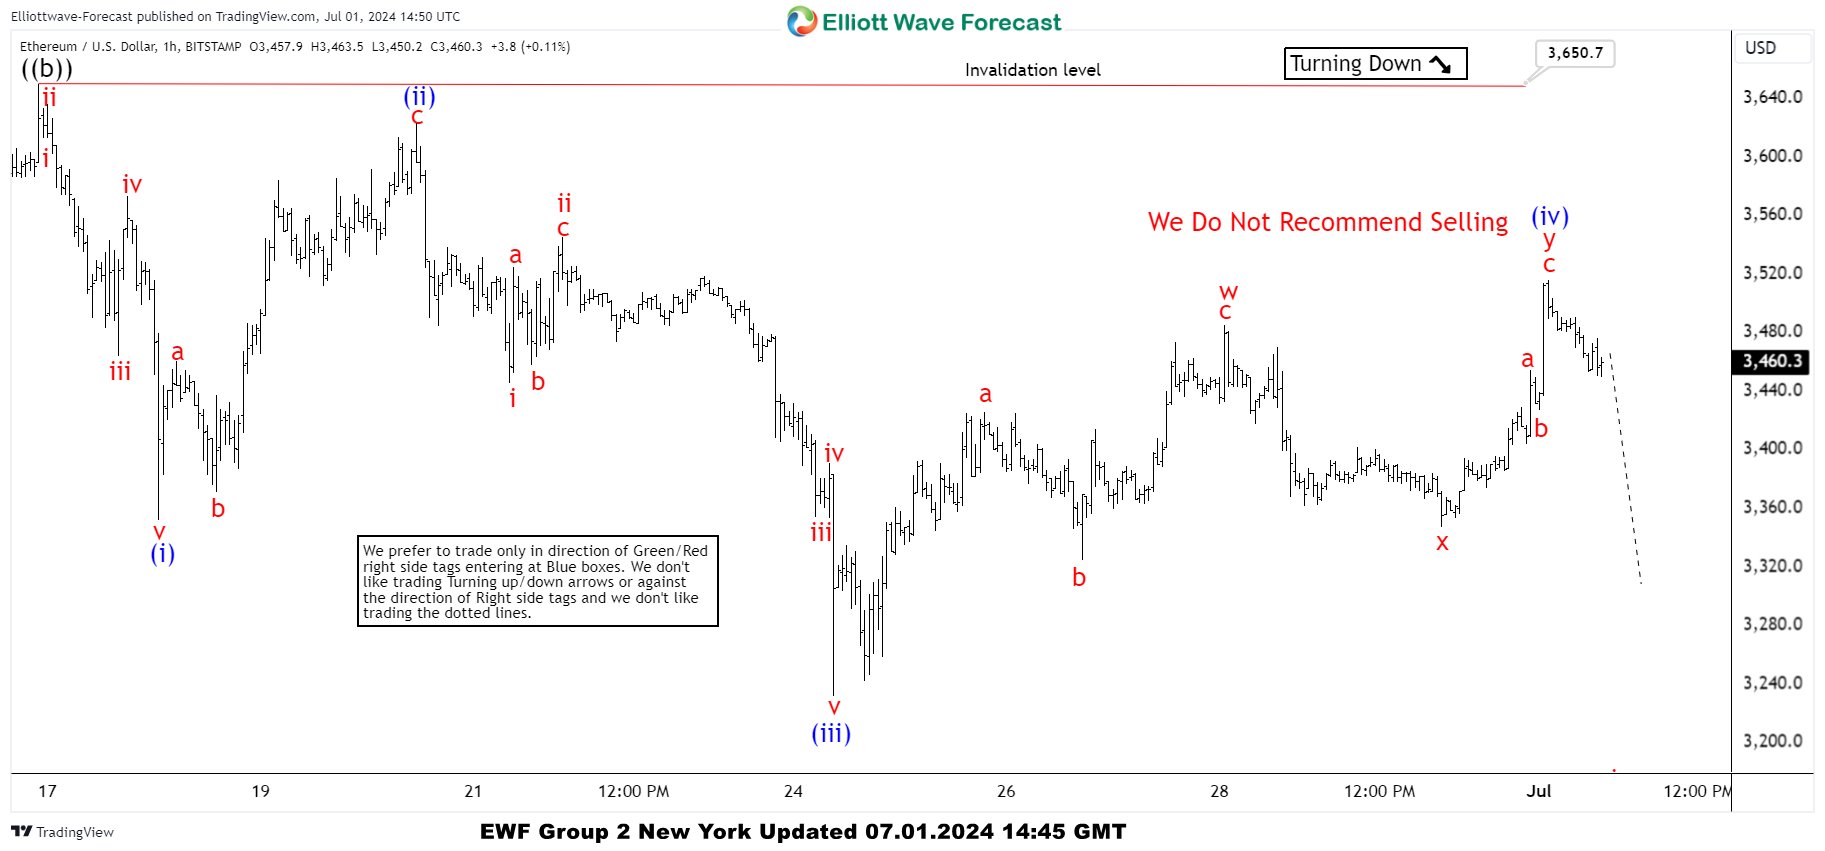
Ethereum (ETHUSD) Incomplete Sequences Calling the Decline
Read MoreHello fellow traders. In this technical blog we’re going to take a quick look at the Elliott Wave charts of Ethereum (ETHUSD). As our members know, ETHUSD is showing incomplete sequences in the cycle from the 3977 peak. We have been predicting a price decline. Recently, we got a bounce against the 3650 peak , […]
-
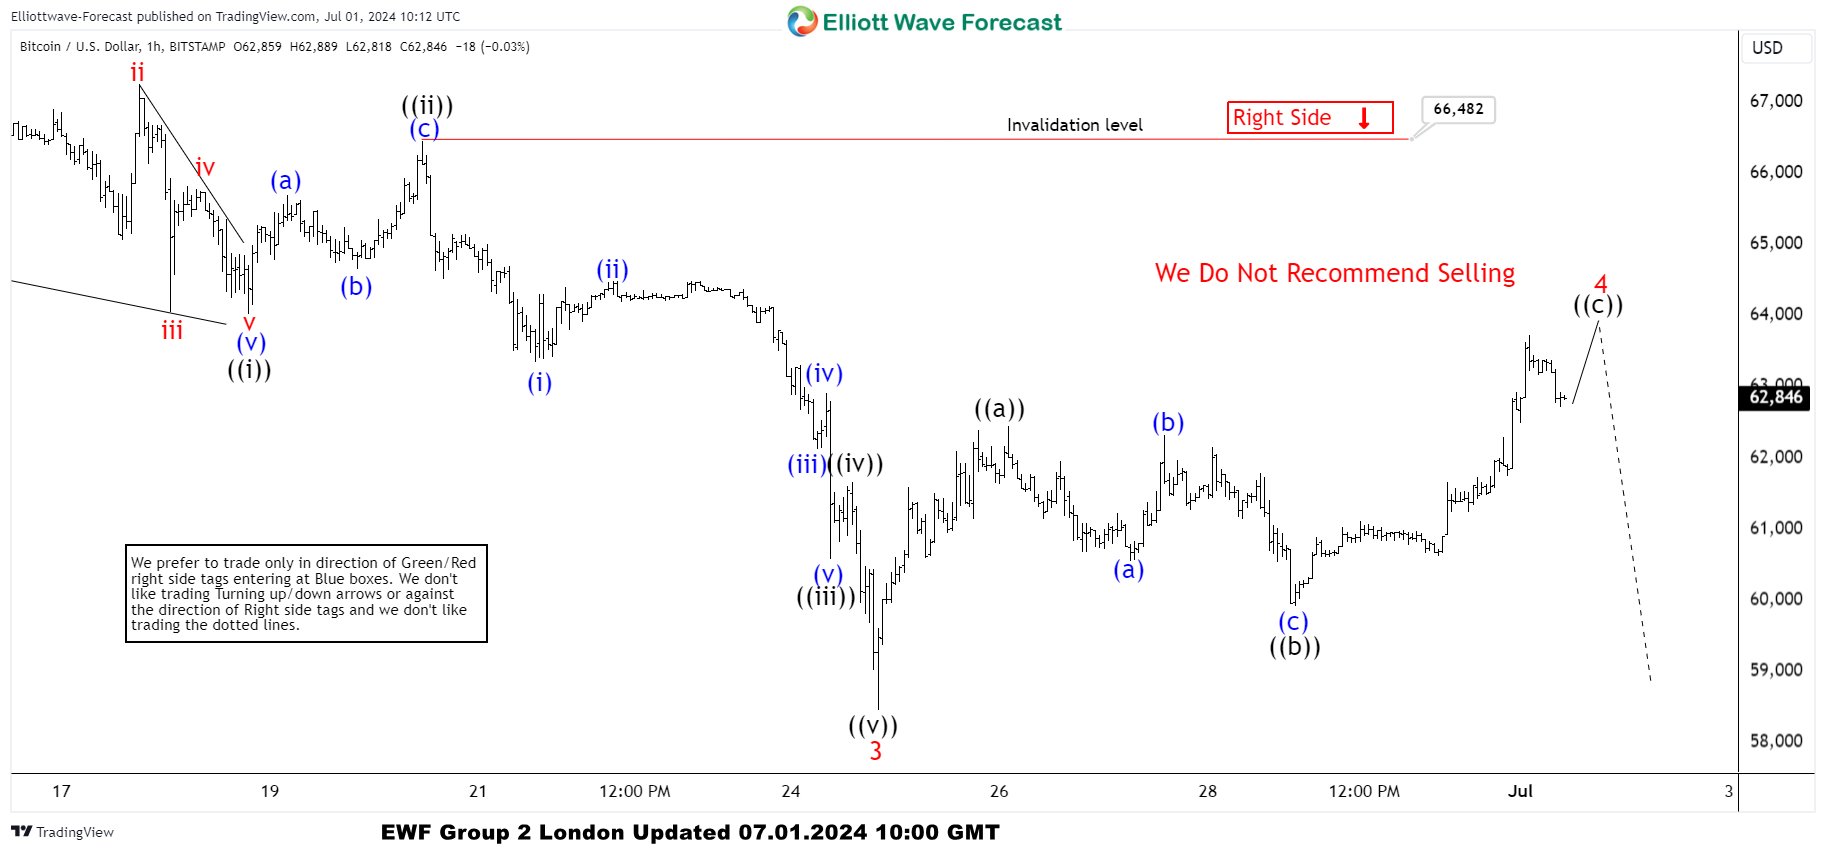
Bitcoin (BTCUSD) Found Sellers After Elliott Wave Zig Zag Pattern
Read MoreHello fellow traders. In this technical blog we’re going to take a quick look at the Elliott Wave charts of Bitcoin ( BTCUSD). As our members know, Bitcoin is correcting the cycle from the 25068 low, and we have been predicting a price decline. Recently, we observed a bounce against the June 7th peak. This […]
-
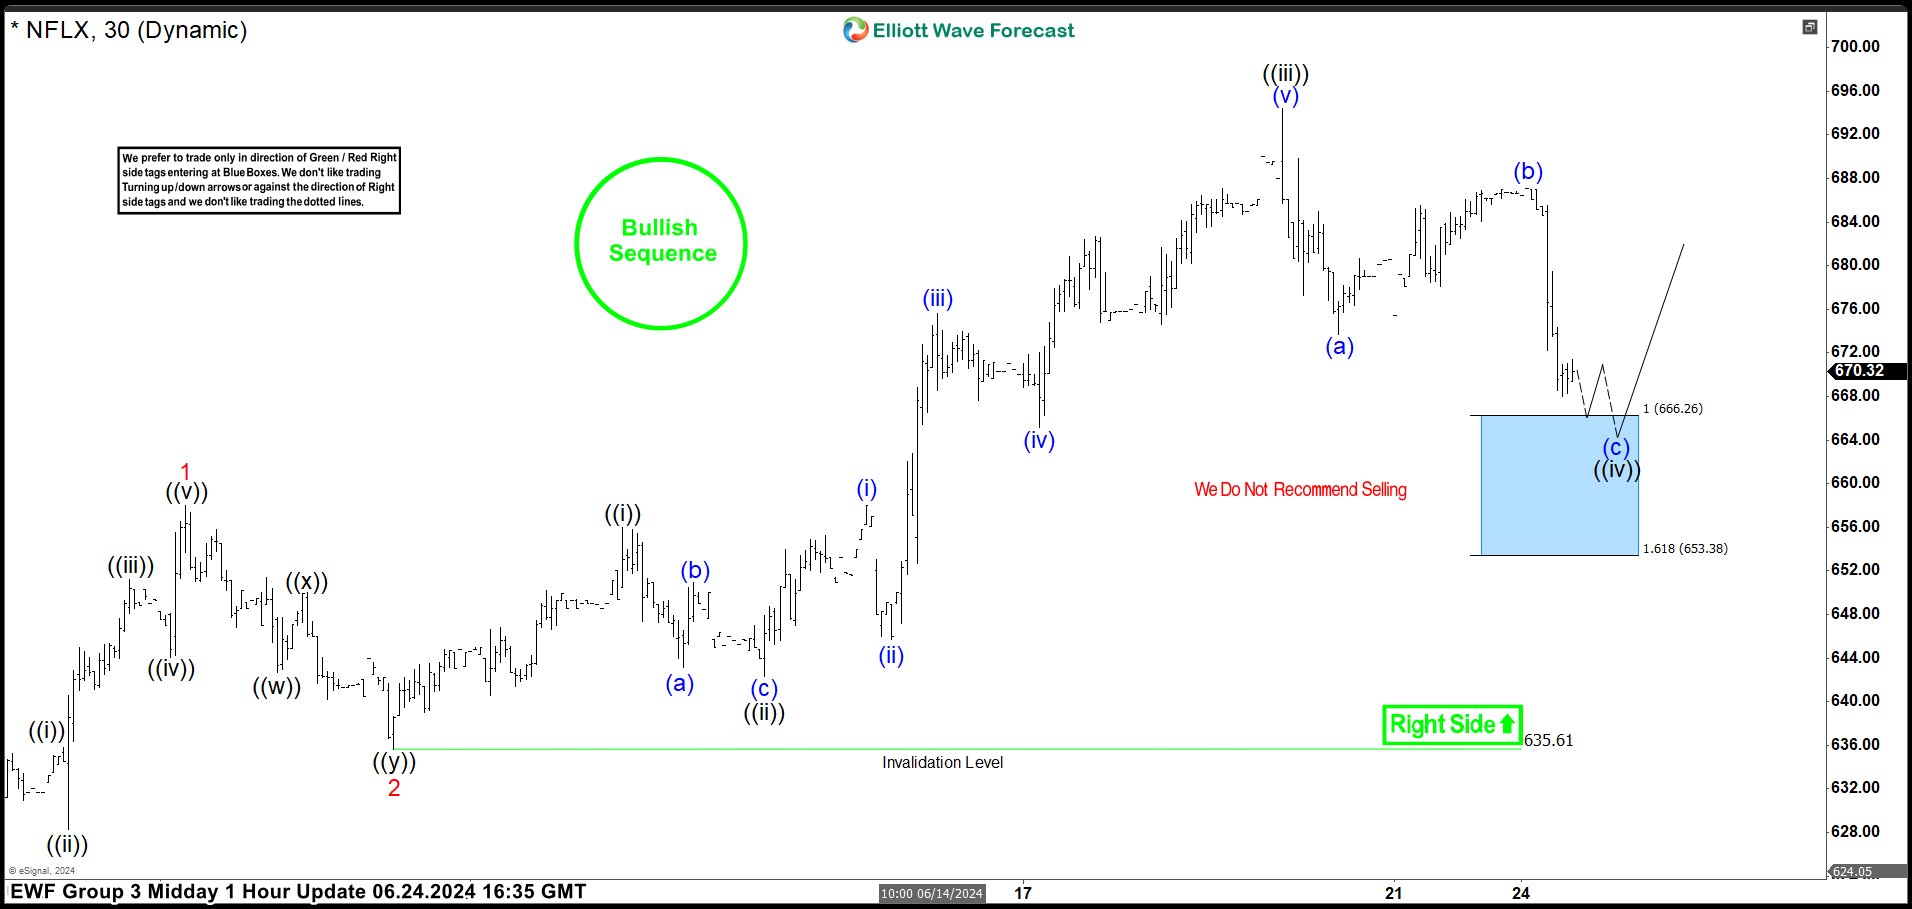
Netflix Stock (NFLX) Buying the Dips at the Blue Box Area
Read MoreHello fellow traders. In this technical article we’re going to take a look at the Elliott Wave charts charts of Netflix (NFLX) Stock published in members area of the website. Our members are aware of the numerous positive trading setups we’ve had among stocks and indices recently. One of them is NFLX, which made a […]
-
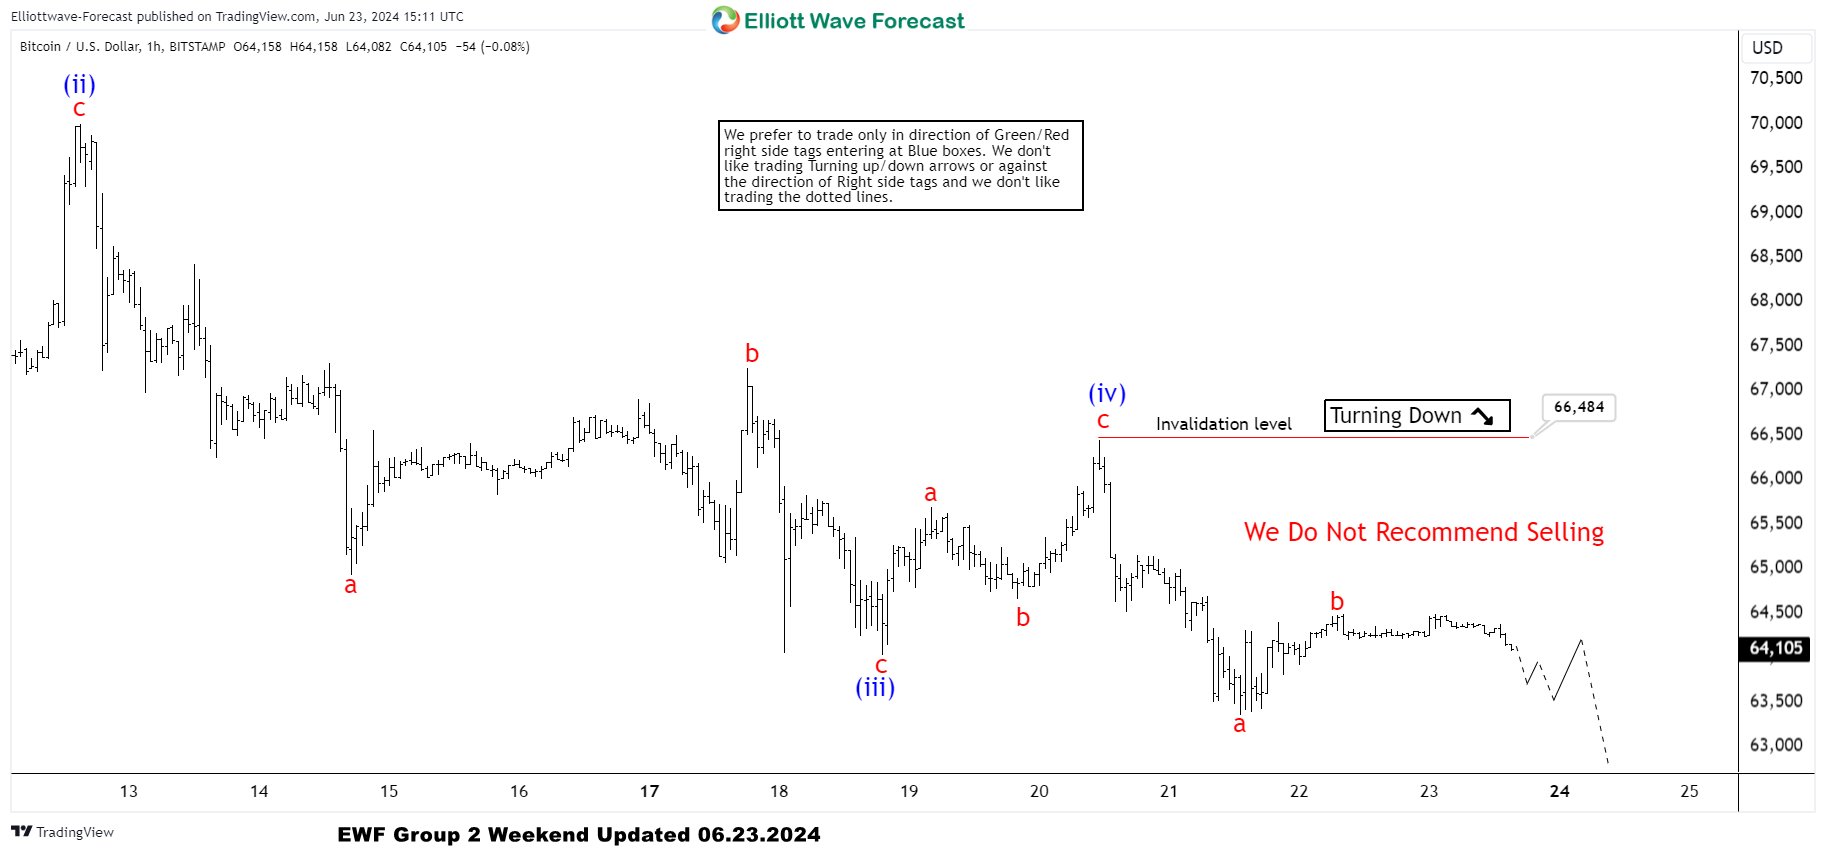
BTCUSD Elliott Wave : Forecasting the Decline Toward New Lows
Read MoreIn this technical article we’re going to take a quick look at the Elliott Wave charts of Bitcoin BTCUSD , published in members area of the website. As our members know, Bitcoin is doing a correction against the 56510 low, which is unfolding as a Flat pattern. Now, the crypto is showing impulsive sequences in […]
-
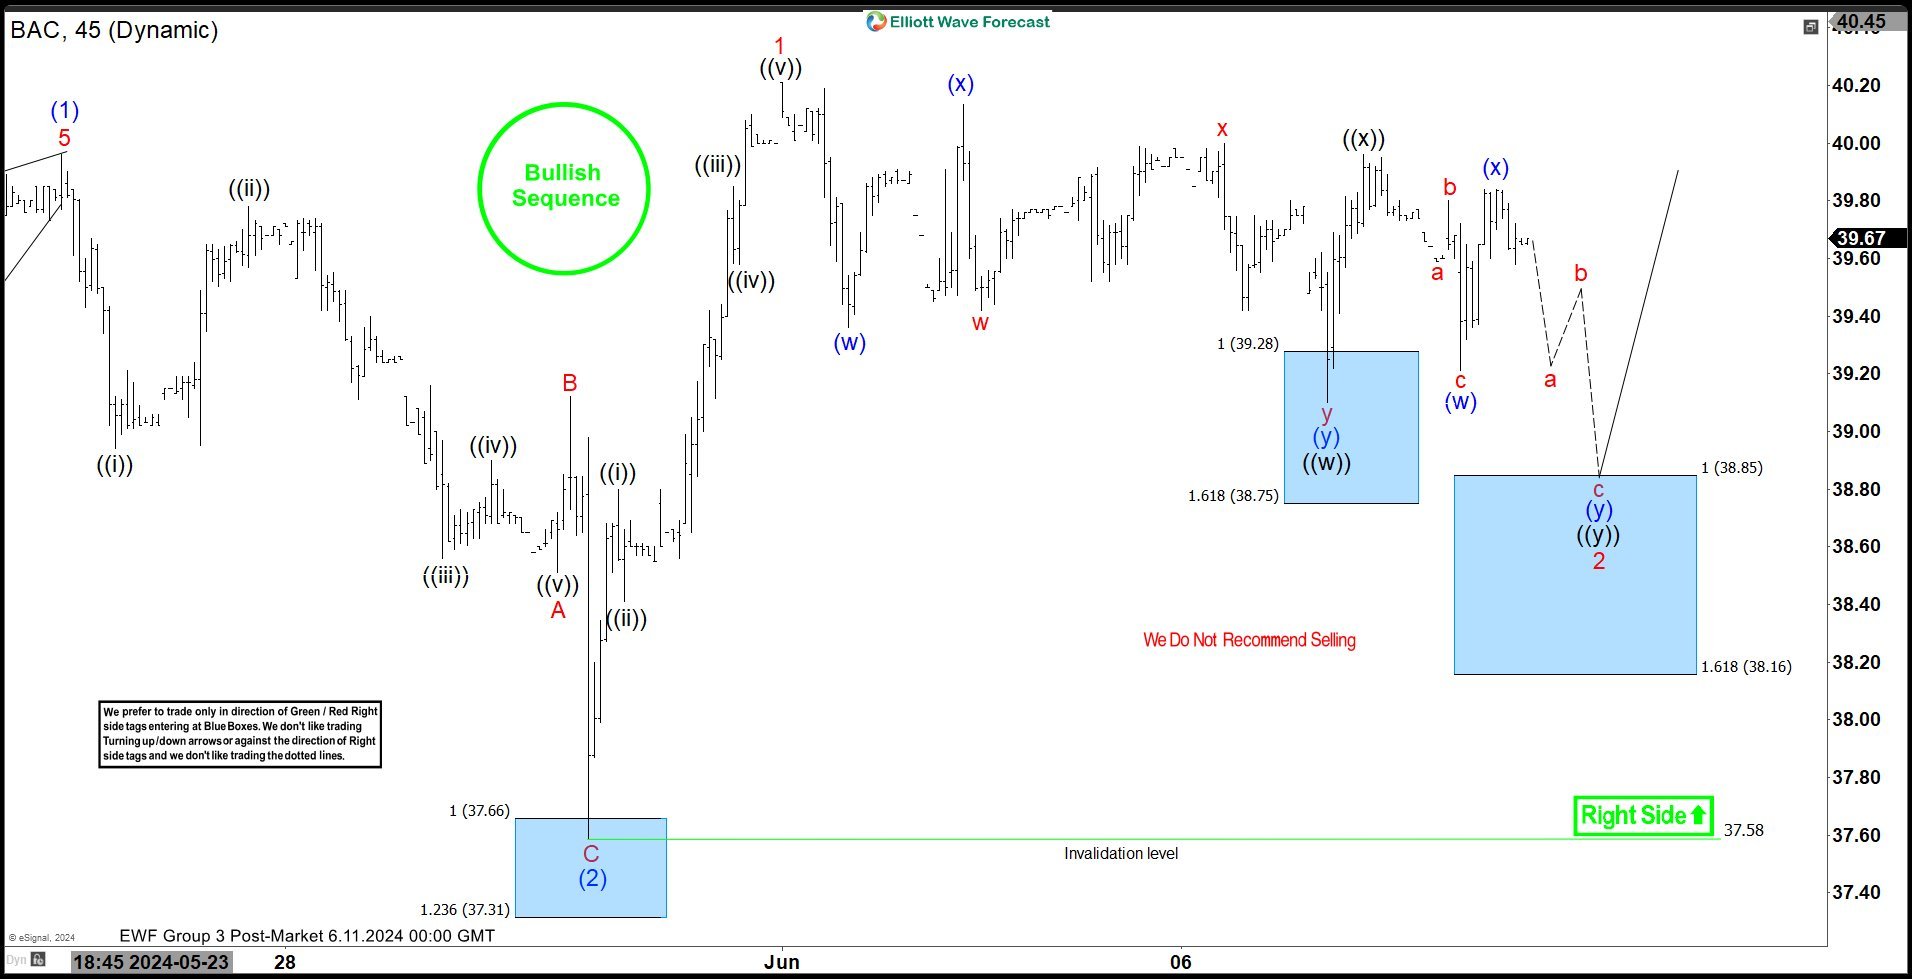
Bank of America Corp (BAC) Buying the Dips at the Blue Box Area
Read MoreHello fellow traders. In this technical article we’re going to take a look at the Elliott Wave charts charts of Bank of America Corp (BAC) Stock published in members area of the website. Our members are aware of the numerous positive trading setups we’ve had among Stocks and Indices recently. One of them is BAC […]
-
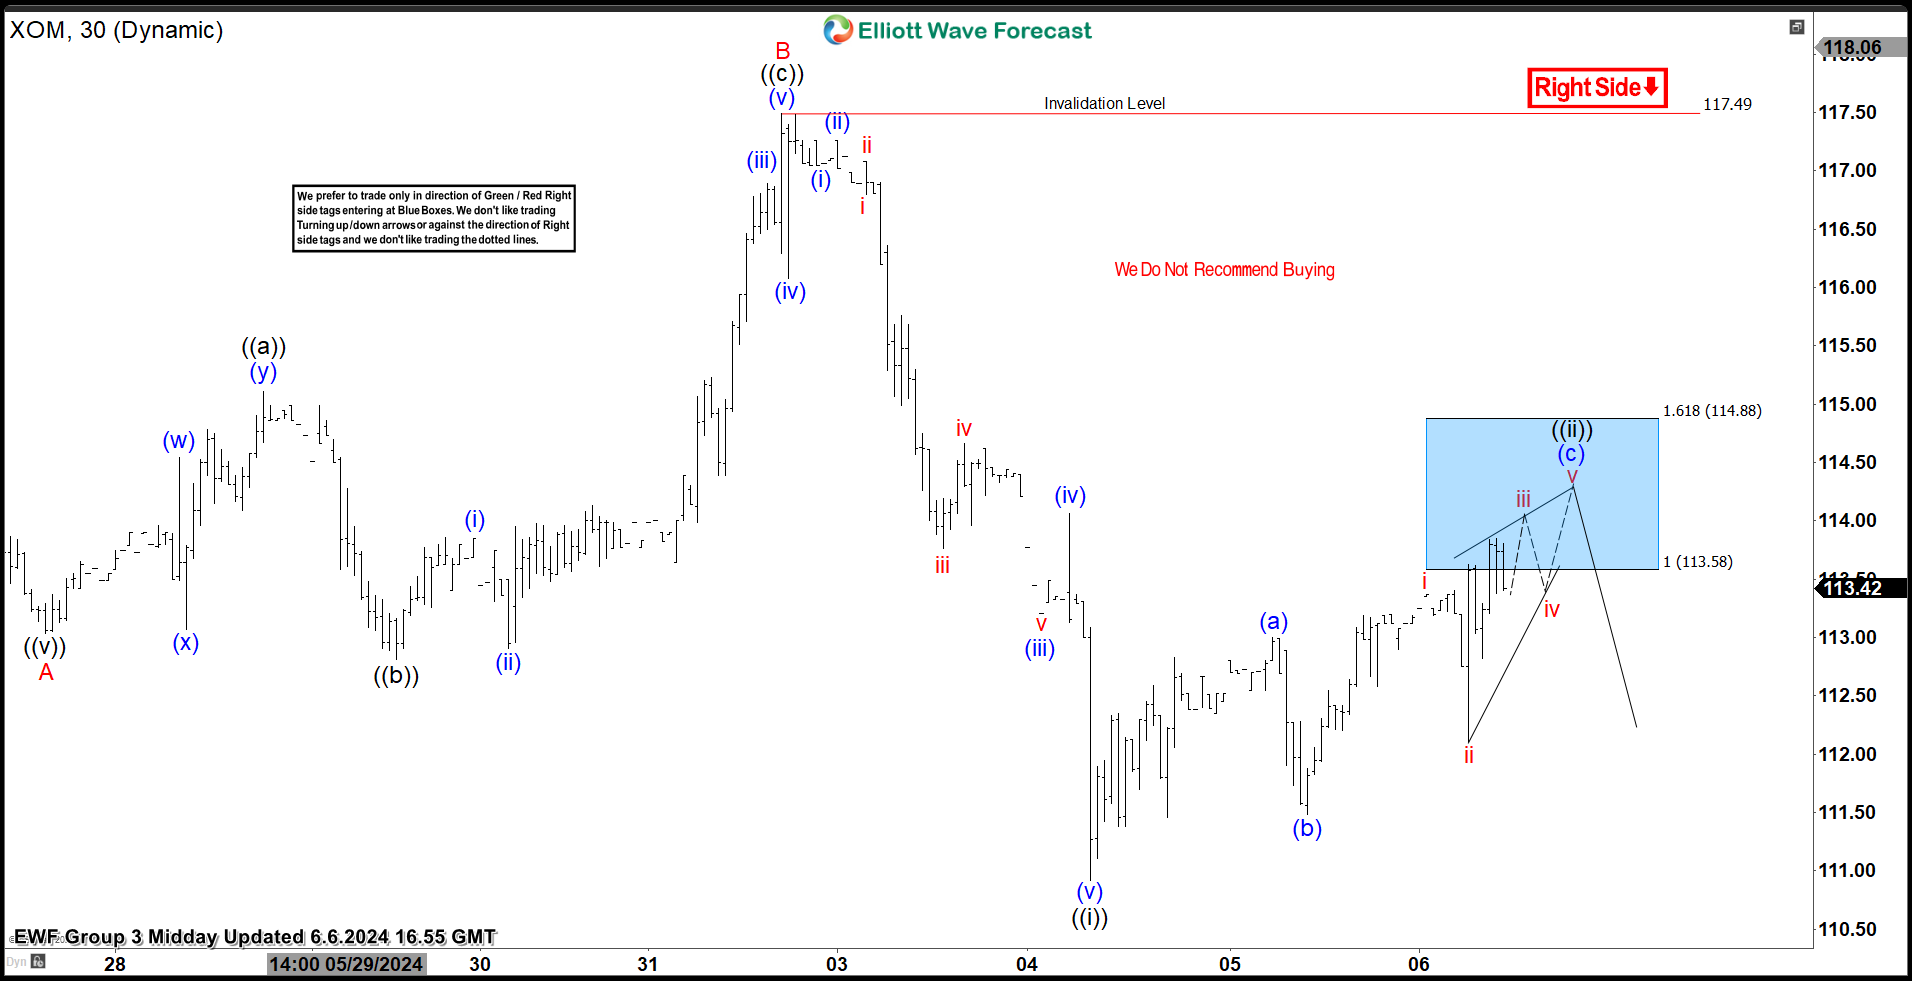
Exxon Mobil Corp (XOM) Found Sellers at the Blue Box Area
Read MoreHello fellow traders. In this technical article we’re going to take a quick look at the Elliott Wave charts of Exxon Mobil Stock (XOM) published in members area of the website. As our members know the stock has been showing incomplete sequences in the cycle from the April 12th peak. Recently XOM has given us […]