-

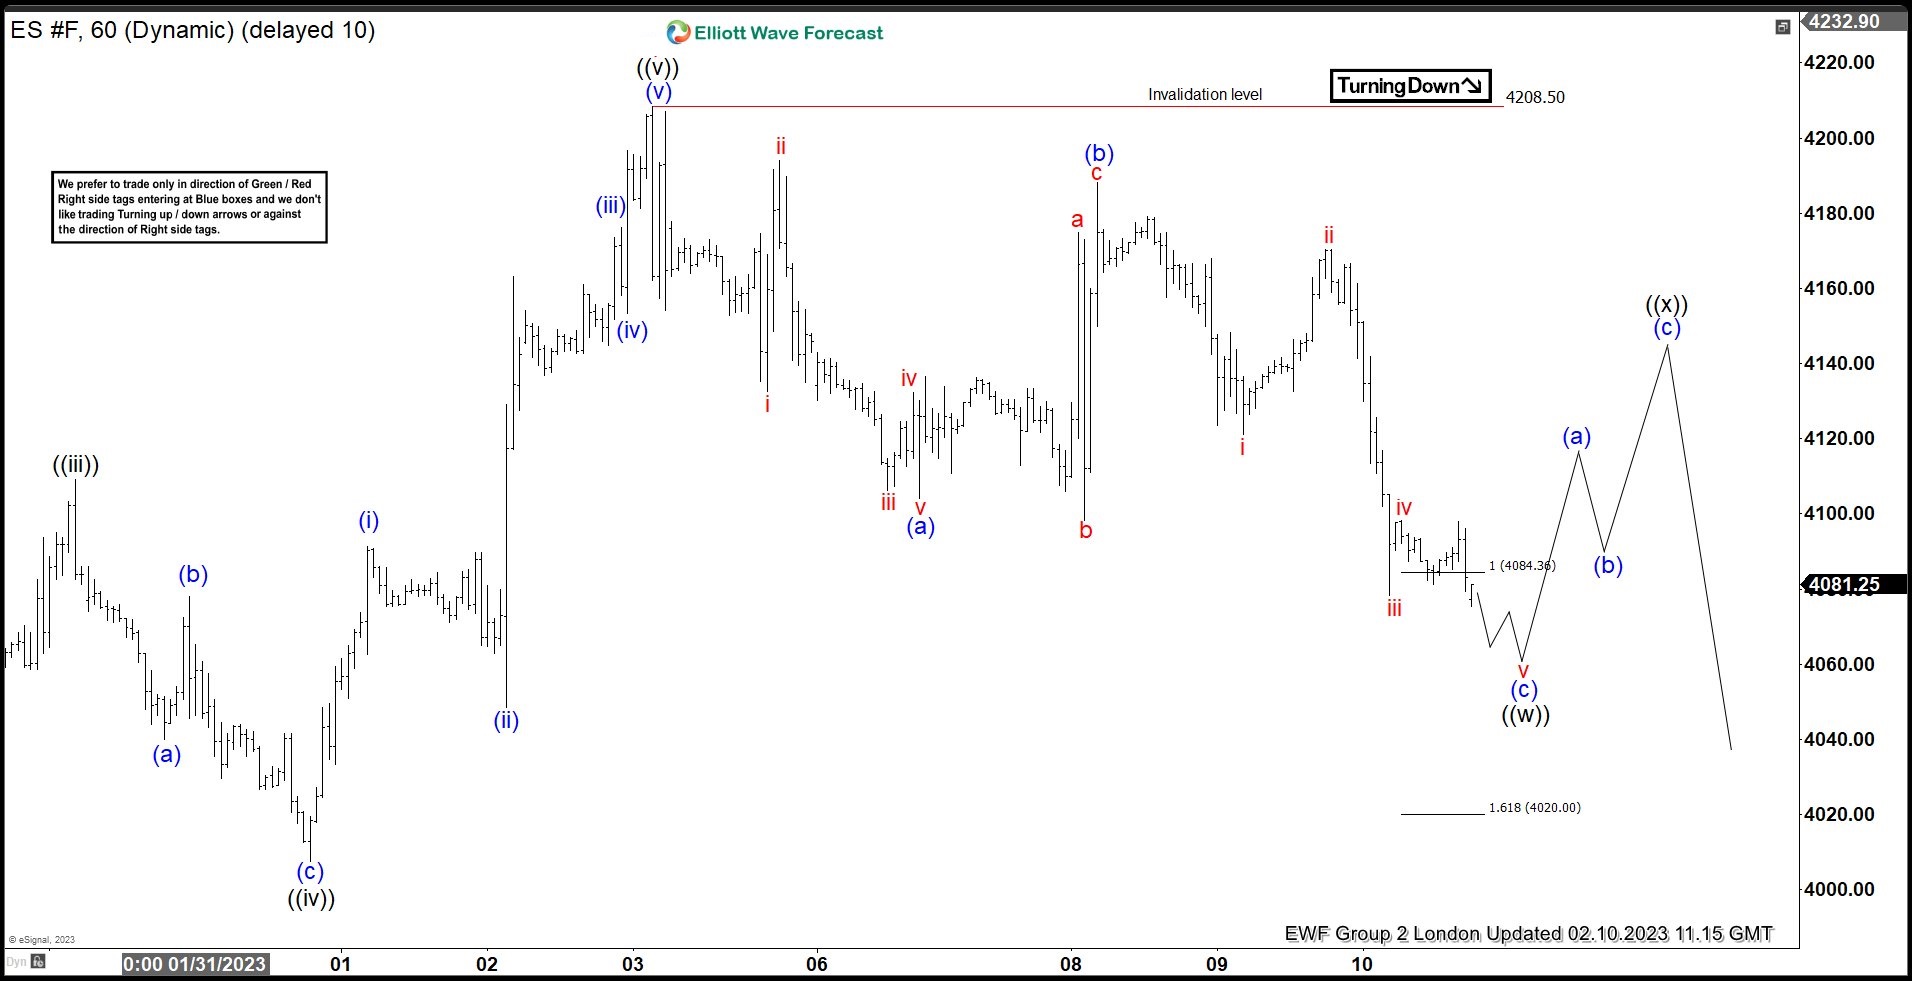
S&P 500 E-Mini Futures ( ES_F ) Forecasting The Path
Read MoreHello fellow traders. In this article we’re going to take a quick look at the Elliott Wave charts of E-Mini S&P 500 ( ES_F) published in members area of the website. As our members know ES_F ended cycle from the 3790.2 low as 5 waves structure and we have been forecasting the correction. In the further […]
-

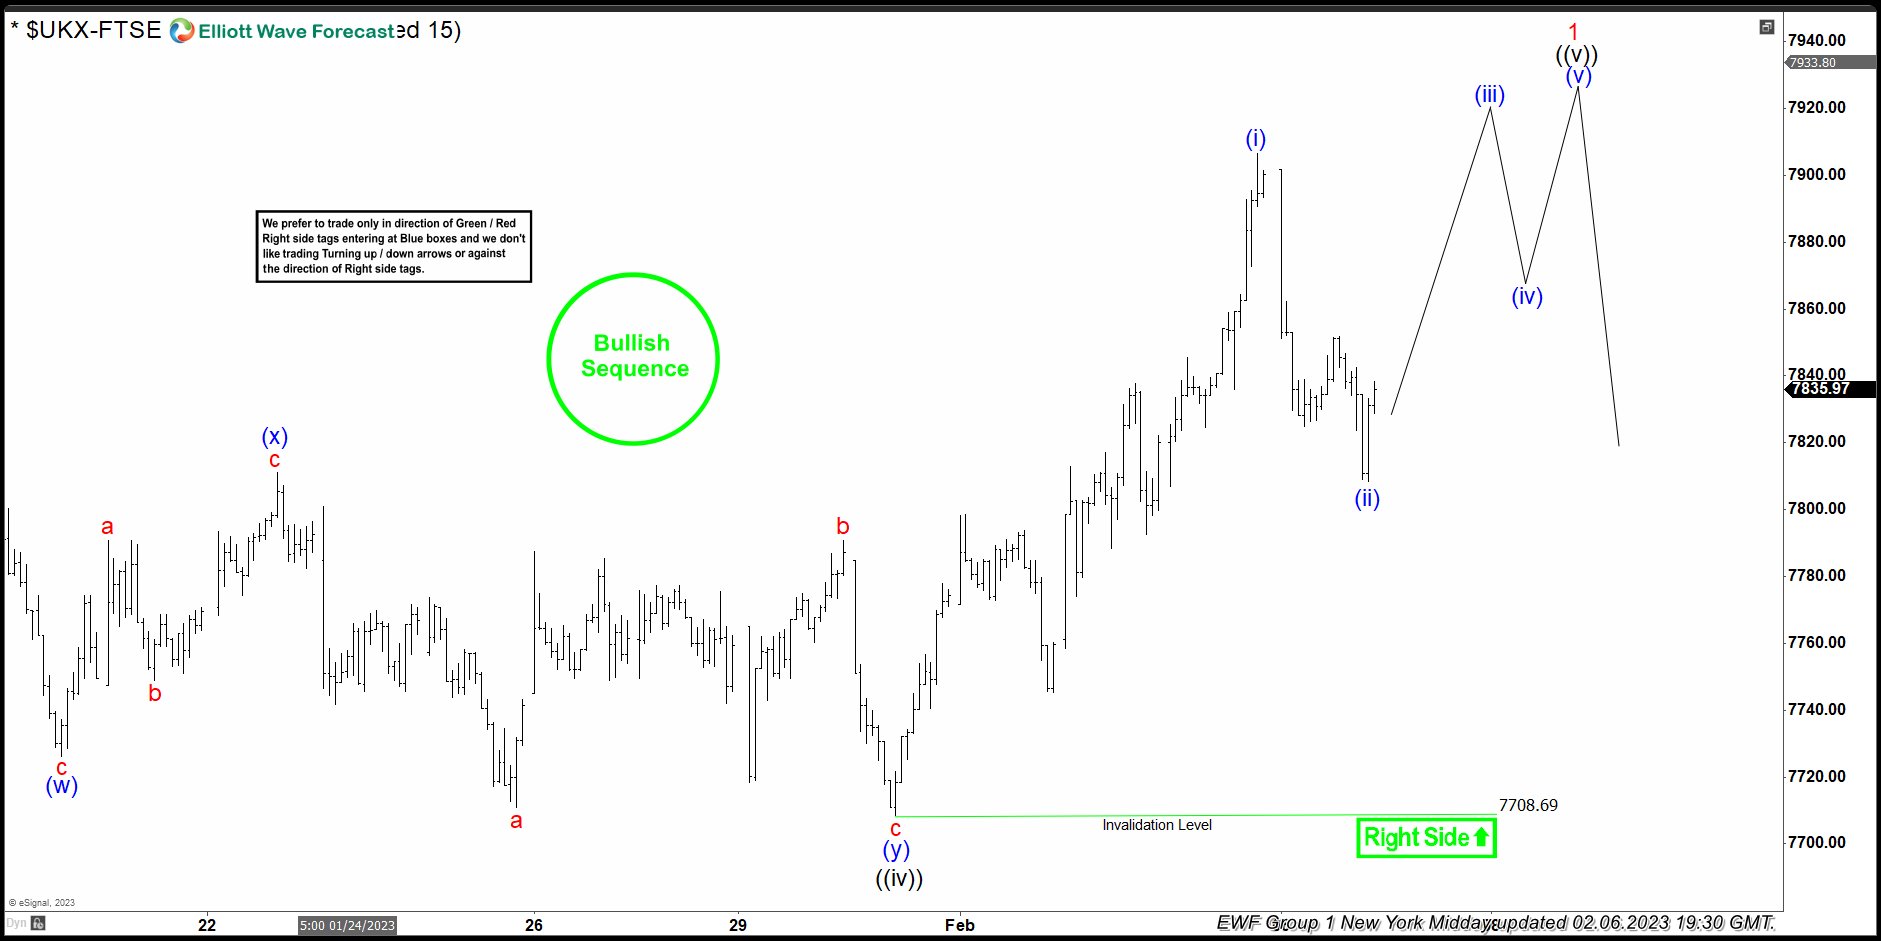
FTSE ( $UKX ) Elliott Wave Bullish Sequences Forecasting The Rally
Read MoreHello fellow traders. In this article we’re going to take a quick look at the Elliott Wave charts of FTSE, published in members area of the website. As our members know FTSE is showing bullish sequences in the cycle from the October’s 6708.6 low. Consequently we expected further rally to continue.We recommended members to avoid […]
-

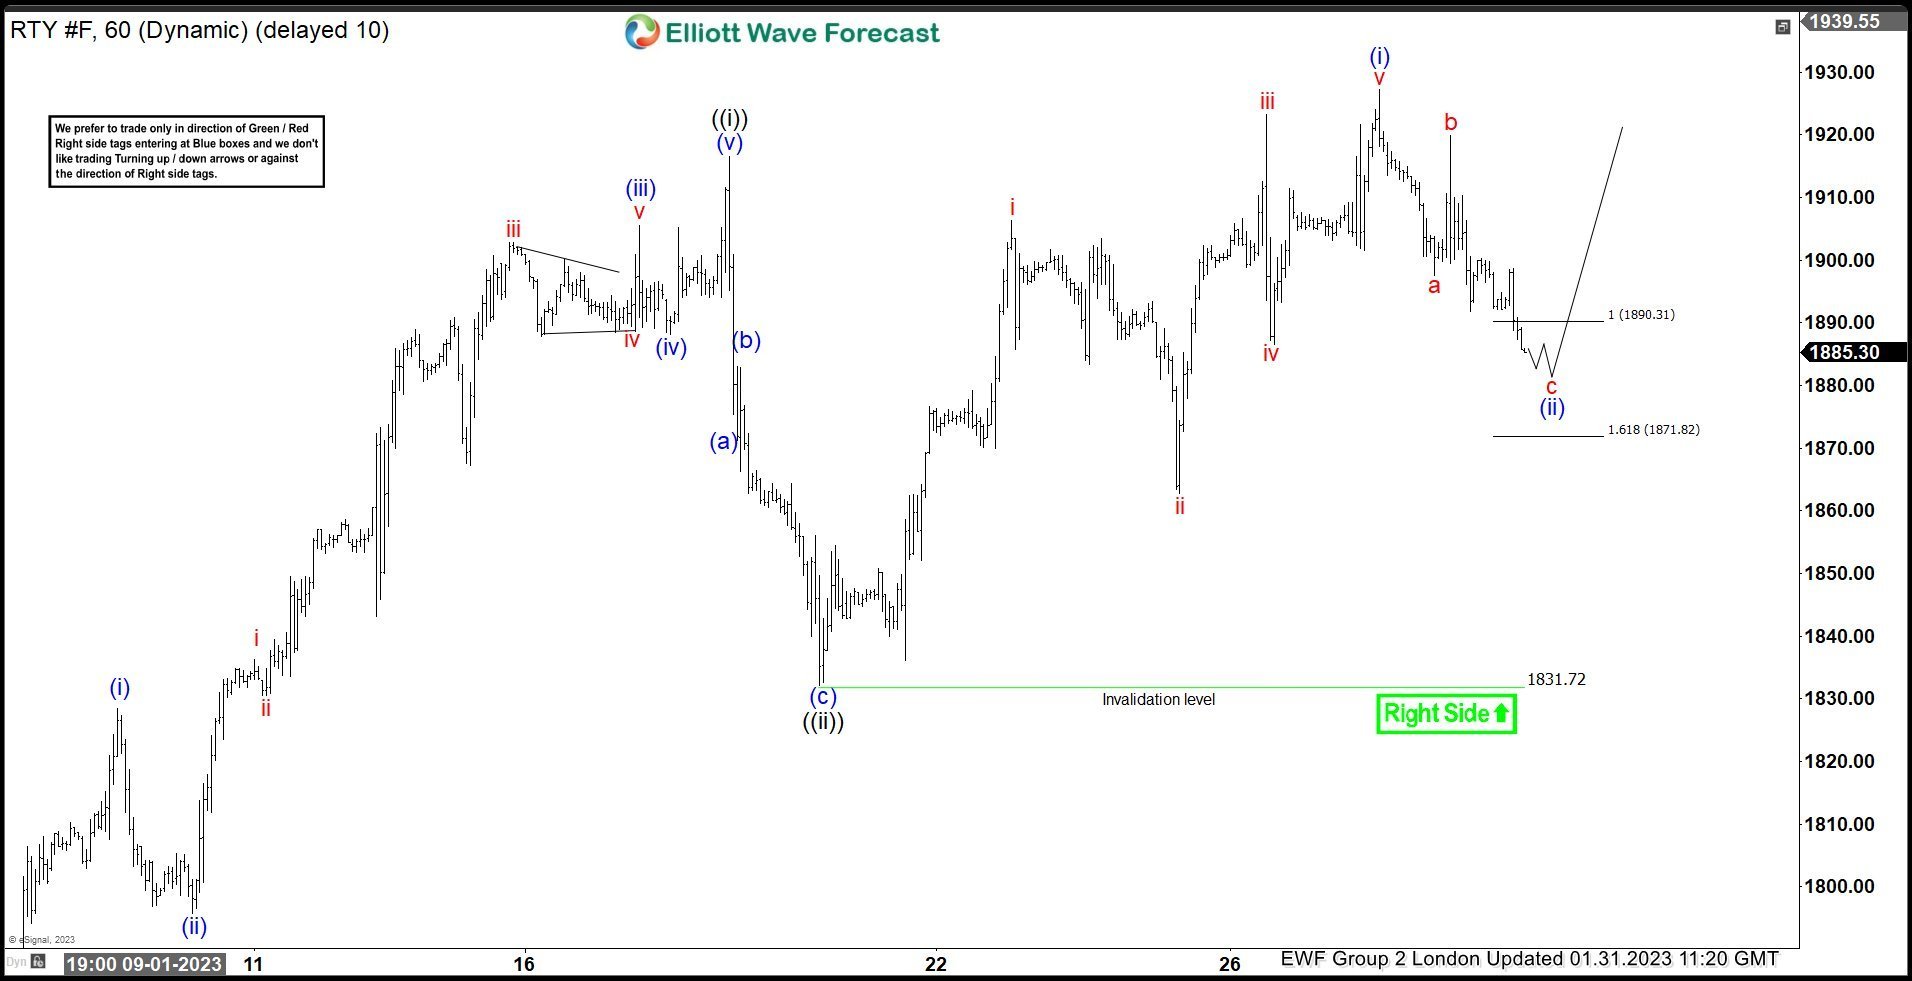
Russell $RTY_F Found Intraday Buyers At The Equal Legs Area
Read MoreHello fellow traders. In this article we’re going to take a quick look at the Elliott Wave charts of RTY_F, published in members area of the website. As our members know Russell has been showing incomplete bullish sequences in the short term cycles from the 1730.3 and 1645 lows. Consequently we were calling for a […]
-

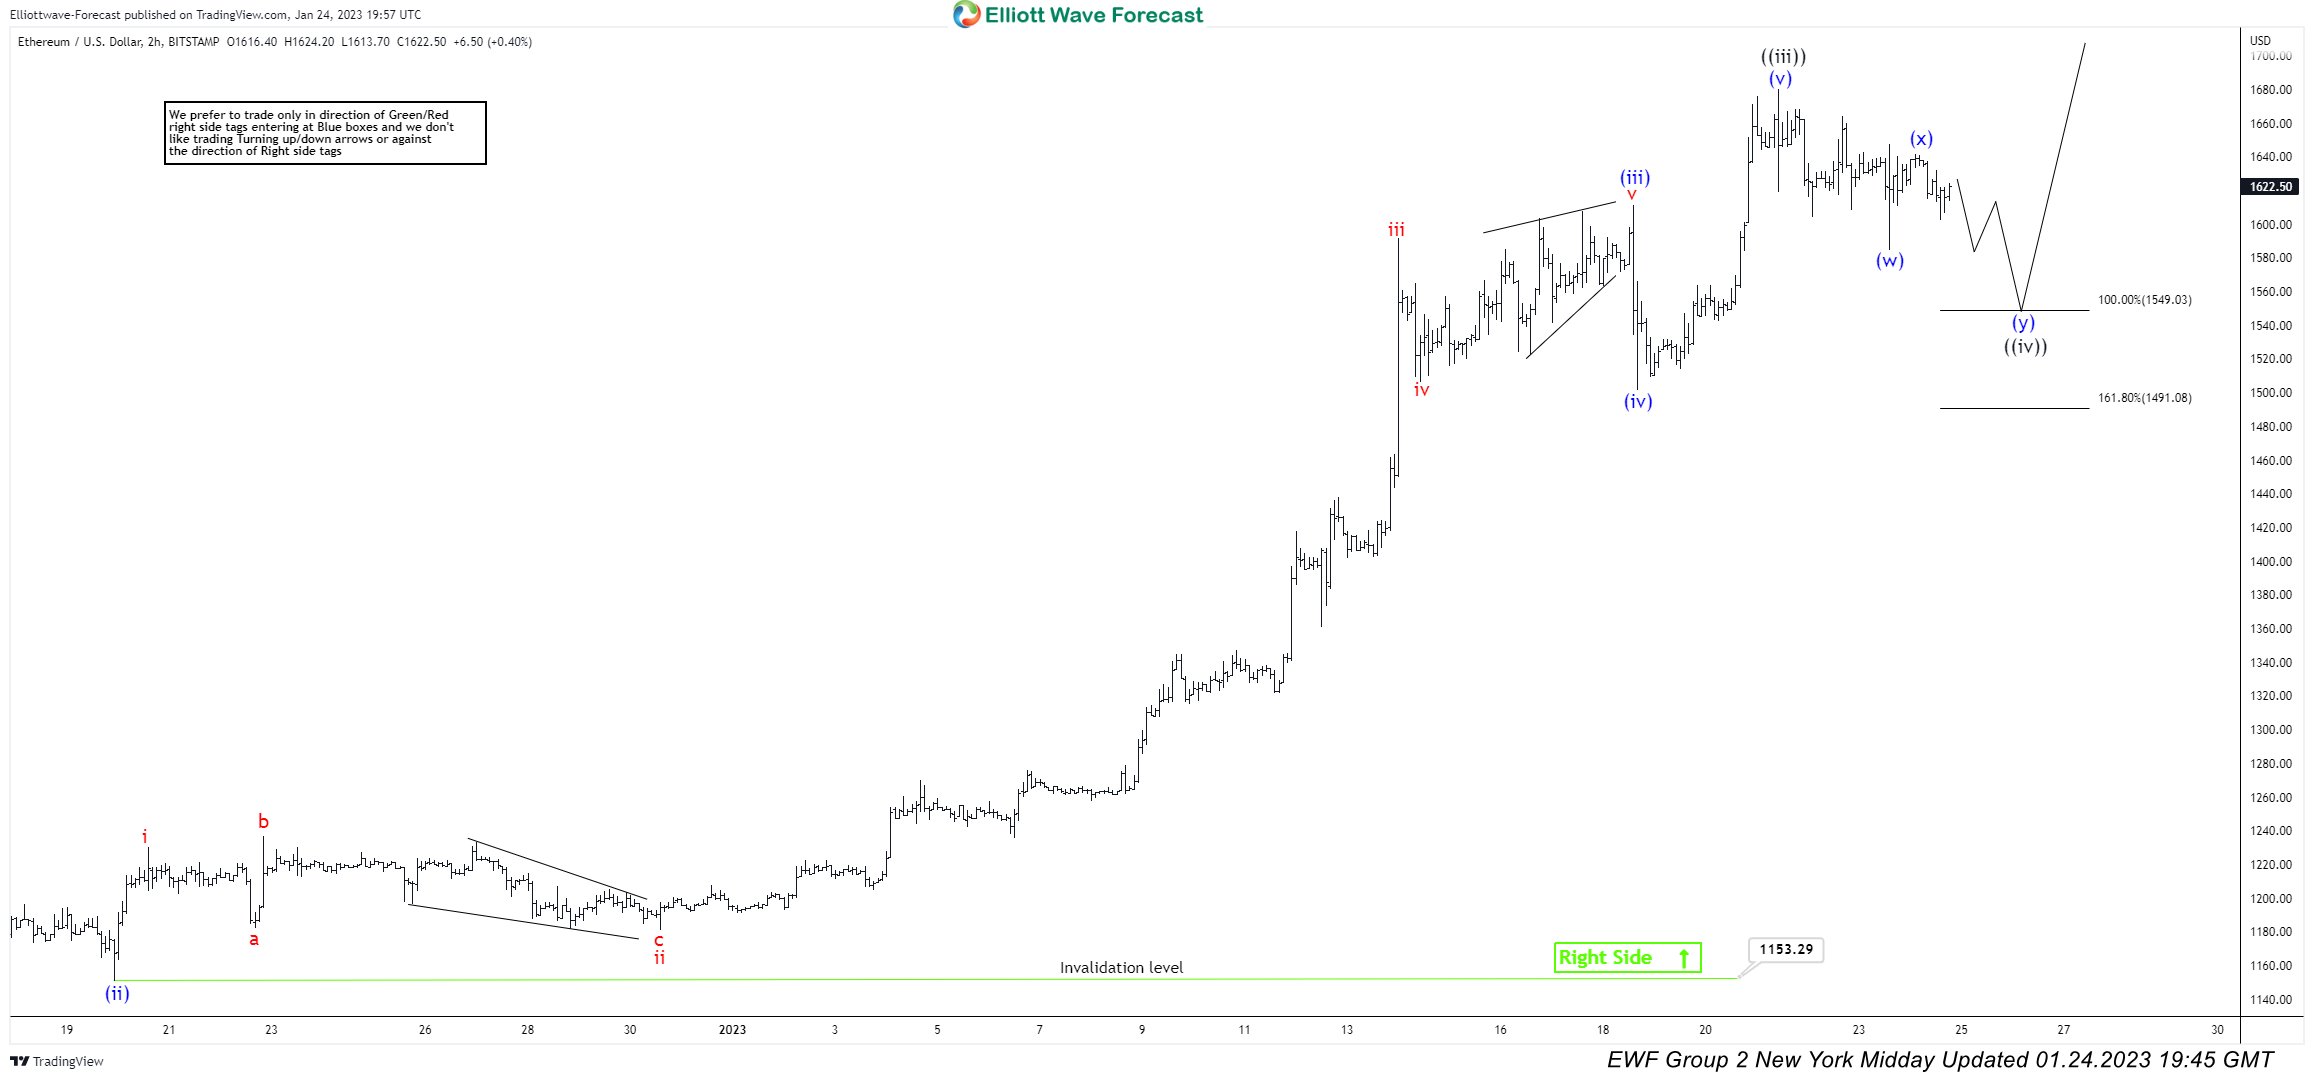
Ethereum $ETHUSD Forecasting The Rally From The Equal Legs Zone
Read MoreHello fellow traders. In this article we’re going to take a quick look at the Elliott Wave charts of Ethereum published in members area of the website. As our members know ETHUSD is trading within the cycle from the June 2022 low. Consequently we expect to see more short term strength. Recently Ethereum made a […]
-

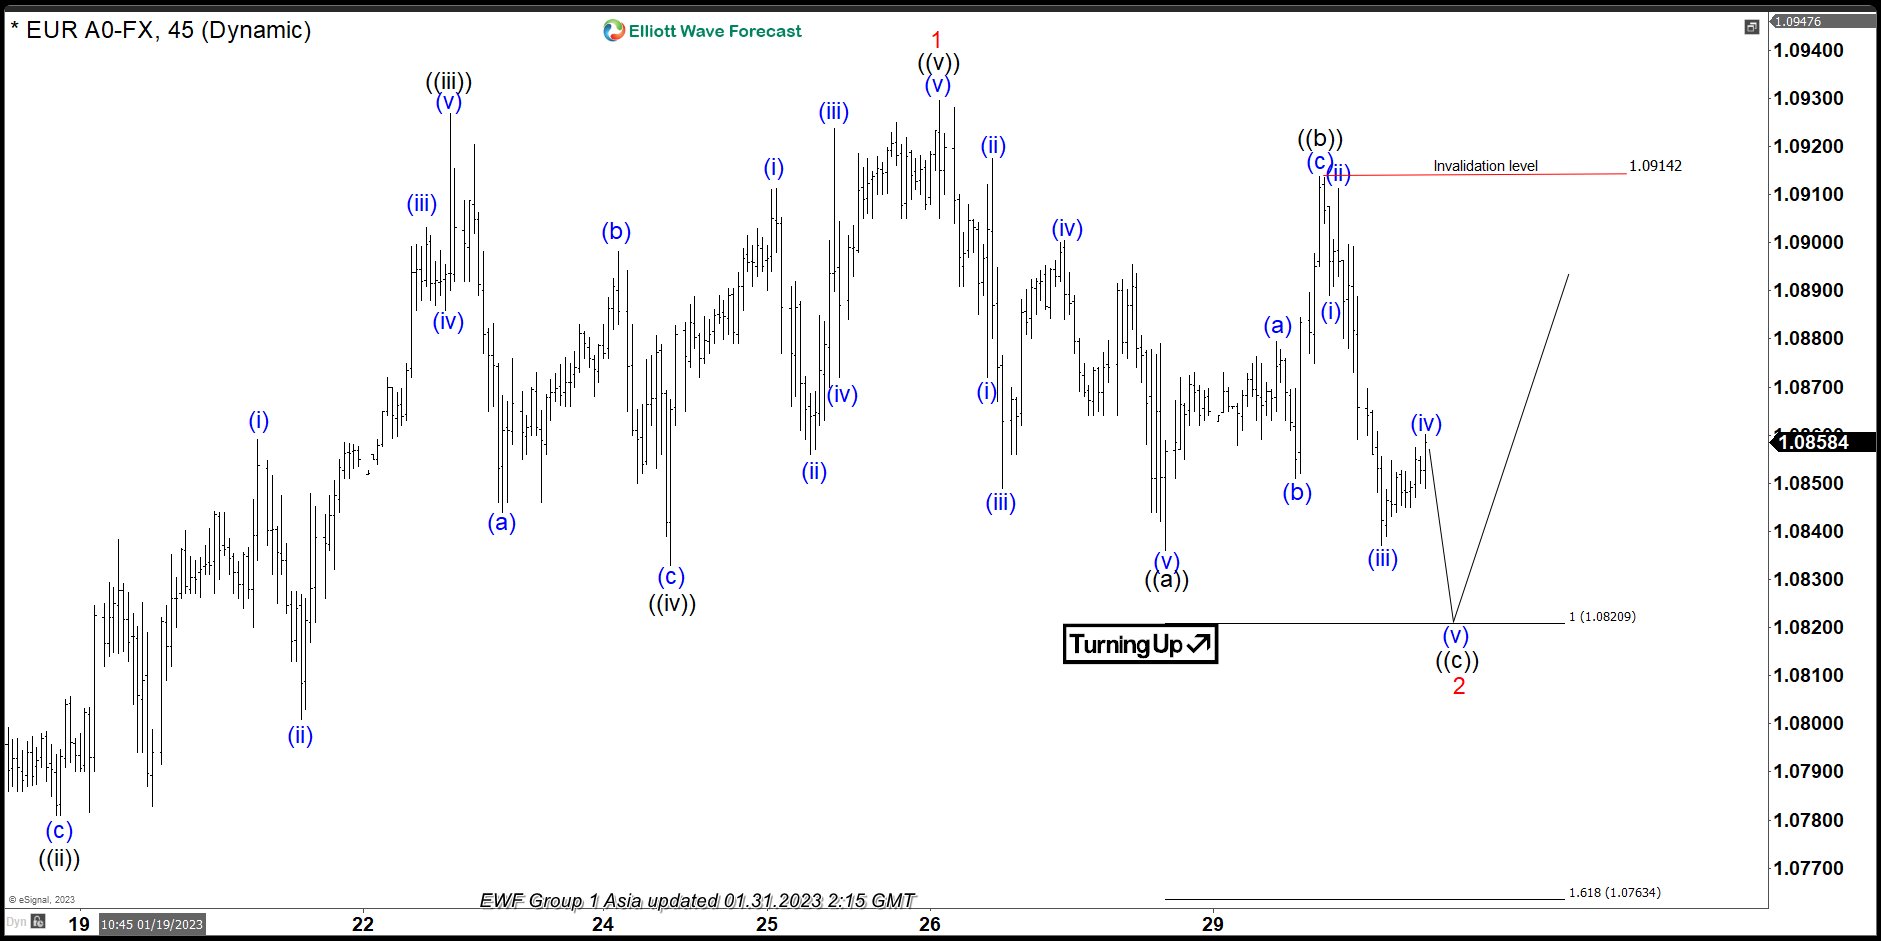
EURUSD Forecasting The Rally After Elliott Wave Zig Zag Pattern
Read MoreHello fellow traders. In this technical blog we’re going to take a quick look at the Elliott Wave charts of EURUSD, published in members area of the website. As our members know, recently EURUSD made a pull back that has had a form of Elliott Wave Zig Zag pattern. We expected the pair to find […]
-

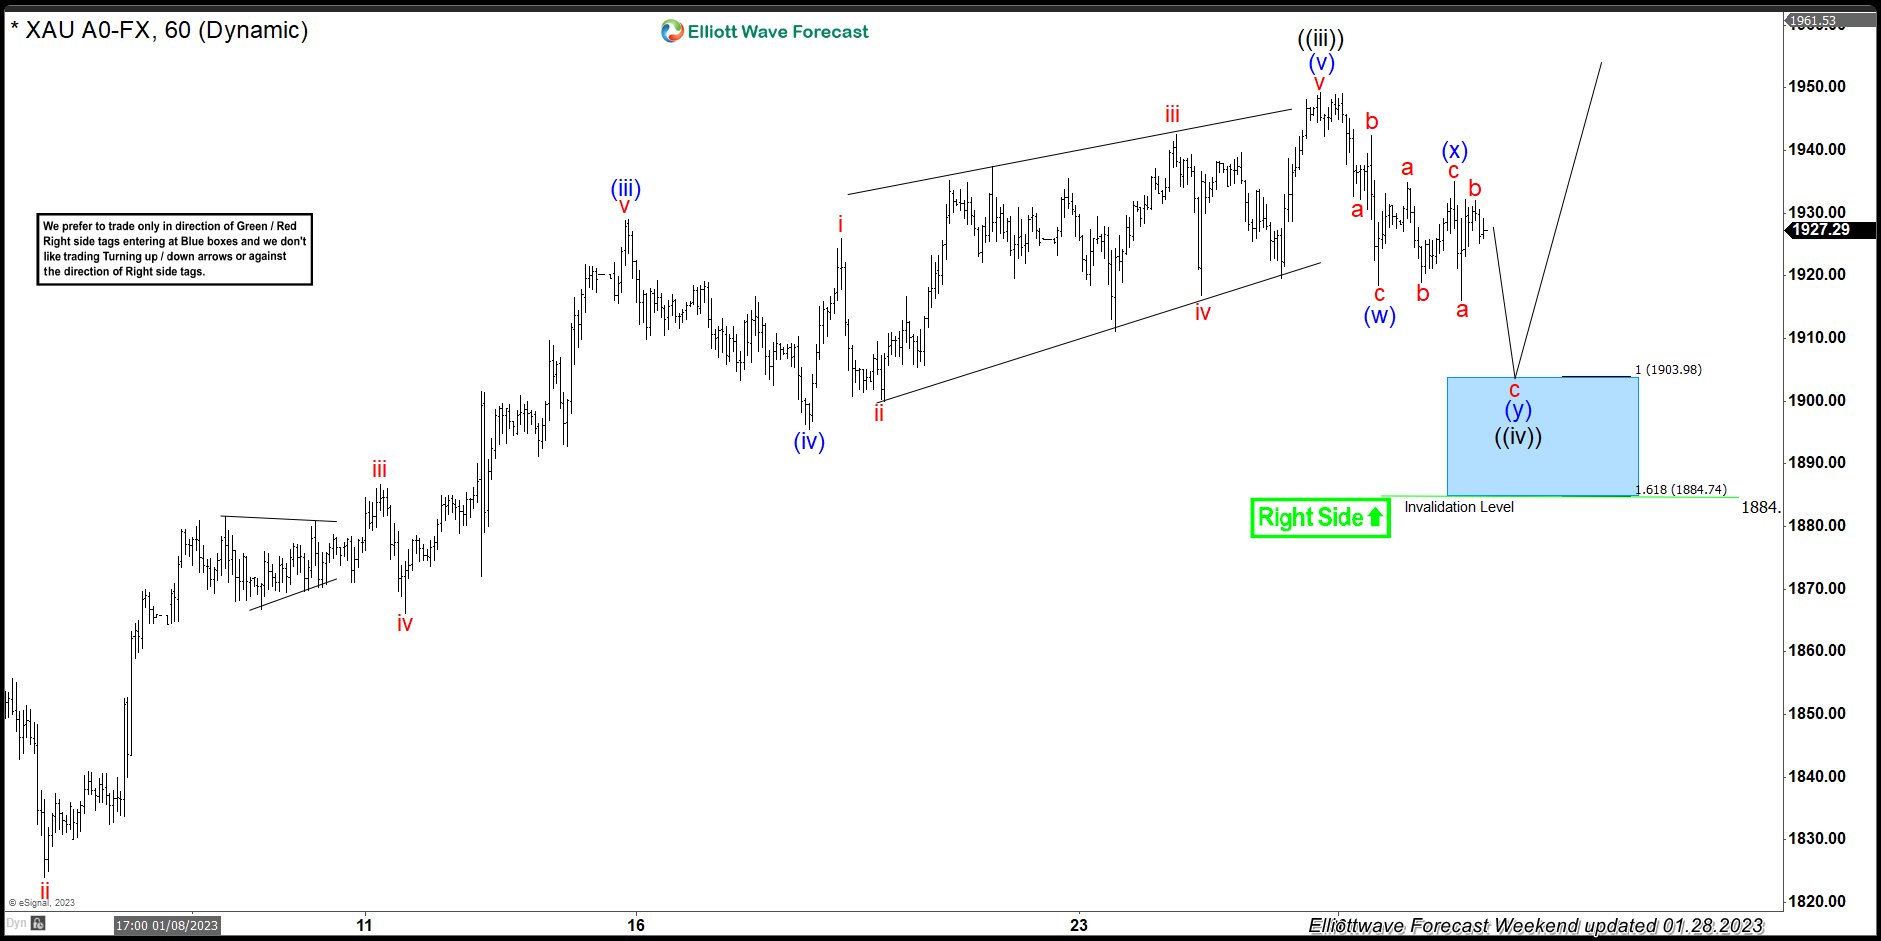
GOLD ( $XAUUSD ) Forecasting The Path & Buying The Dips
Read MoreIn this article we’re going to take a quick look at the Elliott Wave charts of GOLD, published in members area of the website. As our members know, we have been favoring the long side in the commodity since the September of 2022. We recommended members to avoid selling , while keep favoring the long […]
