
-
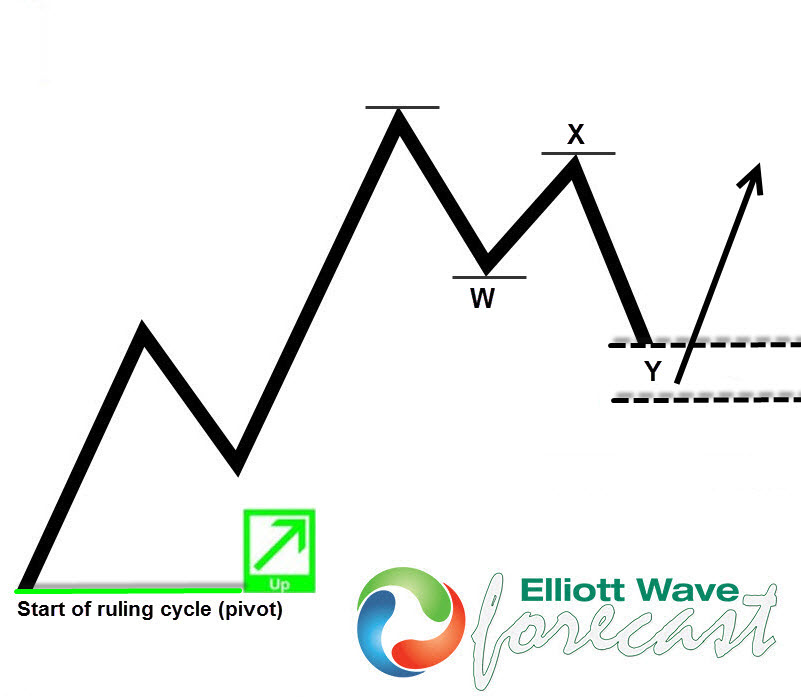
Just Starting with Elliott Wave? This Is Where to Begin
Read MoreHello, fellow traders! If you’re new to Elliott Wave, this article will guide you on where to begin. Elliott Wave Theory is one of the most powerful methods used in technical analysis to predict financial market cycles and trends. By identifying extremes in investor psychology, it offers a structured way to analyze the market. Elliott […]
-
GOLD (XAUUSD) Elliott Wave: Forecasting the Rally From Equal Legs Area
Read MoreHello fellow traders, In this technical article, we are going to present Elliott Wave charts of GOLD (XAUUSD) . As our members know we are long in GOLD from previous equal legs area. As a result, members are enjoying profits in risk-free positions. Recently ,the commodity completed its intraday correction at the Equal Legs zone. […]
-
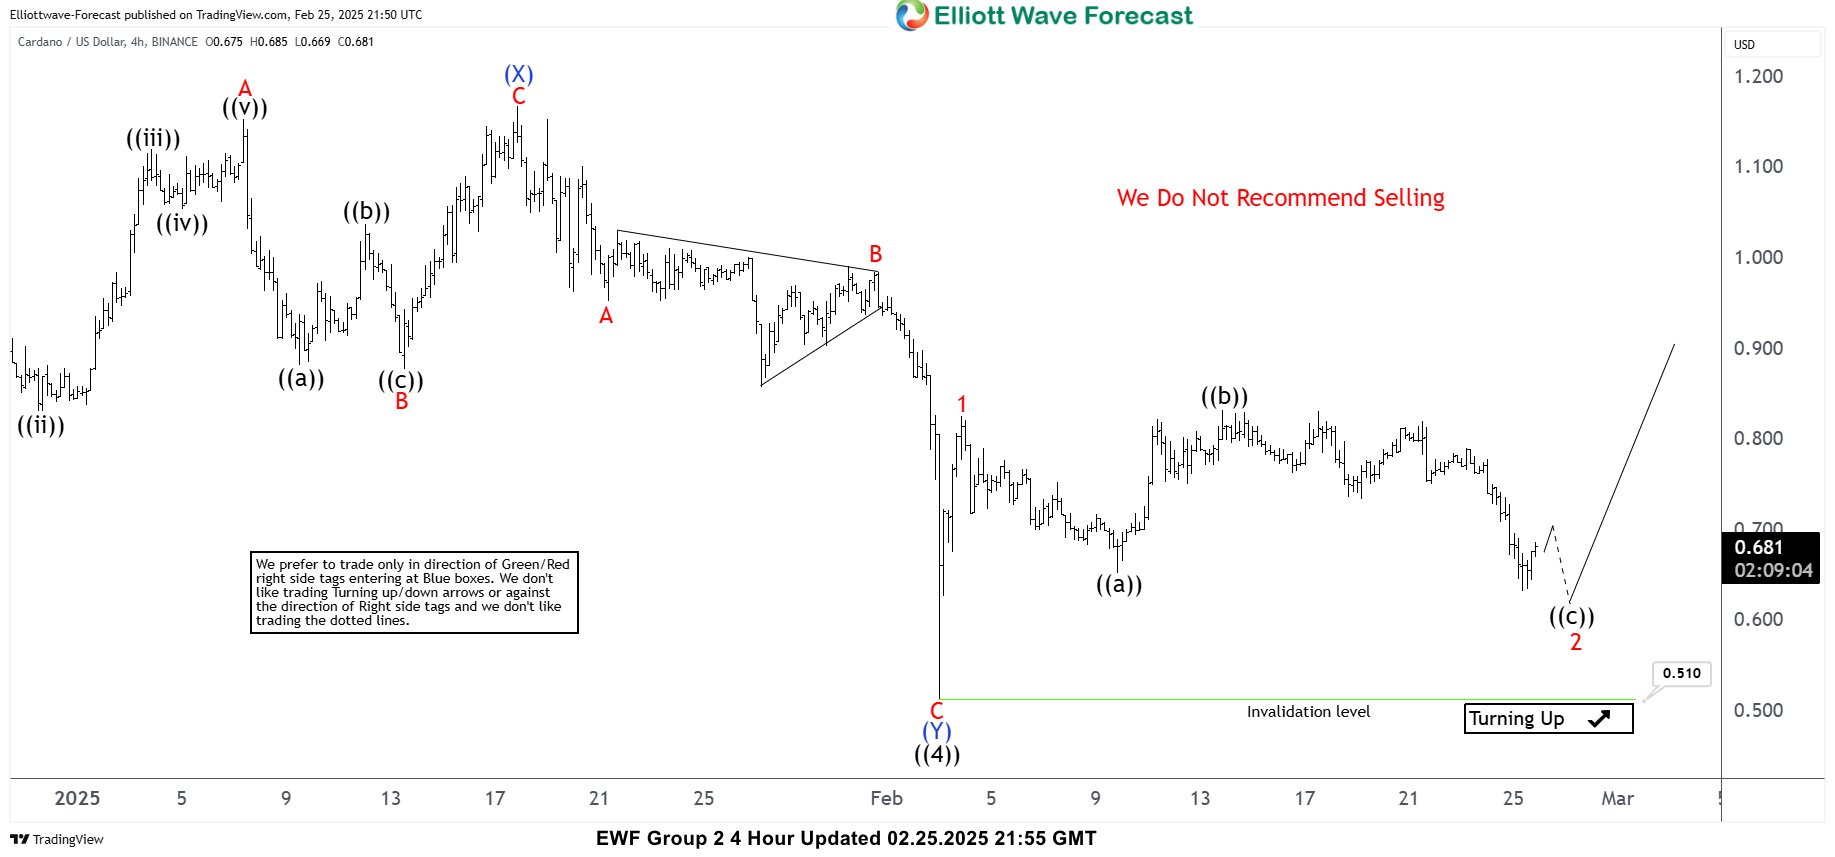
Cardano (ADAUSD) Elliott Wave: Calling the Rally After Flat Pattern
Read MoreIn this technical article we’re going to take a look at the Elliott Wave charts charts of Cardano (ADAUSD) published in members area of the website. As our members know, we generally favor the long side in cryptos, and they have recently offered good trading opportunities. Caradano has recently complete expanded flat against the 0.514 […]
-
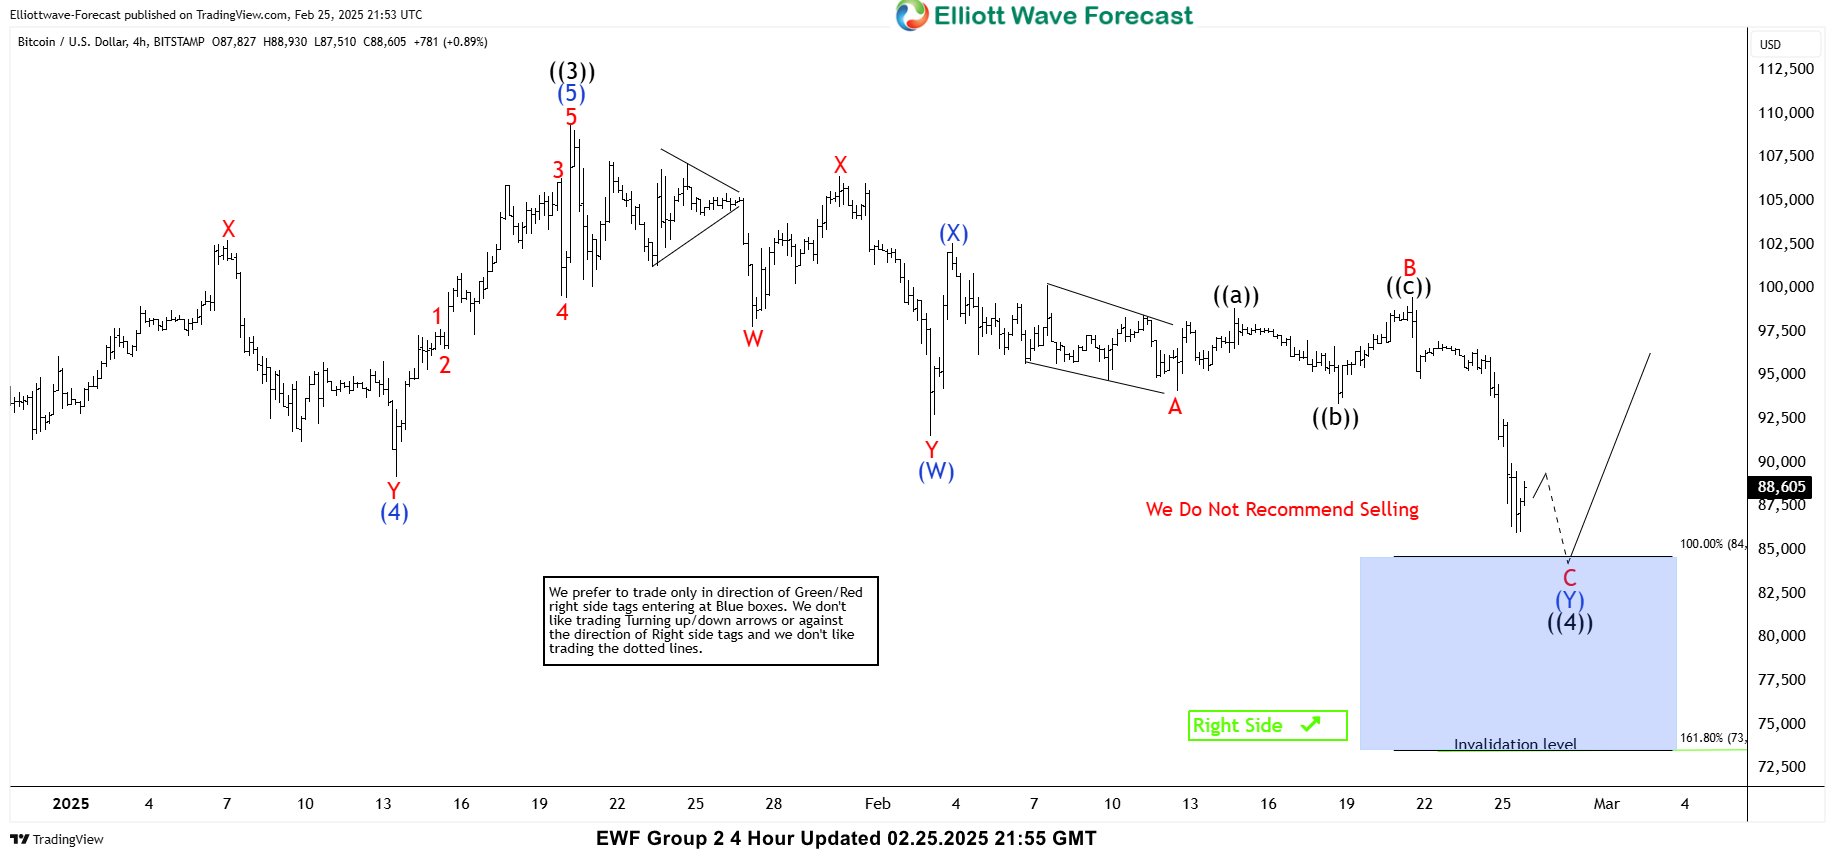
Bitcoin (BTCUSD) Elliott Wave Buying the Dips at the Blue Box Area
Read MoreIn this article we’re going to take a quick look at the Elliott Wave charts of Bitcoin BTCUSD published in members area of the website. As our members know BTCUSD is showing impulsive bullish sequences in the cycles from the 15,760 and 50,186 lows , that are calling for a further strength. Recently we got […]
-
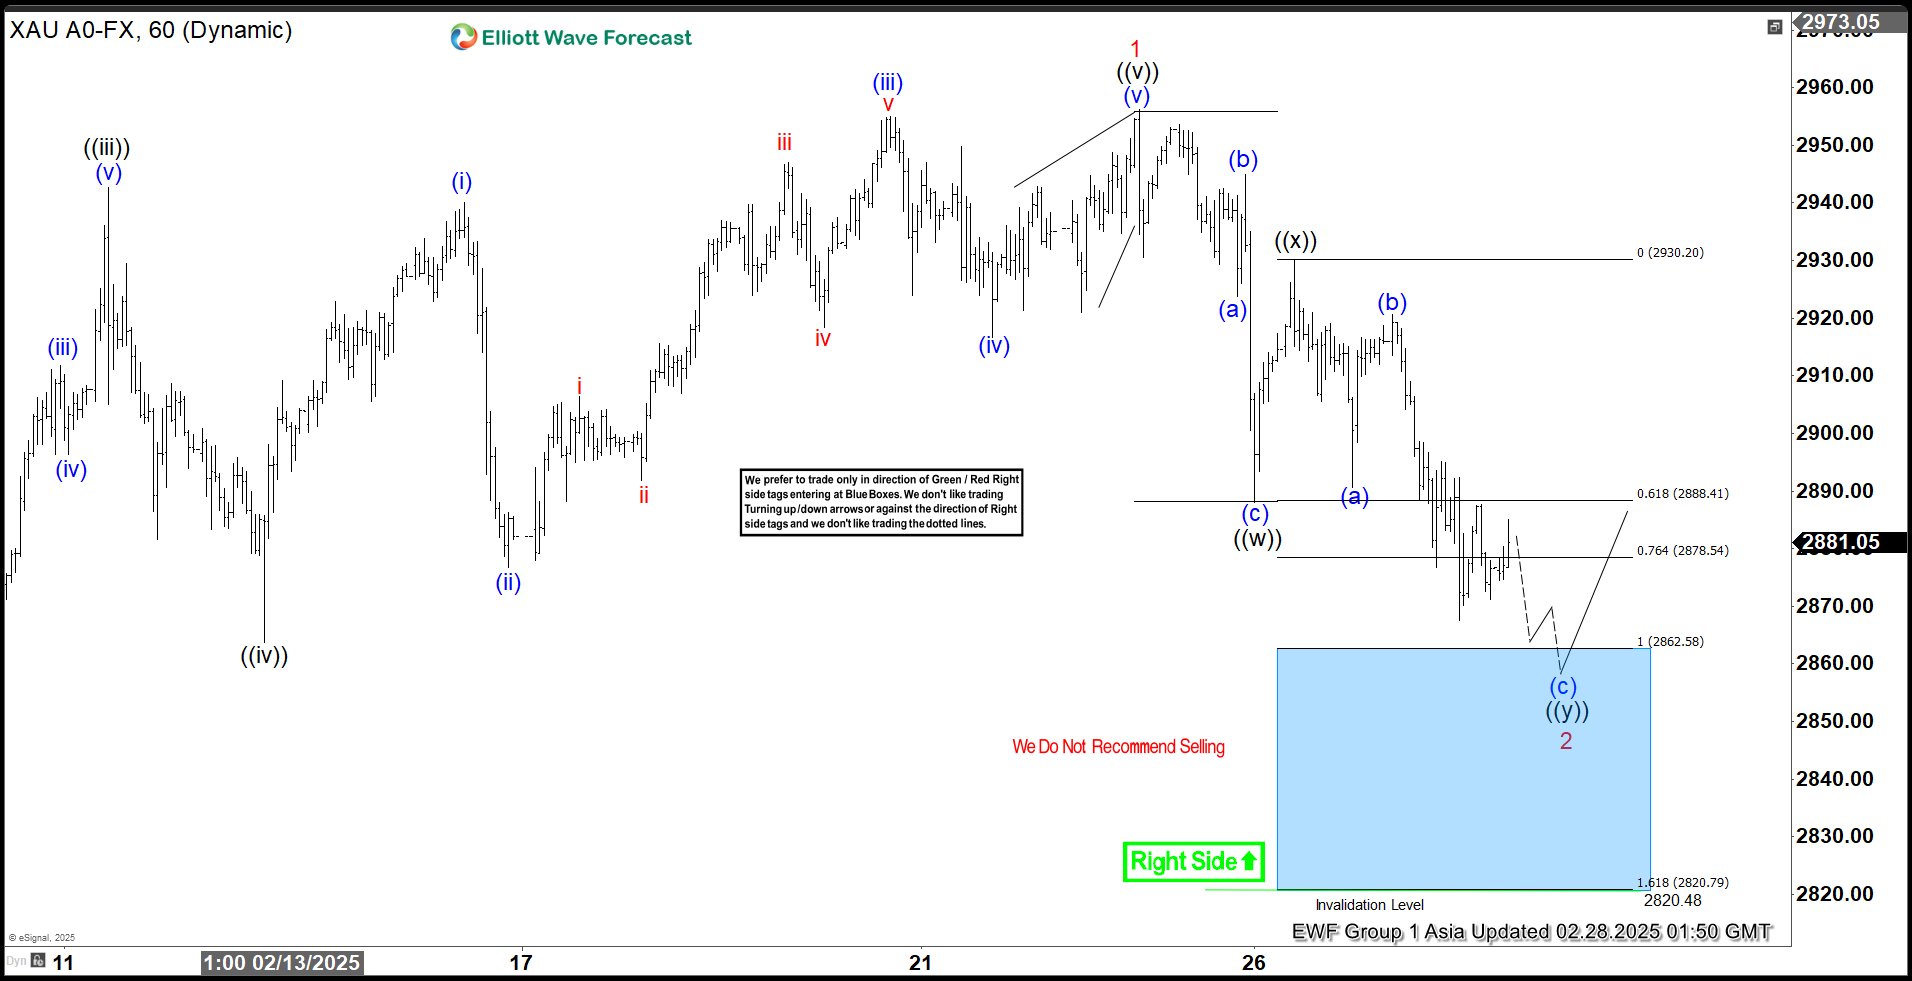
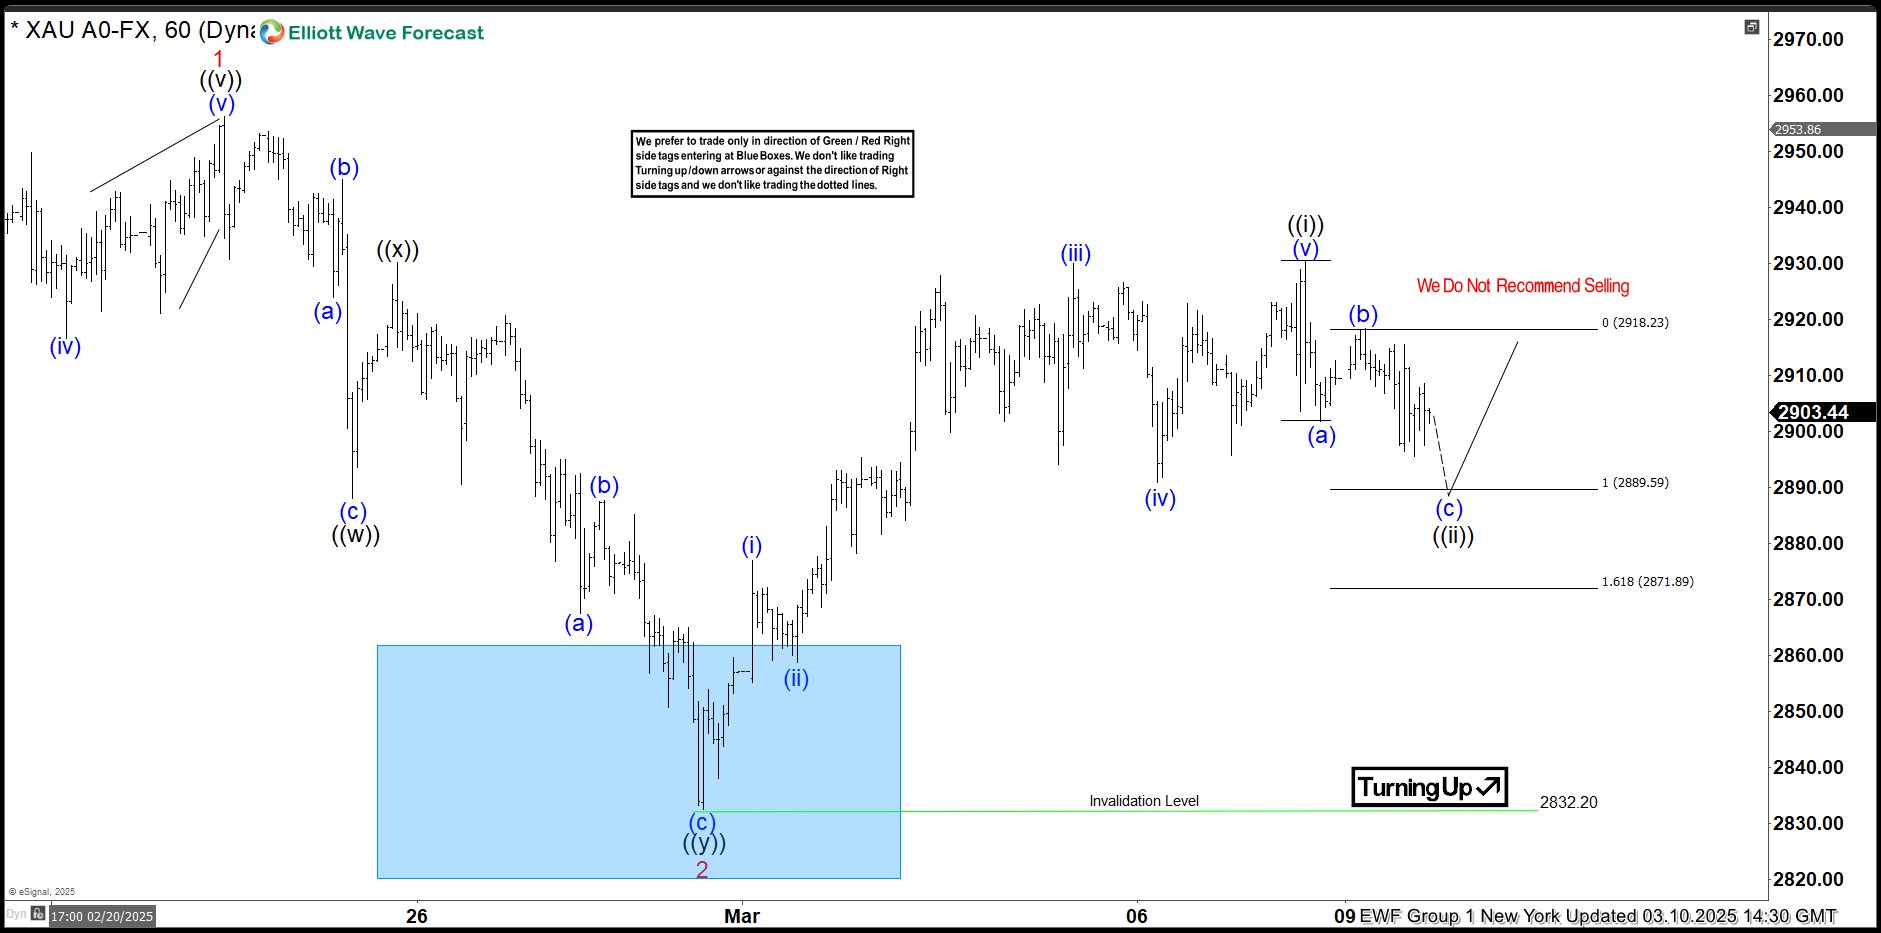
GOLD (XAUUSD) Elliott Wave: Buying the Dips at the Blue Box Area
Read MoreHello fellow traders, As our members know we have had many profitable trading setups recently. In this technical article, we are going to present another Elliott Wave trading setup we got in GOLD (XAUUSD) . The commodity completed its correction precisely at the Equal Legs zone, referred to as the Blue Box Area. In the […]
-
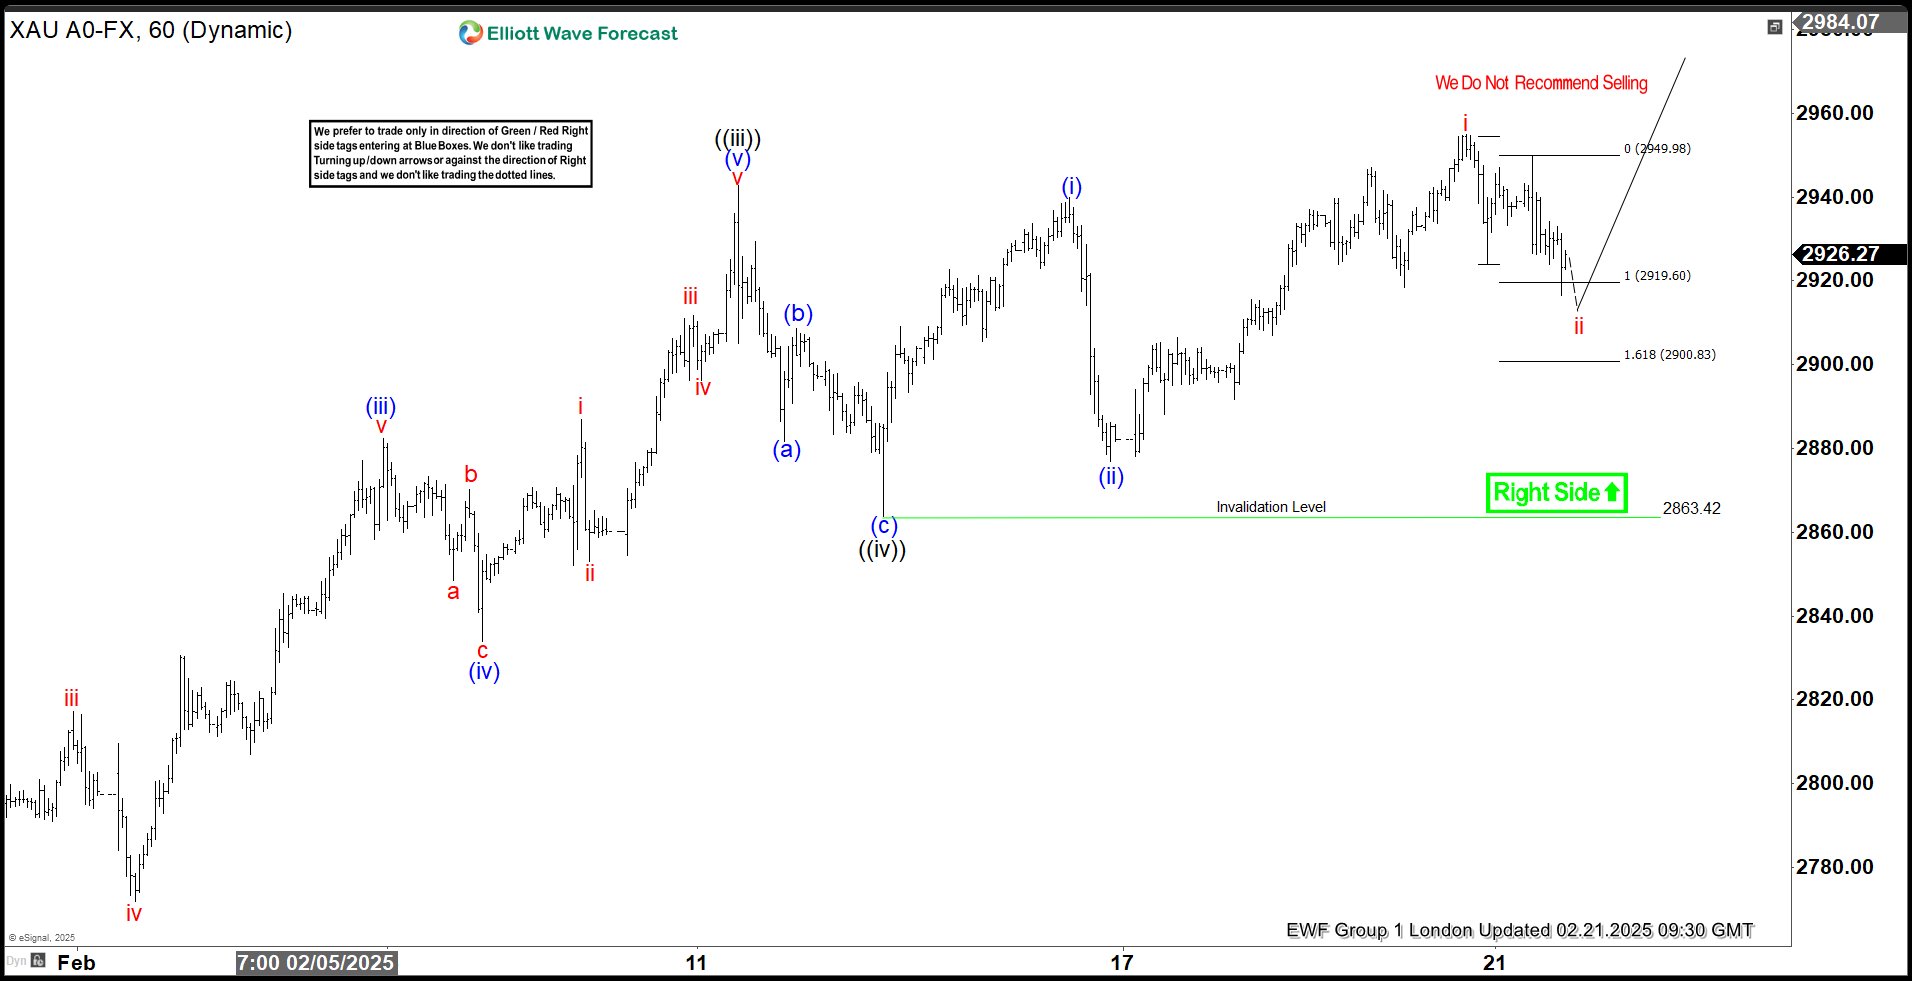
GOLD (XAUUSD) Elliott Wave: Forecasting the Rally from the Equal Legs Area
Read MoreHello traders ! In this technical article, we’re going to take a quick look at the Elliott Wave charts of GOLD (XAUUSD ) , published in the members area of the website. As our members know, XAUUSD has been showing impulsive bullish sequences in the cycle from 2579.36. We continue to favor the long side […]