
-
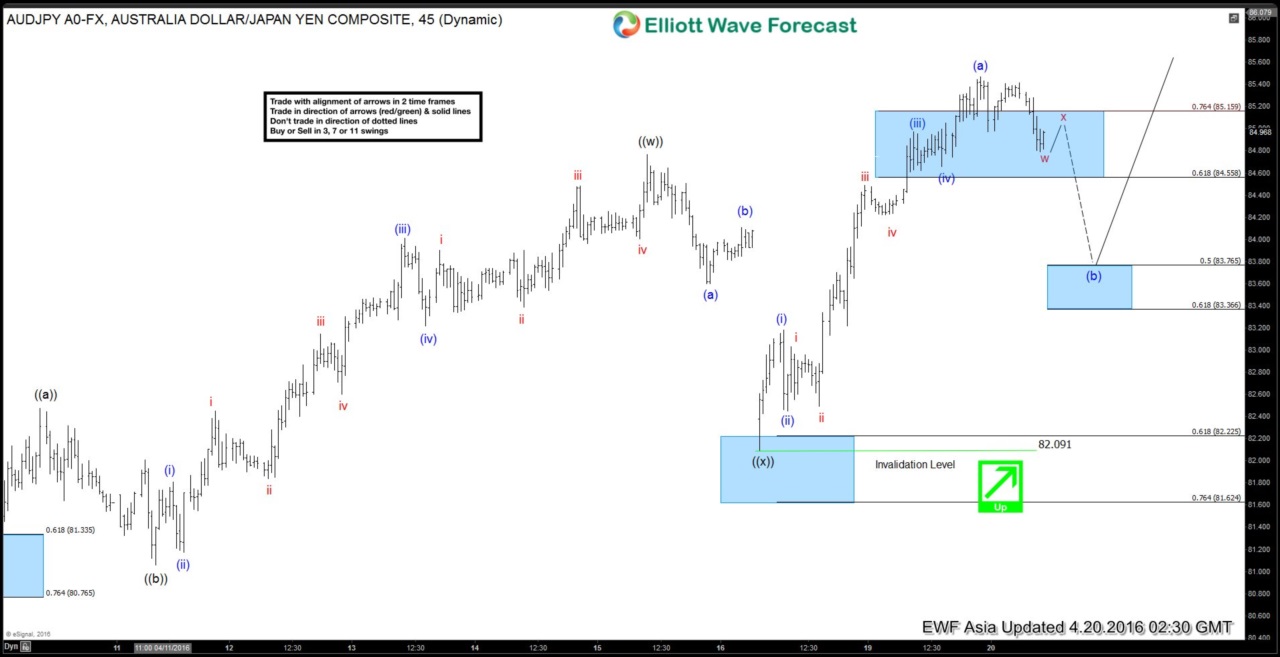
AUDJPY Short-term Elliott Wave Analysis 4.20.2016
Read MoreShort term Elliottwave structure suggests that dip to 80.66 ended wave (X). Rally from there ended wave ((w)) flat at 84.77, wave ((x)) pullback ended at 82.09, and pair has resumed the rally higher in wave ((y)) of (Y). From wave ((x)) low at 82.09, rally is unfolding as a zigzag where wave (a) ended at […]
-
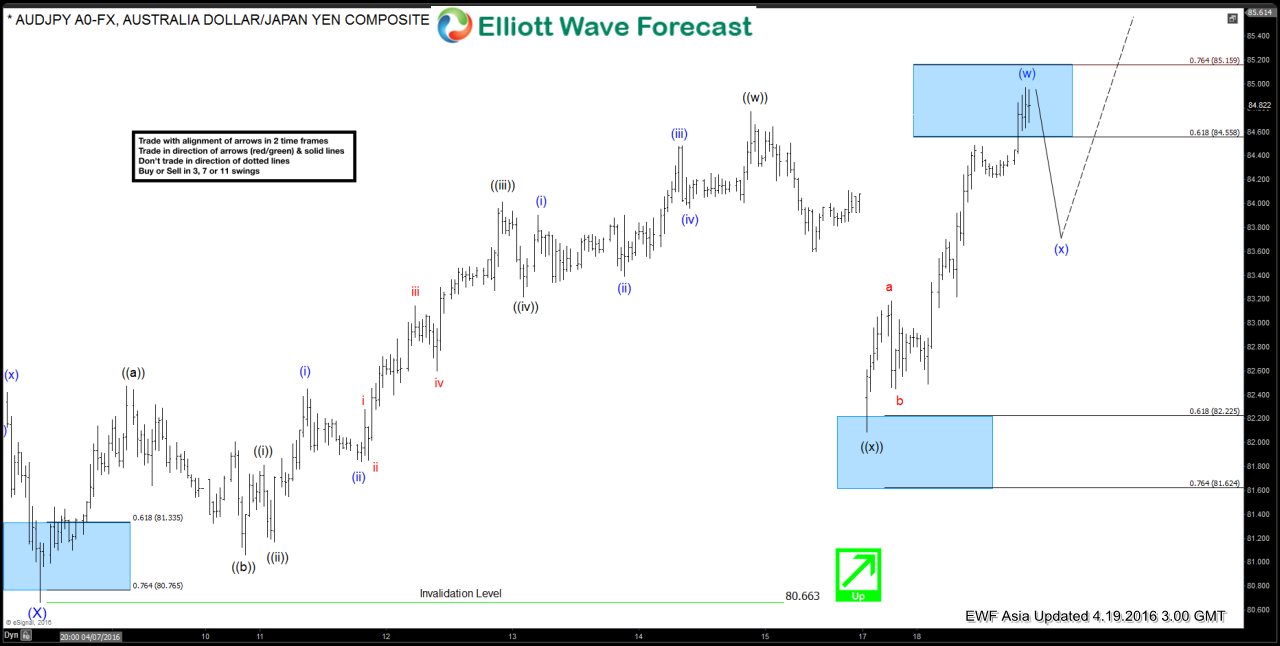
AUDJPY Short-term Elliott Wave Analysis 4.19.2016
Read MoreShort term Elliottwave structure suggests that dip to 80.66 ended wave (X). Rally from there ended wave ((w)) flat at 84.77, wave ((x)) pullback ended at 82.09, and pair has resumed the rally higher in wave ((y)) of (Y) towards 86.13 – 87.1 area. Near term, there’s enough number of swing to call wave (w) […]
-
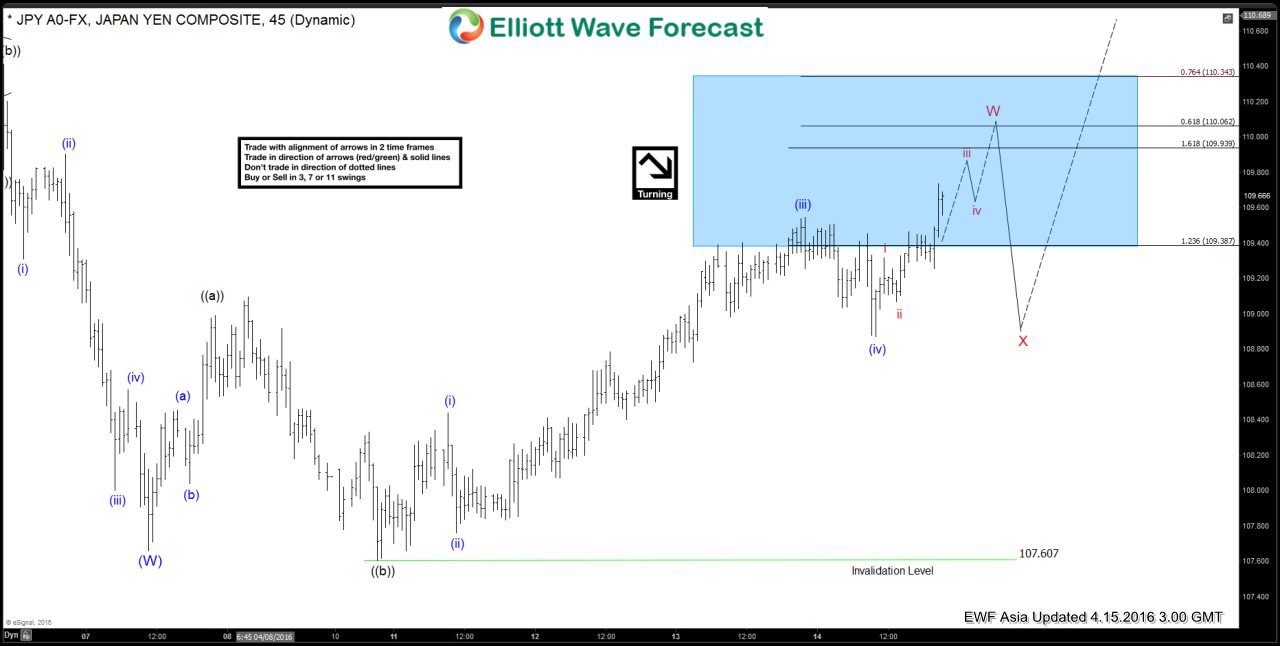
USDJPY Short-term Elliott Wave Analysis 4.15.2016
Read MoreShort term Elliottwave structure suggests that wave W rally from 4/7 low (107.66) is unfolding as a flat where wave ((a)) ended at 108.99, wave ((b)) ended at 107.6, and wave ((c)) is in progress with internals as 5 waves. Wave (v) of ((c)) is currently in progress towards 109.94 – 110.34 area and this […]
-
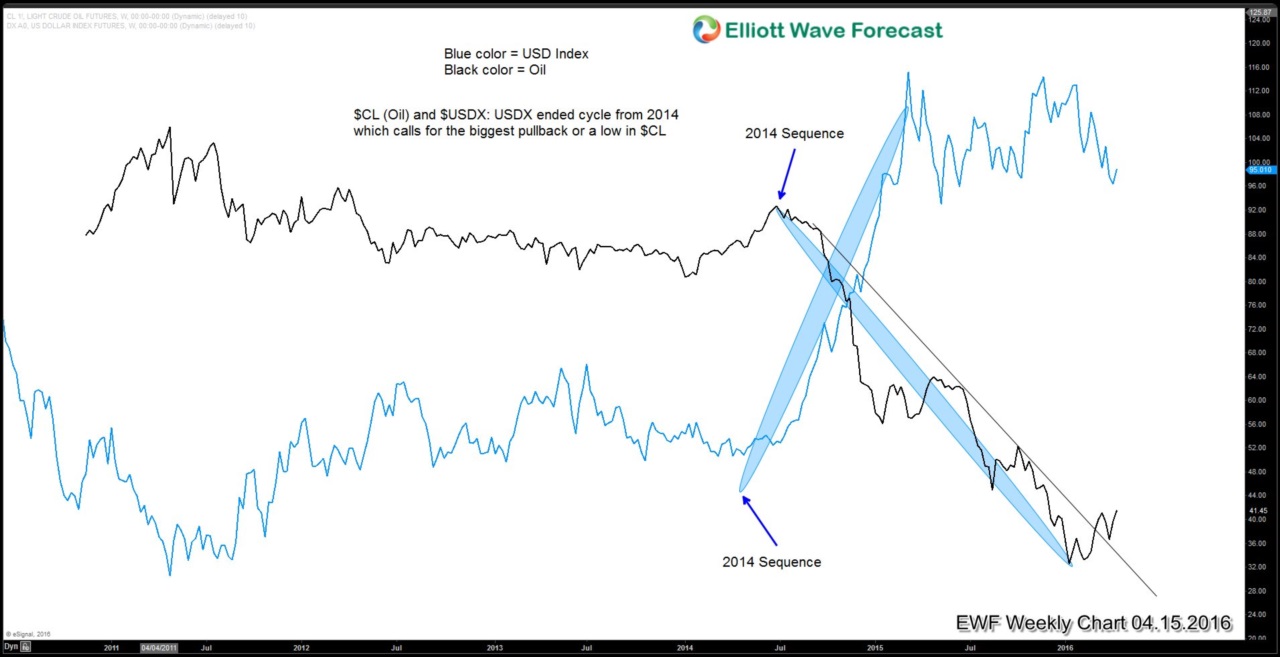
What to expect with Oil from Doha meeting on April 17
Read MoreIn our article dated Dec 13, 2015 titled “What OPEC decision means to Oil and $USDCAD” we wrote about the oil revolution; the rise of shale oil producers from North America and the OPEC cartel trying to fight against this threat by flooding the market with conventional oil to fight for market share and also drive […]
-
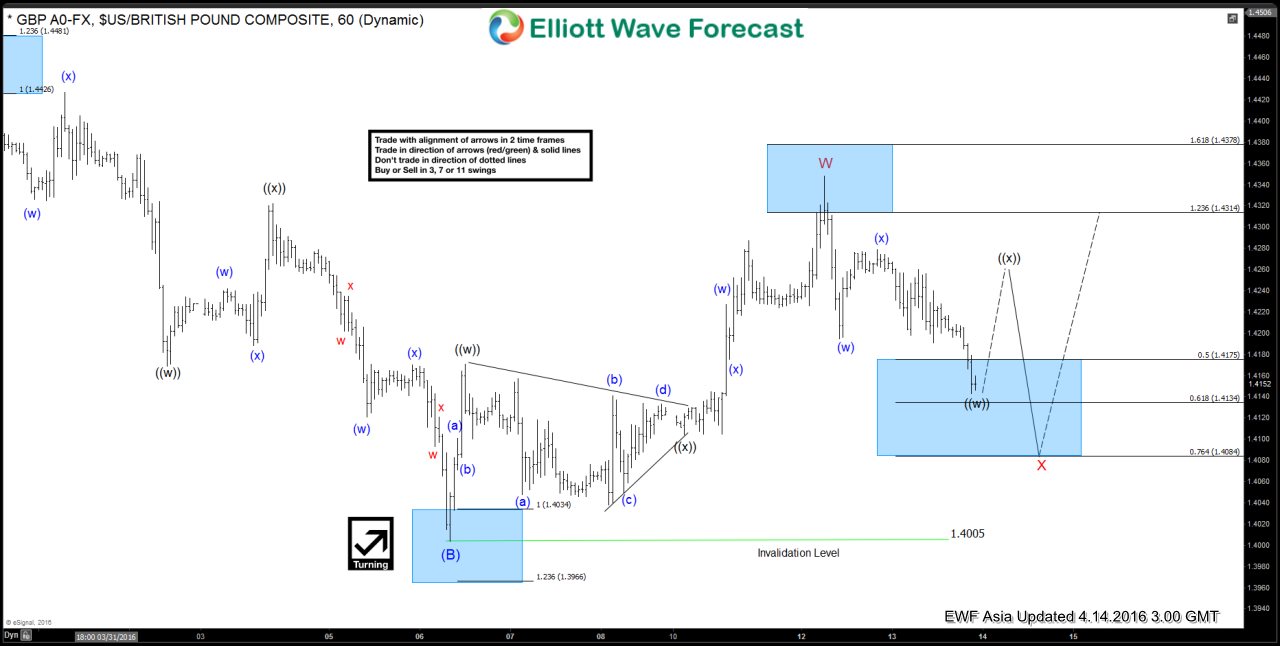
GBPUSD Short-term Elliott Wave Analysis 4.14.2016
Read MoreShort term Elliottwave structure suggests that the decline to 1.4 ended wave (B) of a larger degree triangle. Wave (C) rally is unfolding as a double three where wave W ended at 1.4348, and wave X pullback is in progress to correct the rally from 1.4 in 7 swing before turning higher again. The first three […]
-
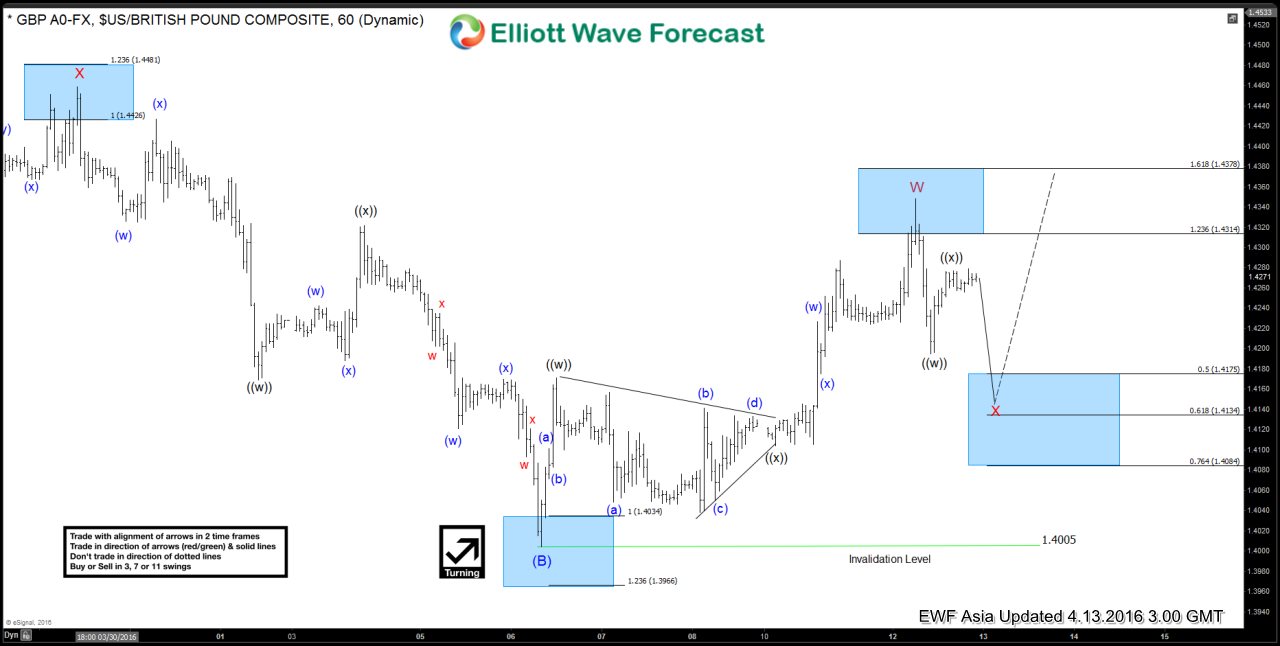
GBPUSD Short-term Elliott Wave Analysis 4.13.2016
Read MoreShort term Elliottwave structure suggests that the decline to 1.4 ended wave (B) of a larger degree triangle. Wave (C) rally is unfolding as a double three where wave W ended at 1.4348, and wave X pullback is in progress to correct the rally from 1.4 in 3, 7, or 11 swing before turning higher again. […]