-

USDCHF Trade from 7 Feb 2018 Live Trading Room
Read MoreUSDCHF Trade Video Clip from 7 Feb 2018 Live Trading Room USDCHF 1 Hour Elliott Wave Chart 2.7.2018 USDCHF shows an incomplete bearish sequence from 12.15.2016 high, favoring further downside. On Feb 7, we told members in Live Trading Room that we want to sell wave 4 bounce in 3, 7, or 11 swing […]
-

Elliott Wave Analysis: Gold Favored Higher Against 1306.96
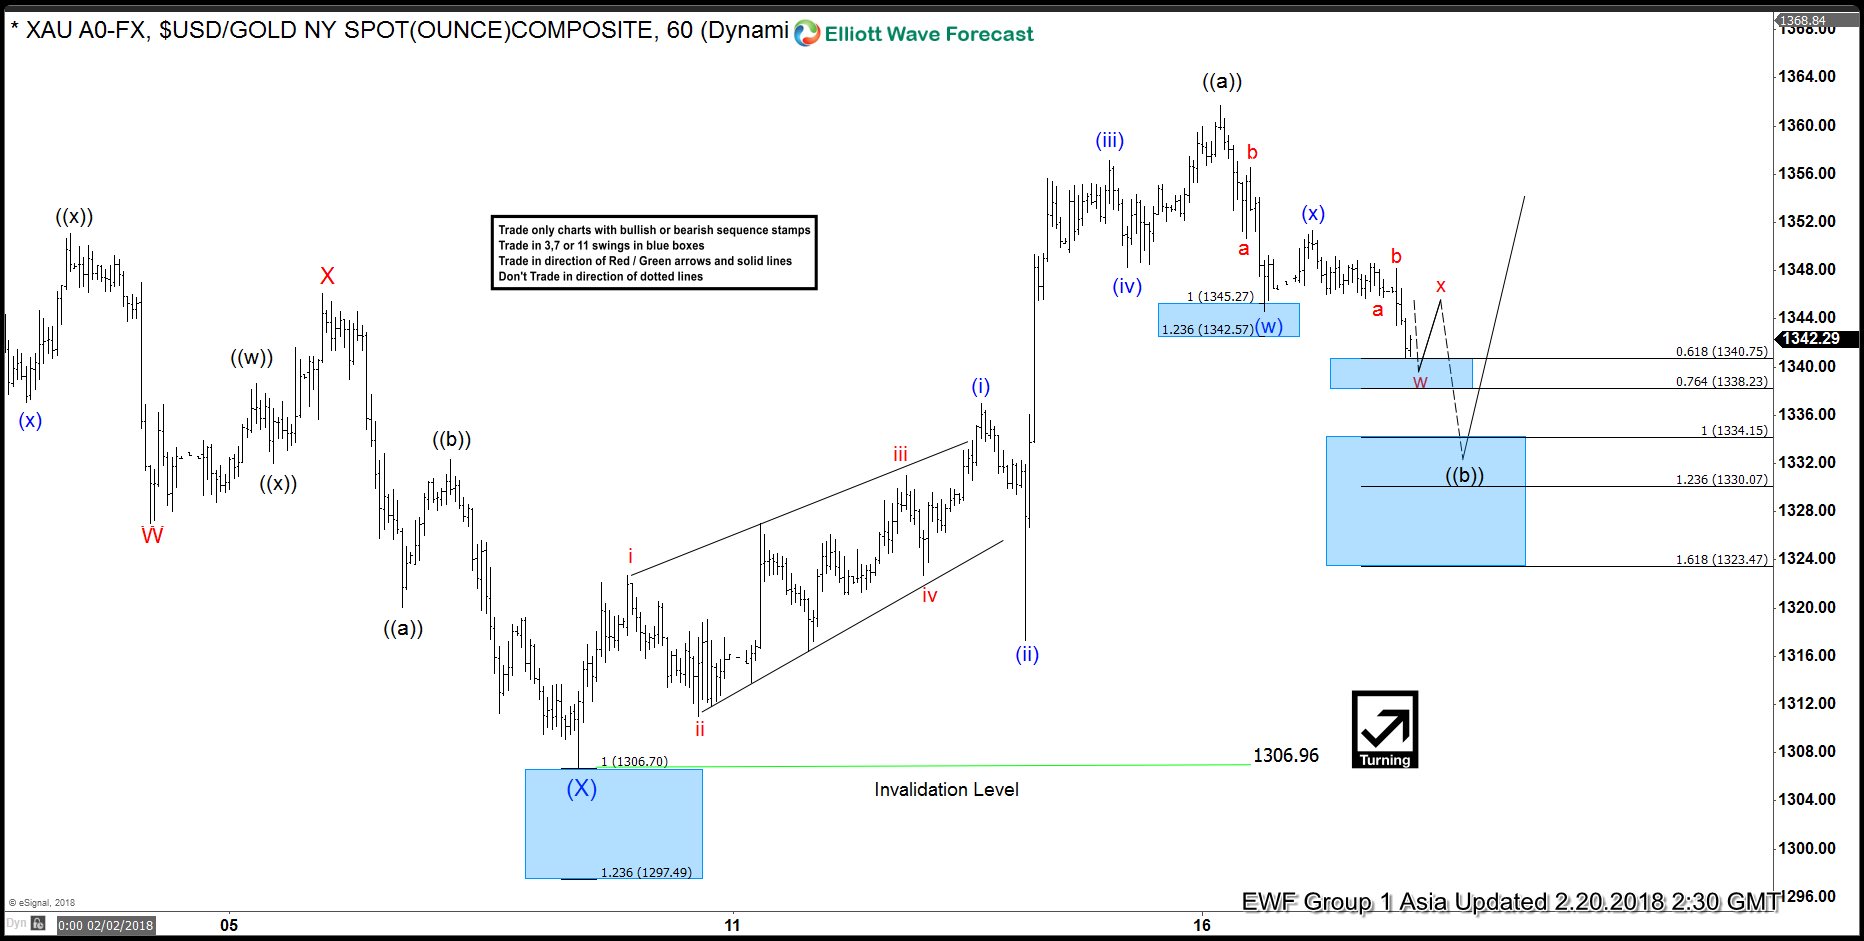
Read MoreGold Short Term Elliott Wave view suggests that Intermediate wave (X) ended with the decline to 1306.96. Up from there, the yellow metal is rallying in 5 waves impulse Elliott Wave structure where Minutte wave (i) ended at 1337, Minutte wave (ii) ended at 1317.27, Minutte wave (iii) ended at 1357.12, Minutte wave (iv) ended at […]
-

Elliott Wave Analysis: DXY Near Turn
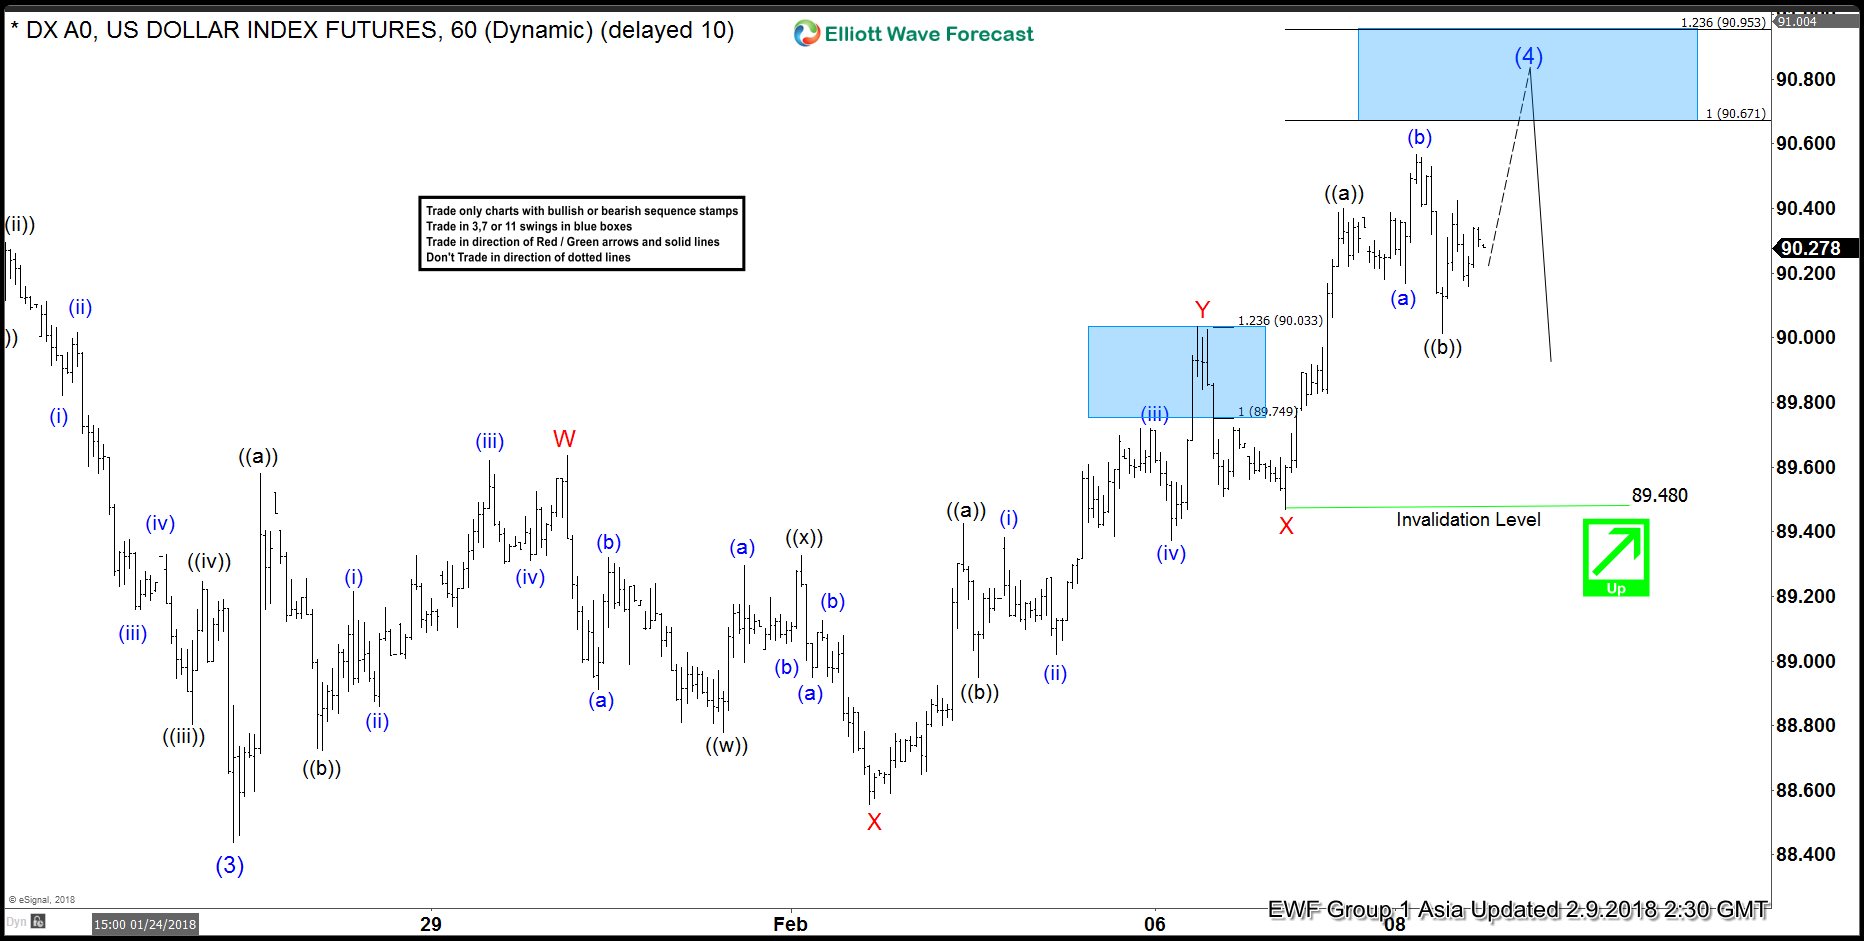
Read MoreDXY Short Term Elliott Wave view suggests that Intermediate wave (3) ended at 88.44. Up from there, Intermediate wave (4) bounce is in progress as a triple three Elliott Wave structure. Rally to 89.64 ended Minor wave W, Minor wave X ended at 88.55, Minor wave Y ended at 90.03 and Minor second wave X ended […]
-

Elliott Wave Analysis: DXY extended correction as triple three
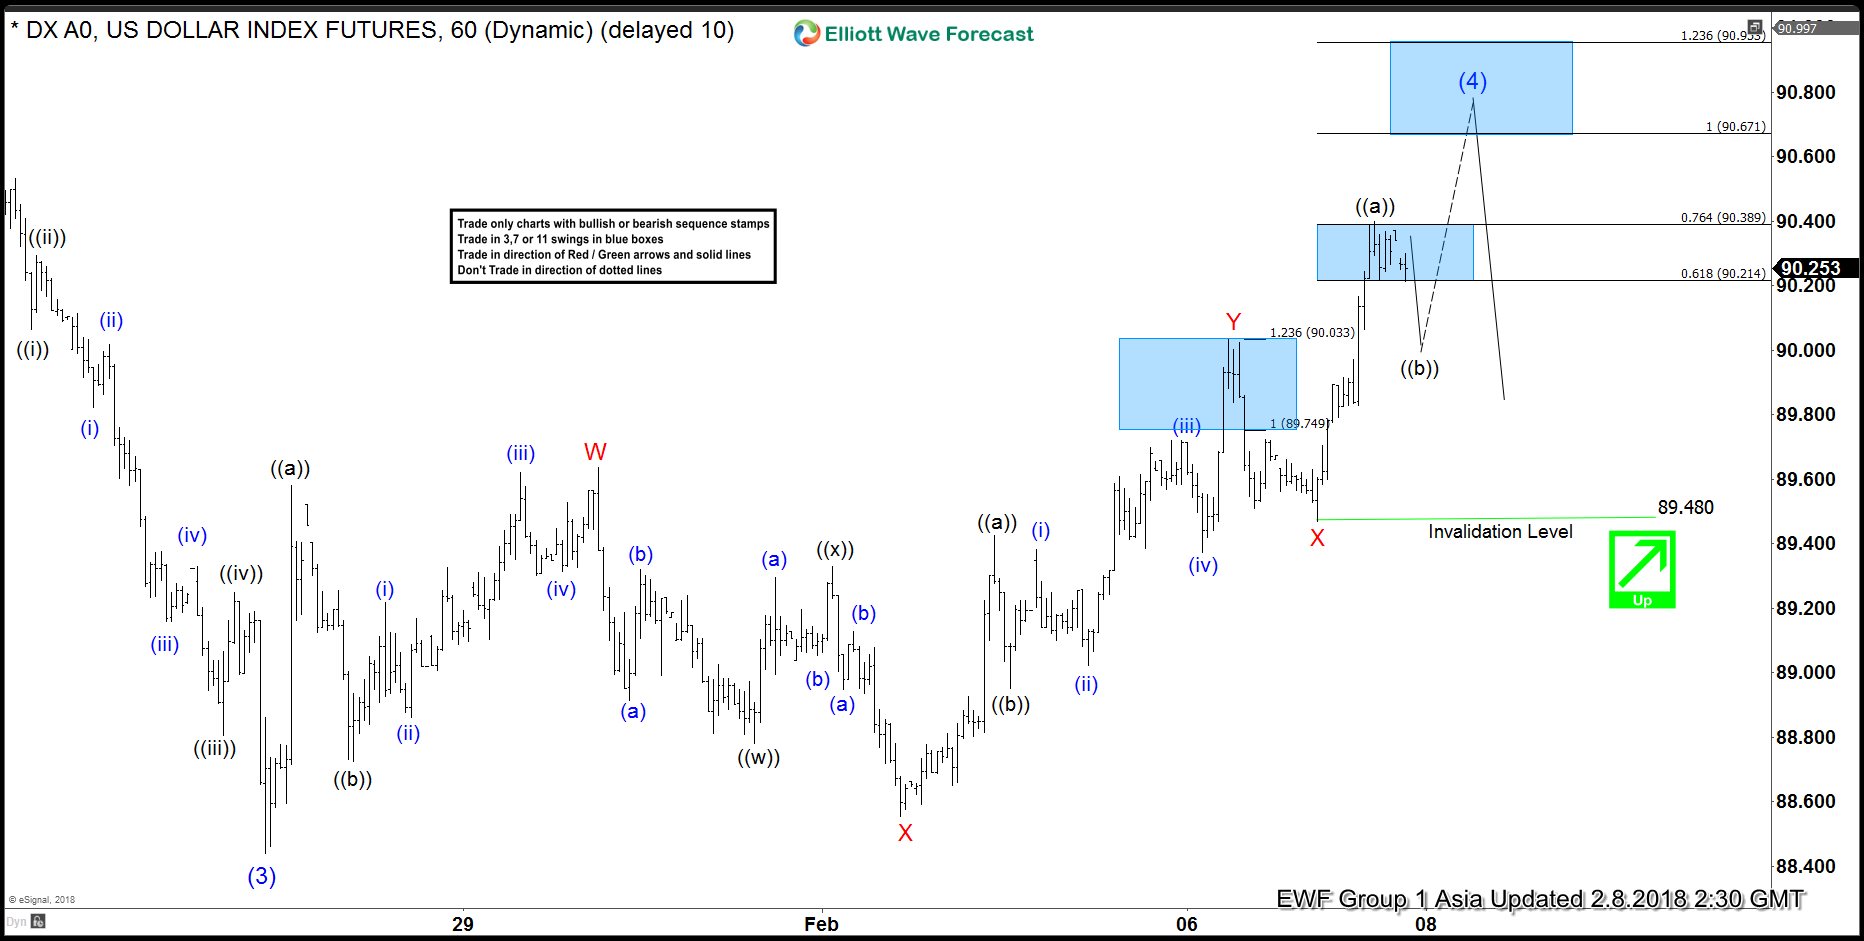
Read MoreDXY Short Term Elliott Wave view suggests that the decline to 88.44 ended Intermediate wave (3). Up from there, correction in Intermediate wave (4) is in progress as a triple three Elliott Wave structure. Rally to 89.64 ended Minor wave W, decline to 88.55 ended Minor wave X, Minor wave Y ended at 90.03 and Minor […]
-

Elliott Wave Analysis: DXY ended correction
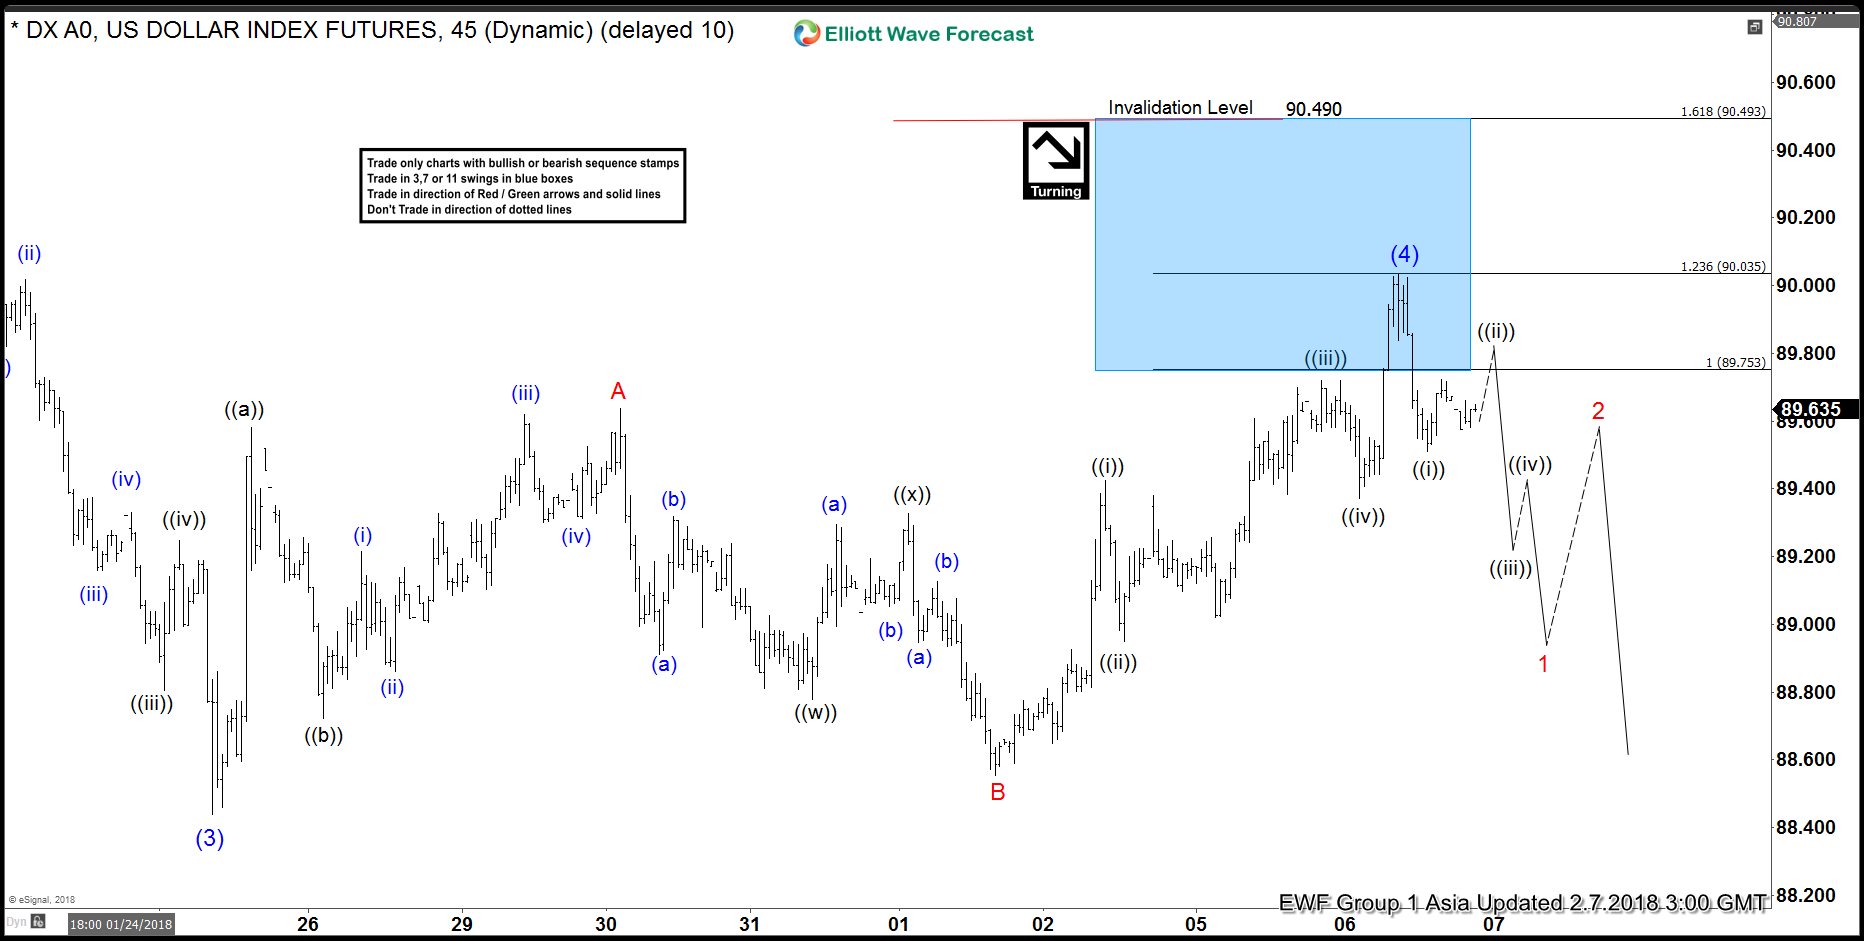
Read MoreDXY Short Term Elliott Wave view suggests that the decline to 88.44 ended Intermediate wave (3). Intermediate wave (4) bounce unfolded as a flat Elliott Wave structure. Up from 88.44, Minor wave A ended at 89.64, Minor wave B ended at 88.55, and Minor wave C of (4) appears complete at 90.03. Near term, while bounces […]
-

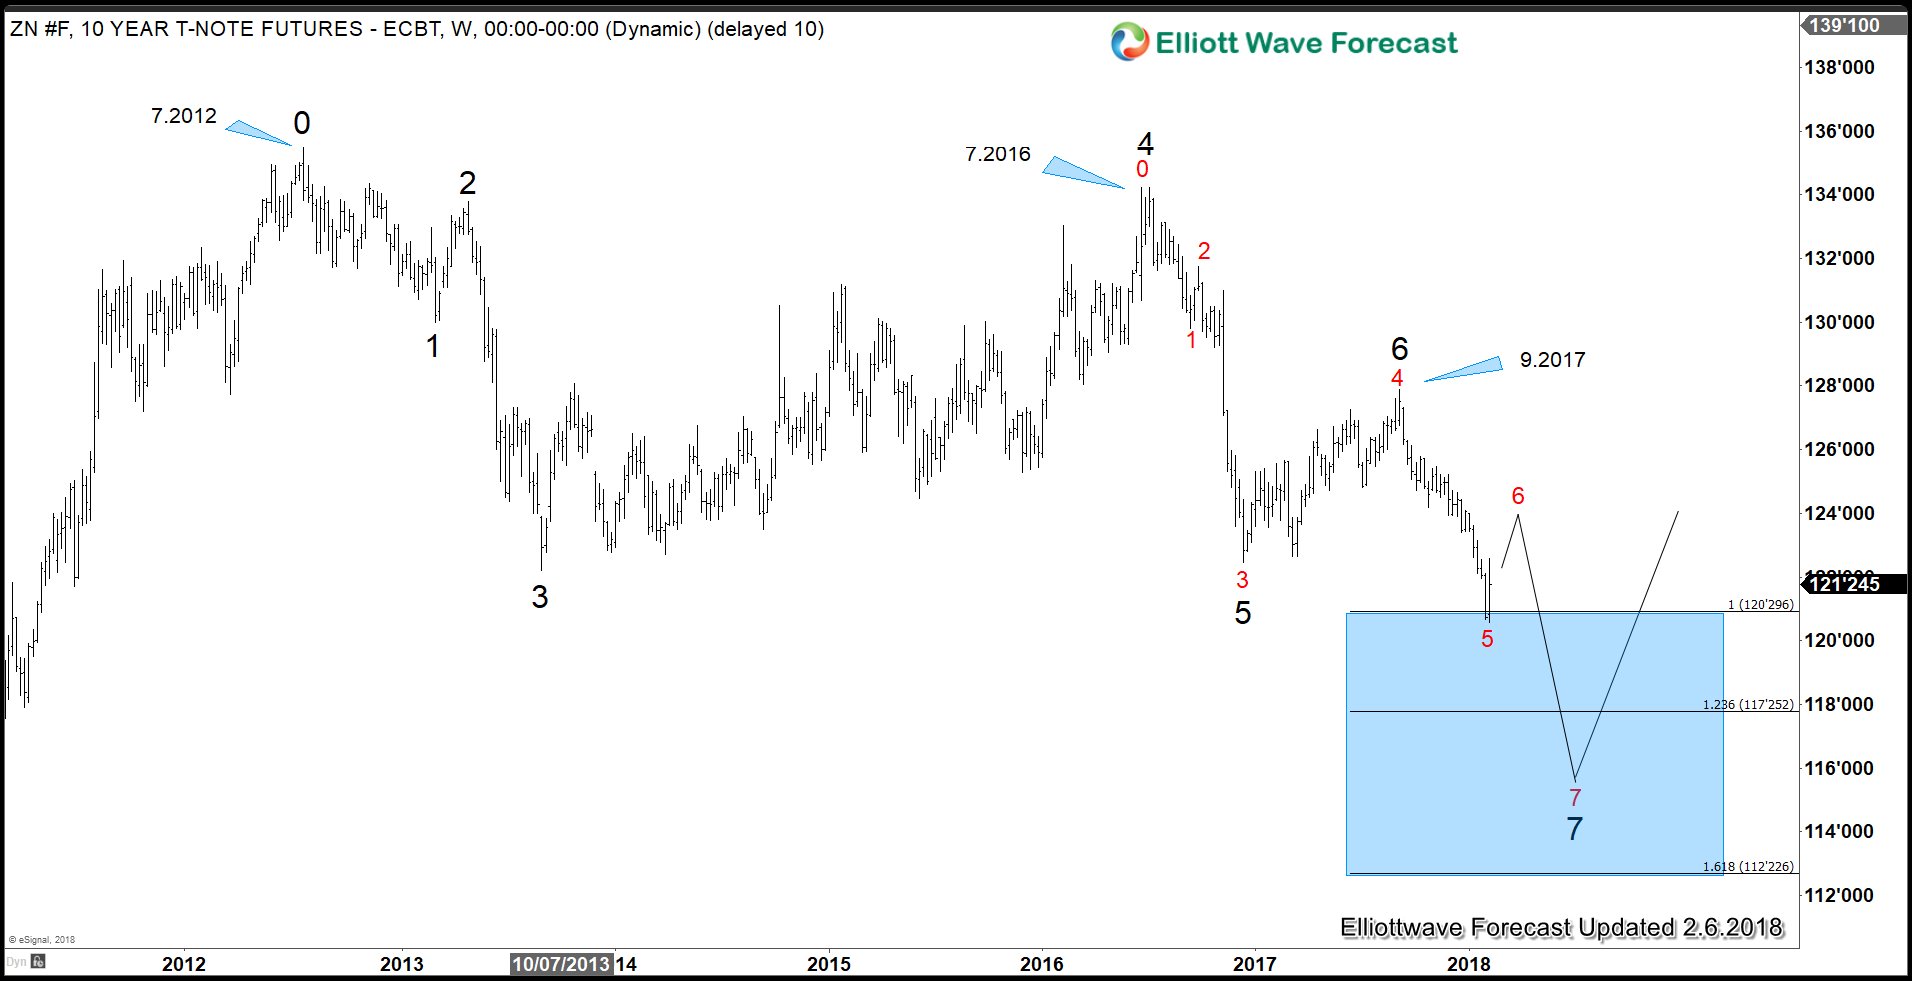
Is The 37 Year Bullish Bond Market Ending?
Read MoreThe bond market has enjoyed a strong bull market for nearly four decades with yields continuing to go lower. The bull market has been going on for so long that no current active fund manager can imagine what it looks like when interest rates were to be like the 1980s at 20%. If people in […]

