-

USDSGD Trade from 17 Jan 2018 Live Trading Room
Read MoreUSDSGD Trade Video Clip from 11 Jan 2018 Live Trading Room USDSGD shows a bearish sequence in the 4 hour chart and we would like to sell bounces in the pair in 3-7-11 swing. We waited for a 3 swing correction up to sell and told members to sell it at 1.327 (the 50% […]
-

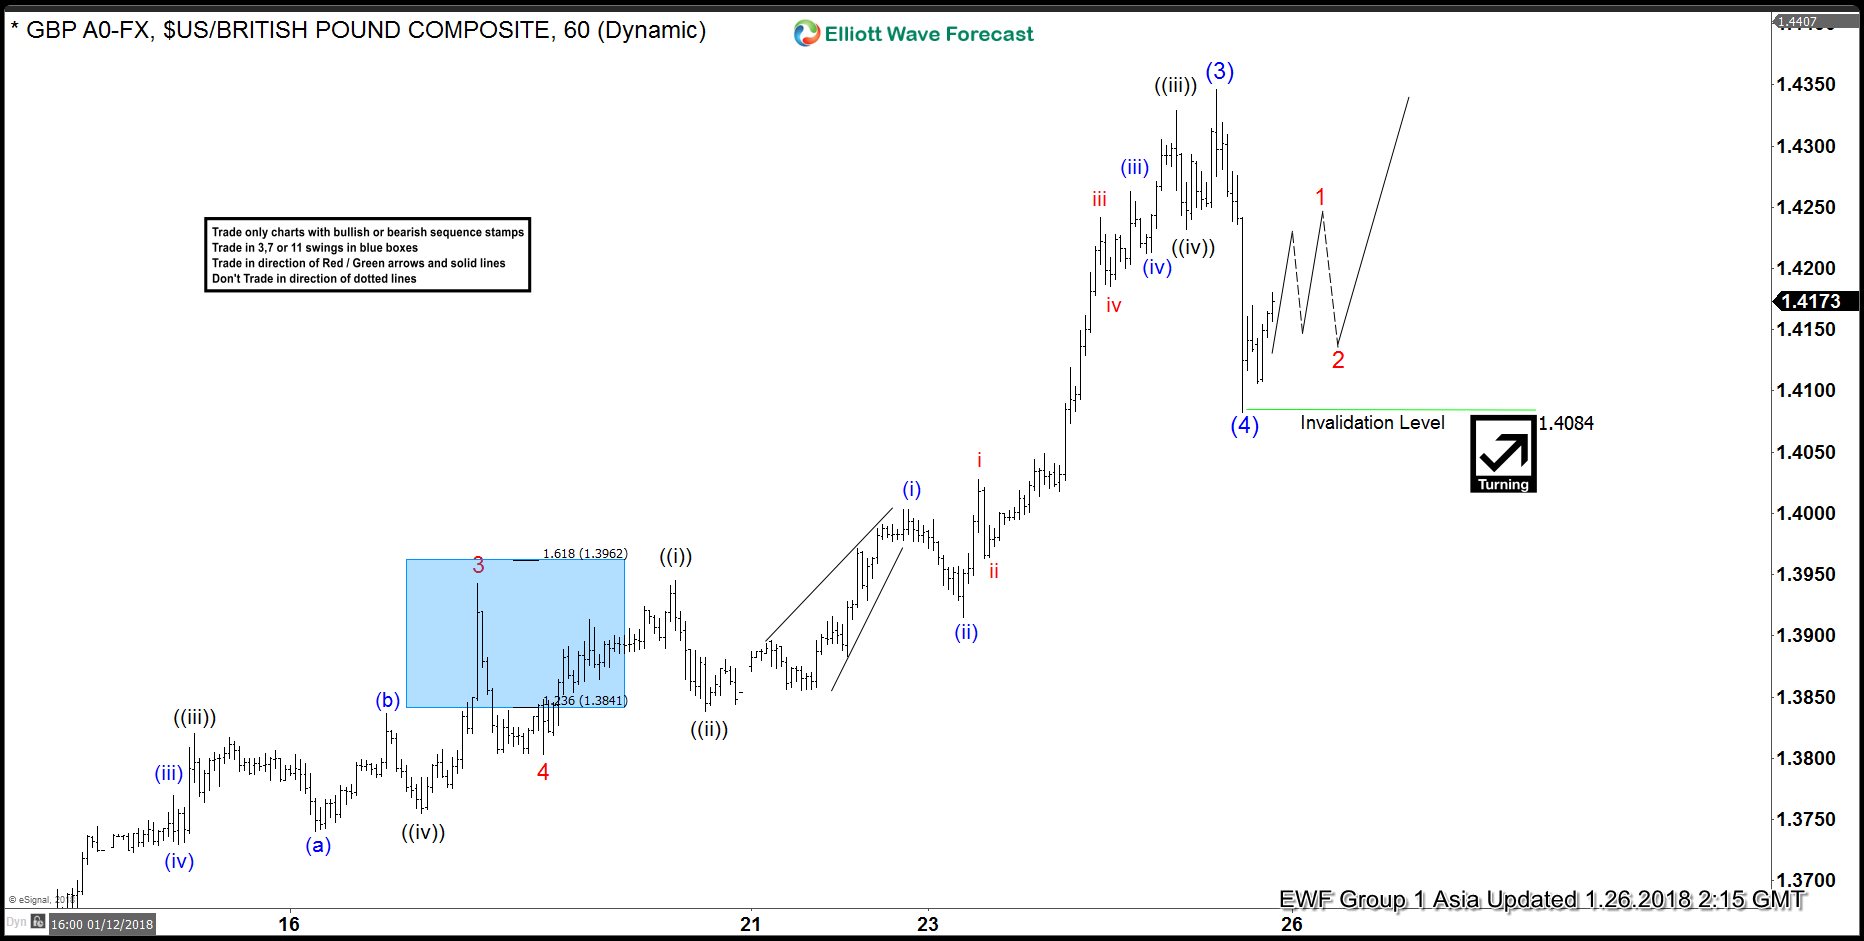
Elliott Wave Analysis: GBPUSD ended wave (4) correction
Read MoreGBPUSD Short Term Elliott Wave view suggests that pair ended Intermediate wave (2) at 1.33 on 16 December 2017. Up from there, Intermediate wave (3) rally is unfolding as 5 waves impulse Elliott Wave structure where Minor wave 1 ended at 1.3613, Minor wave 2 ended at 1.3456, Minor wave 3 ended at 1.3943, Minor wave 4 […]
-

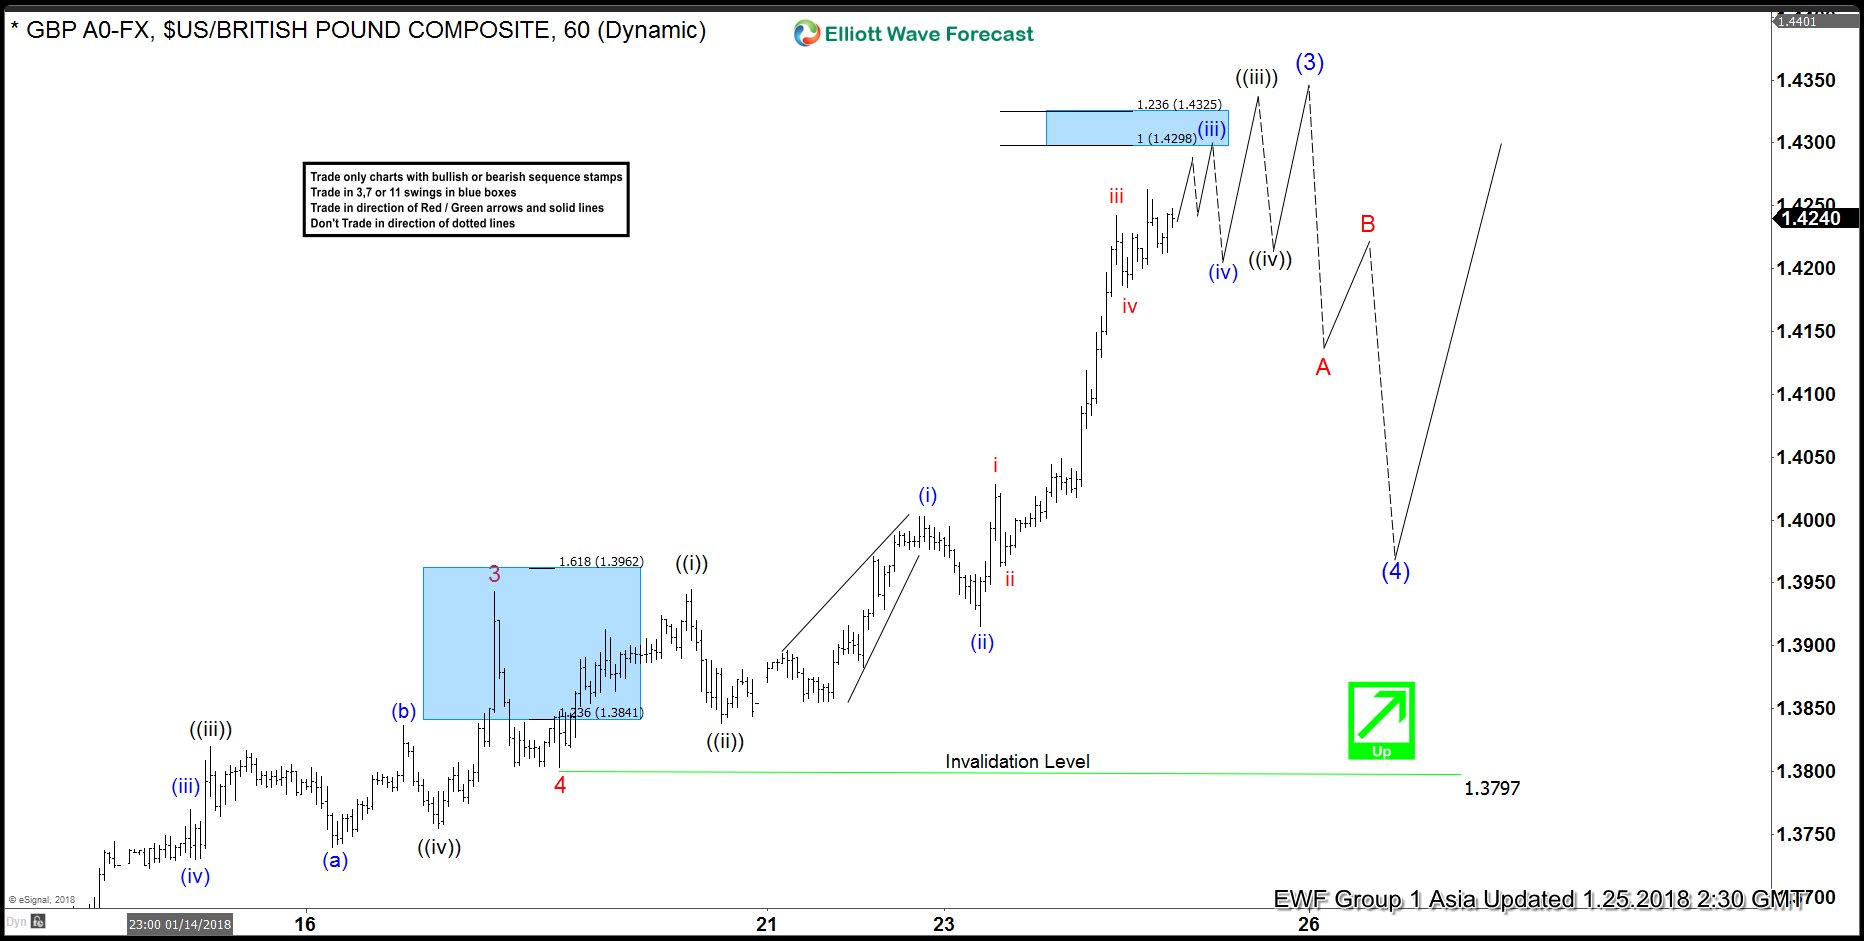
Elliott Wave Analysis: GBPUSD still within wave (3)
Read MoreGBPUSD Short Term Elliott Wave view suggests that the rally from 16 December 2017 low is unfolding as 5 waves impulse Elliott Wave structure. Up from 16 December 2017 low (1.33), Minor wave 1 ended at 1.3613, Minor wave 2 ended at 1.3456, Minor wave 3 ended at 1.3943, and Minor wave 4 ended at 1.3797. Minor […]
-

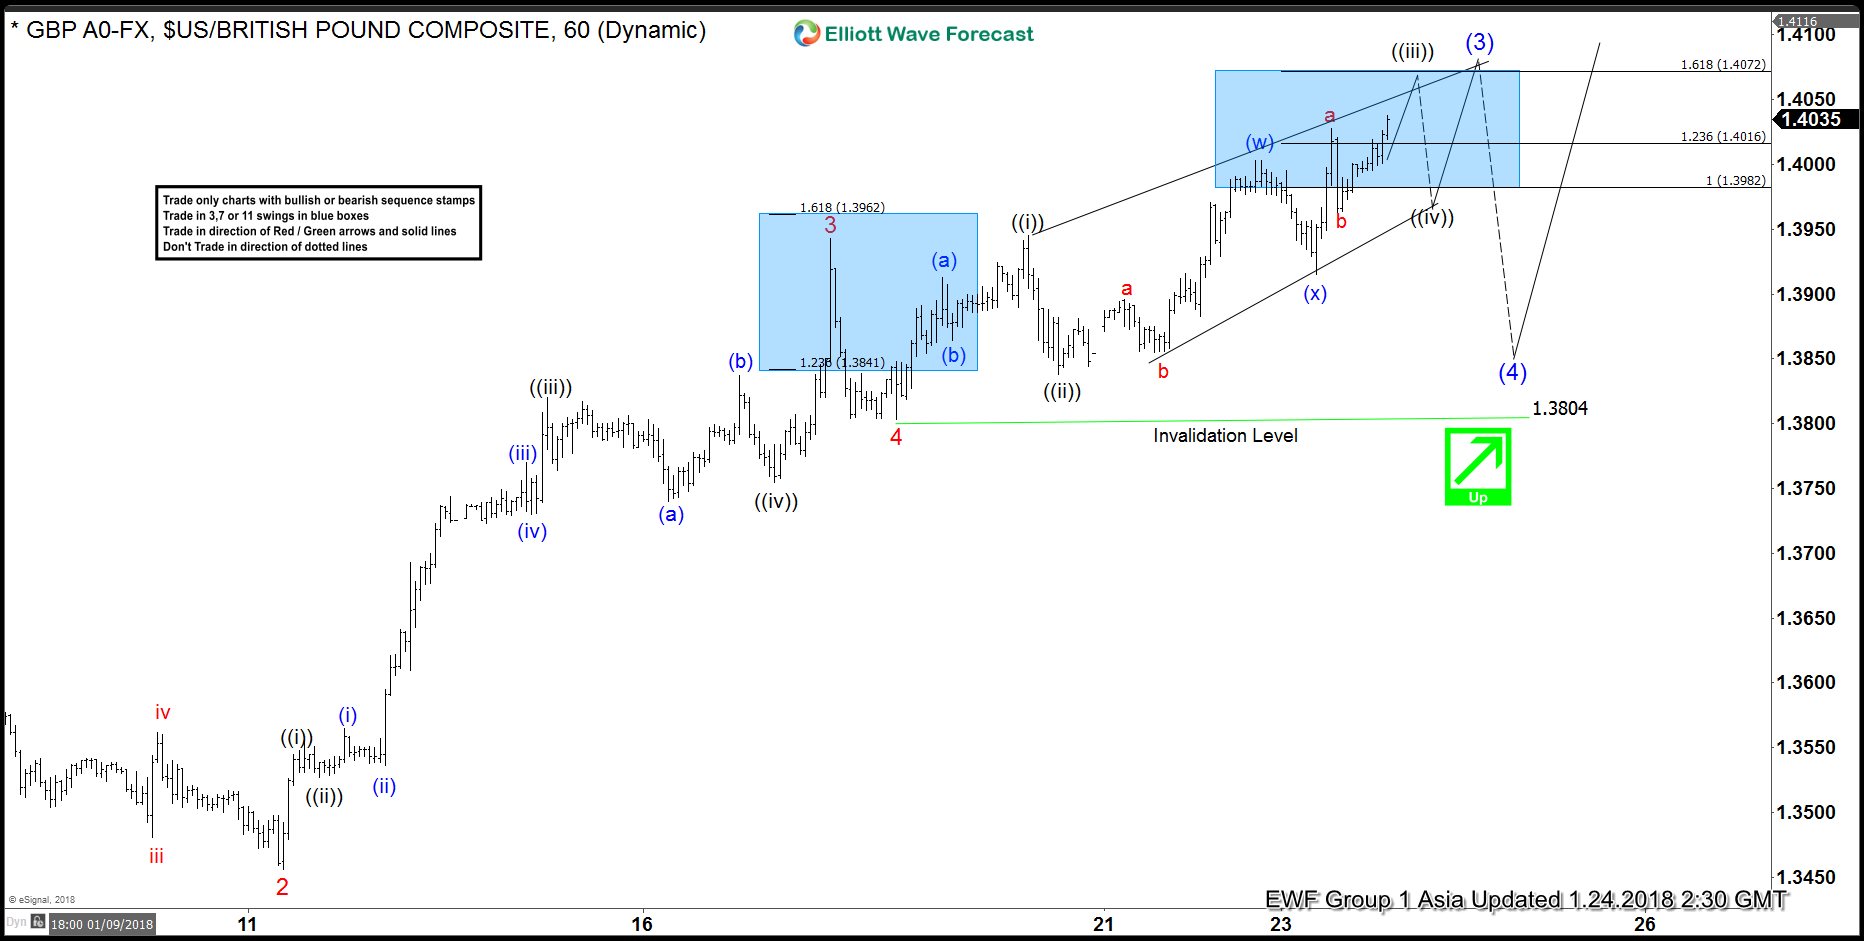
Elliott Wave Analysis: GBPUSD doing an ending diagonal
Read MoreGBPUSD Short Term Elliott Wave view suggests that the pair rallies as 5 waves impulse Elliott Wave structure from 16 December 2017 low. Up from 16 December 2017 low (1.33), Minor wave 1 ended at 1.3613, pullback to 1.3456 ended Minor wave 2, rally to 1.3943 ended Minor wave 3, and Minor wave 4 ended at 1.3803. […]
-

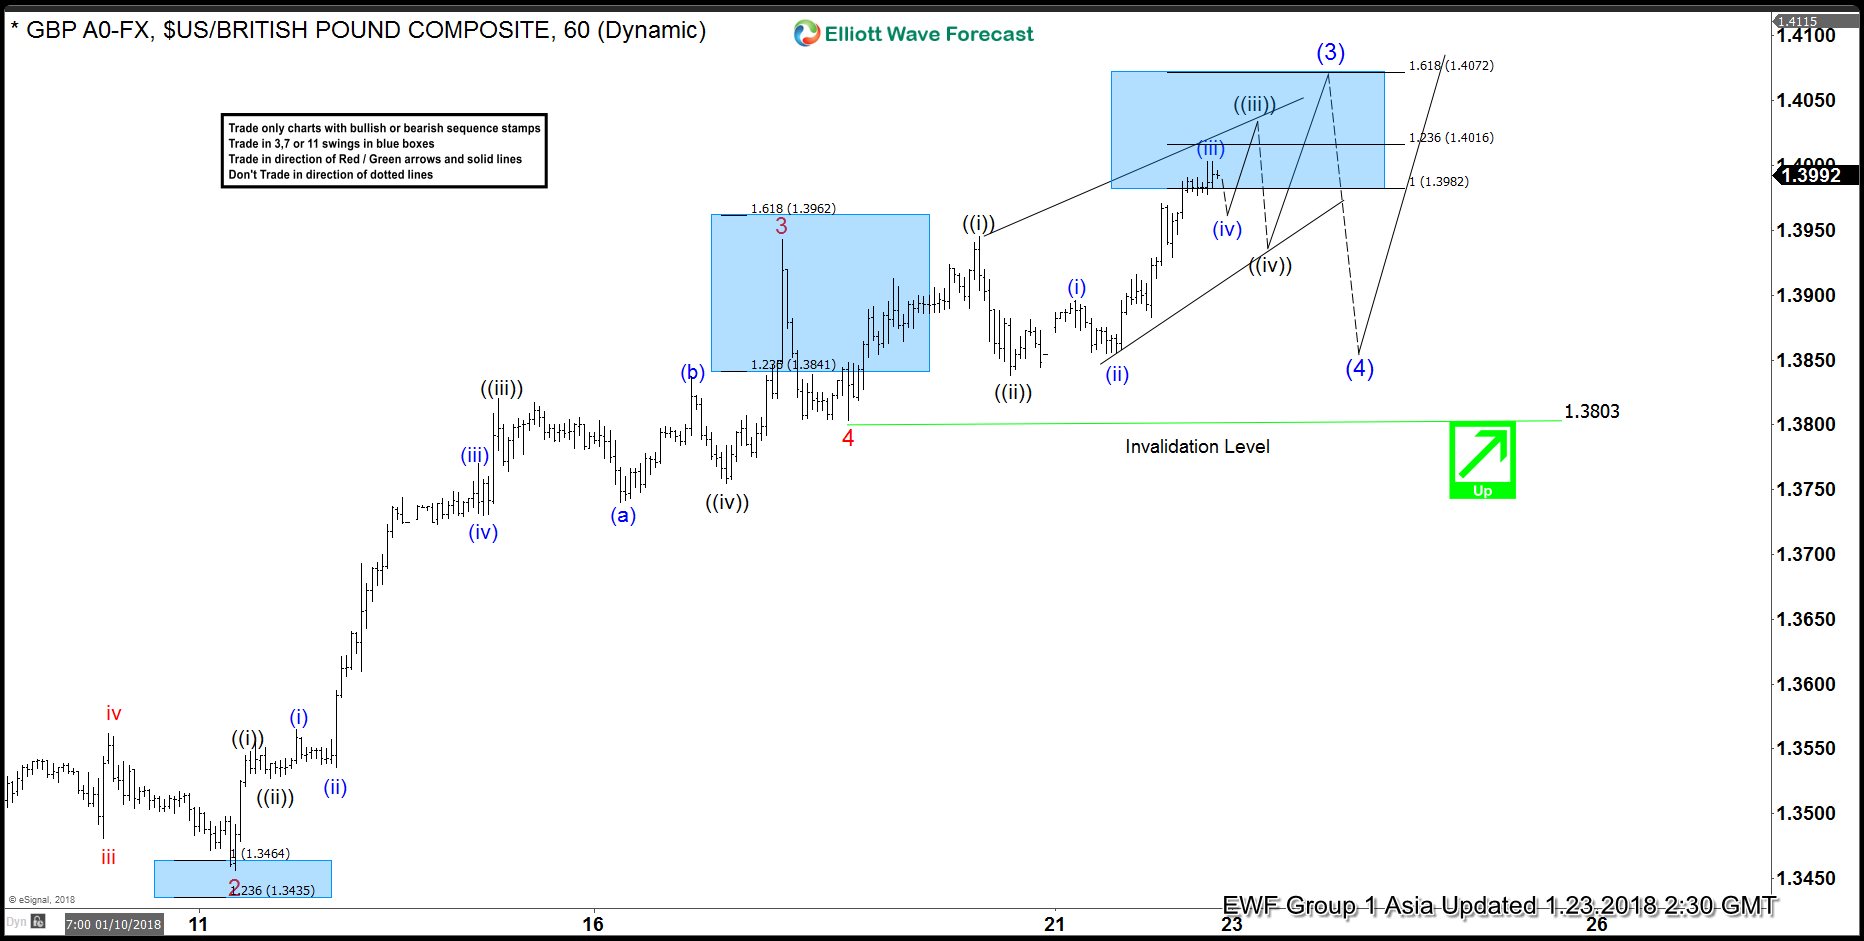
GBPUSD Elliott Wave Analysis: More Upside Expected
Read MoreGBPUSD Short Term Elliott Wave view suggests that rally from 16 December 2017 low is unfolding as 5 waves impulse Elliott Wave structure. Up from 16 Dec 2017 low (1.33), Minor wave 1 ended at 1.3613, Minor wave 2 ended at 1.3456, Minor wave 3 ended at 1.3943, and Minor wave 4 ended at 1.3803. Pair has […]
-

AUDCAD Trade from 12 Jan 2018 Live Trading Room
Read MoreAUDCAD Trade Video Clip from 12 Jan 2018 Live Trading Room We started always with the higher degree time frame and explained to members that the pair shows a bullish sequence from 6 Dec 2017 low (from 0.957) favoring more upside. The rally from there looks to be unfolding in a zigzag (5-3-5) and it […]


