
-
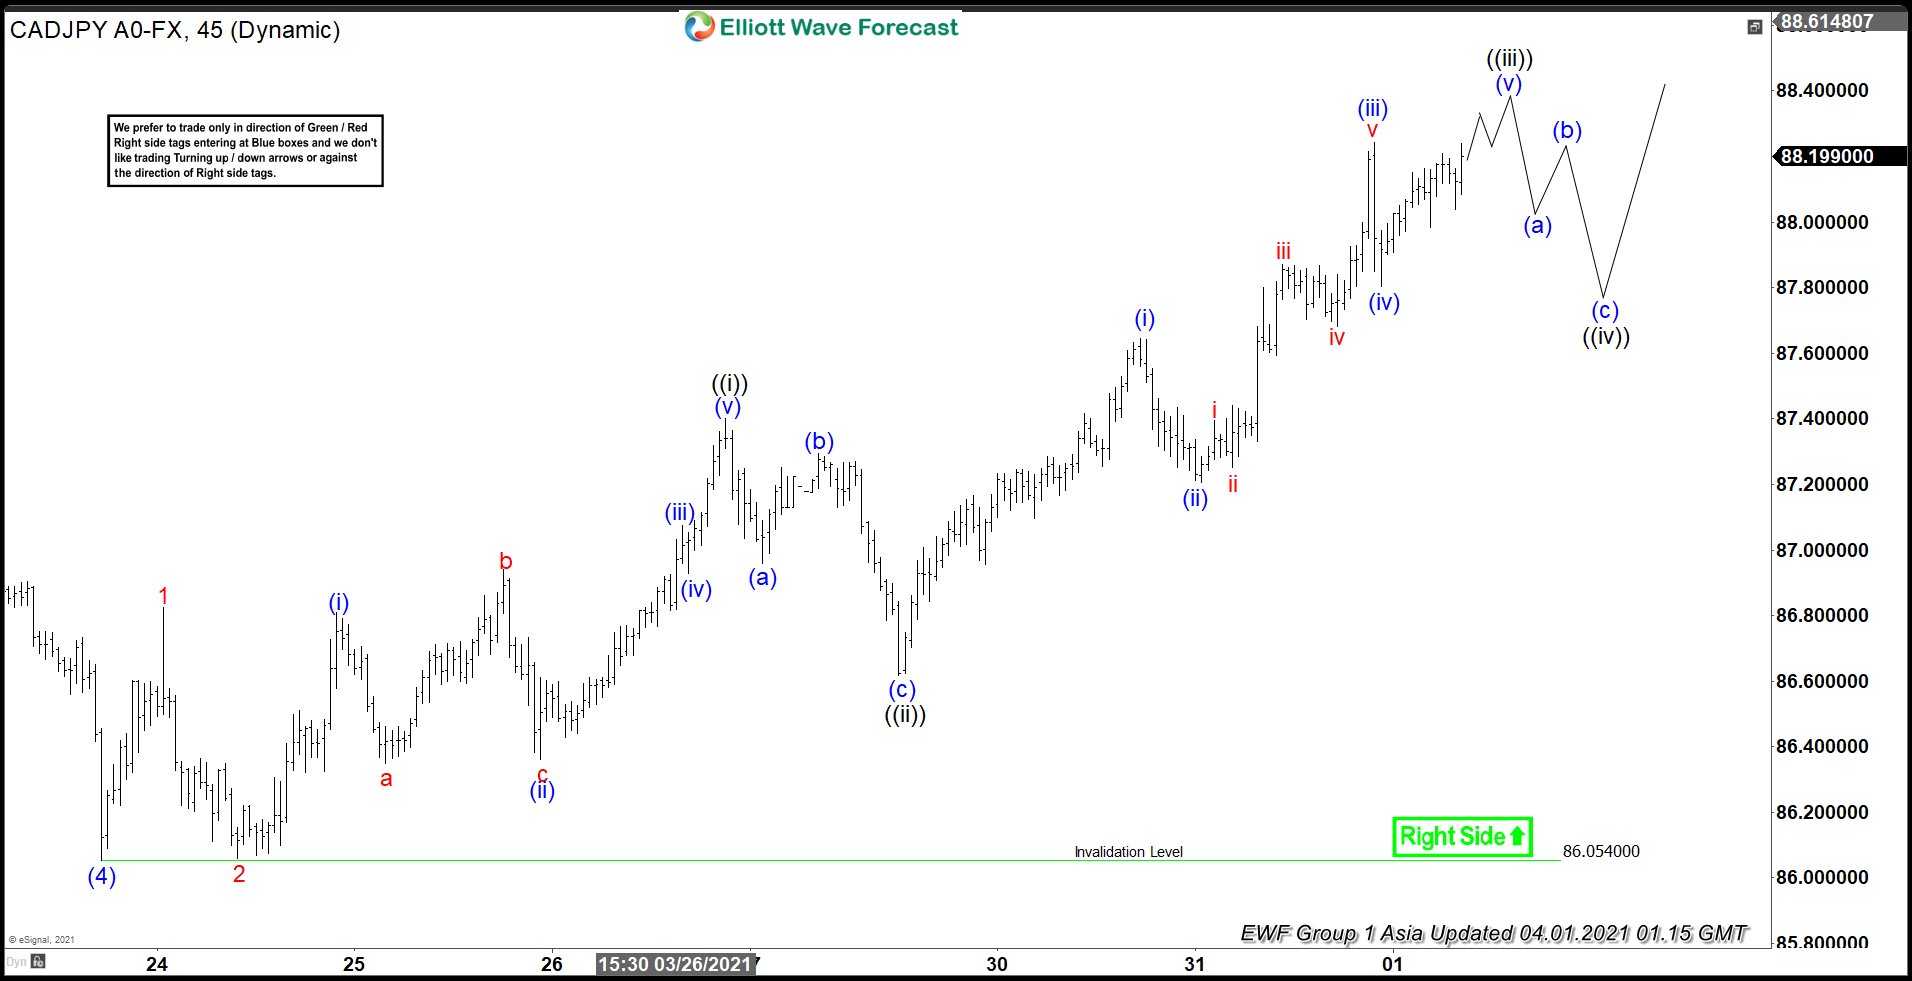
Elliott Wave View: CADJPY Short Term Dips Should Remain Supported
Read MoreCADJPY has extended higher in wave 5 and short term dips should remain supported. This article and video look at the Elliott Wave path.
-
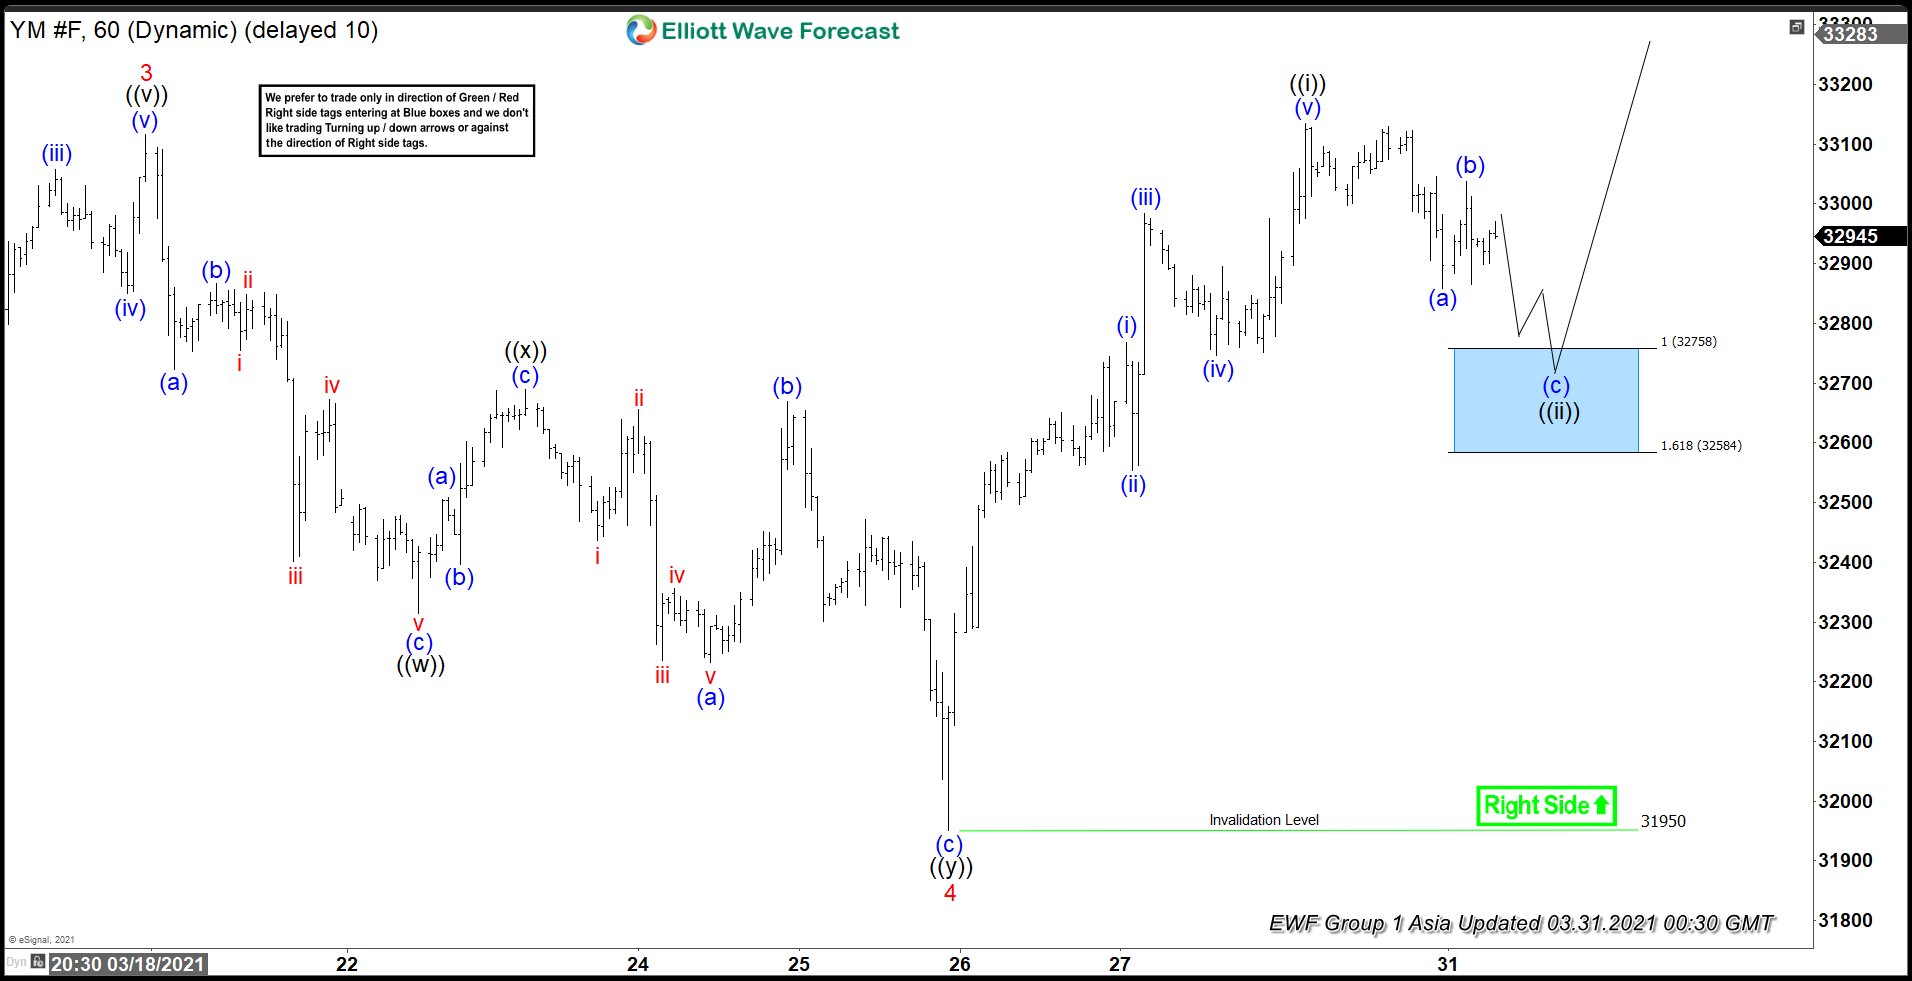
Elliott Wave View: Dow Futures (YM) Extends Higher
Read MoreDow Futures (YM) has extended to new high and dips should find support in 3, 7, or 11 swing. This article and video look at the Elliott Wave path.
-
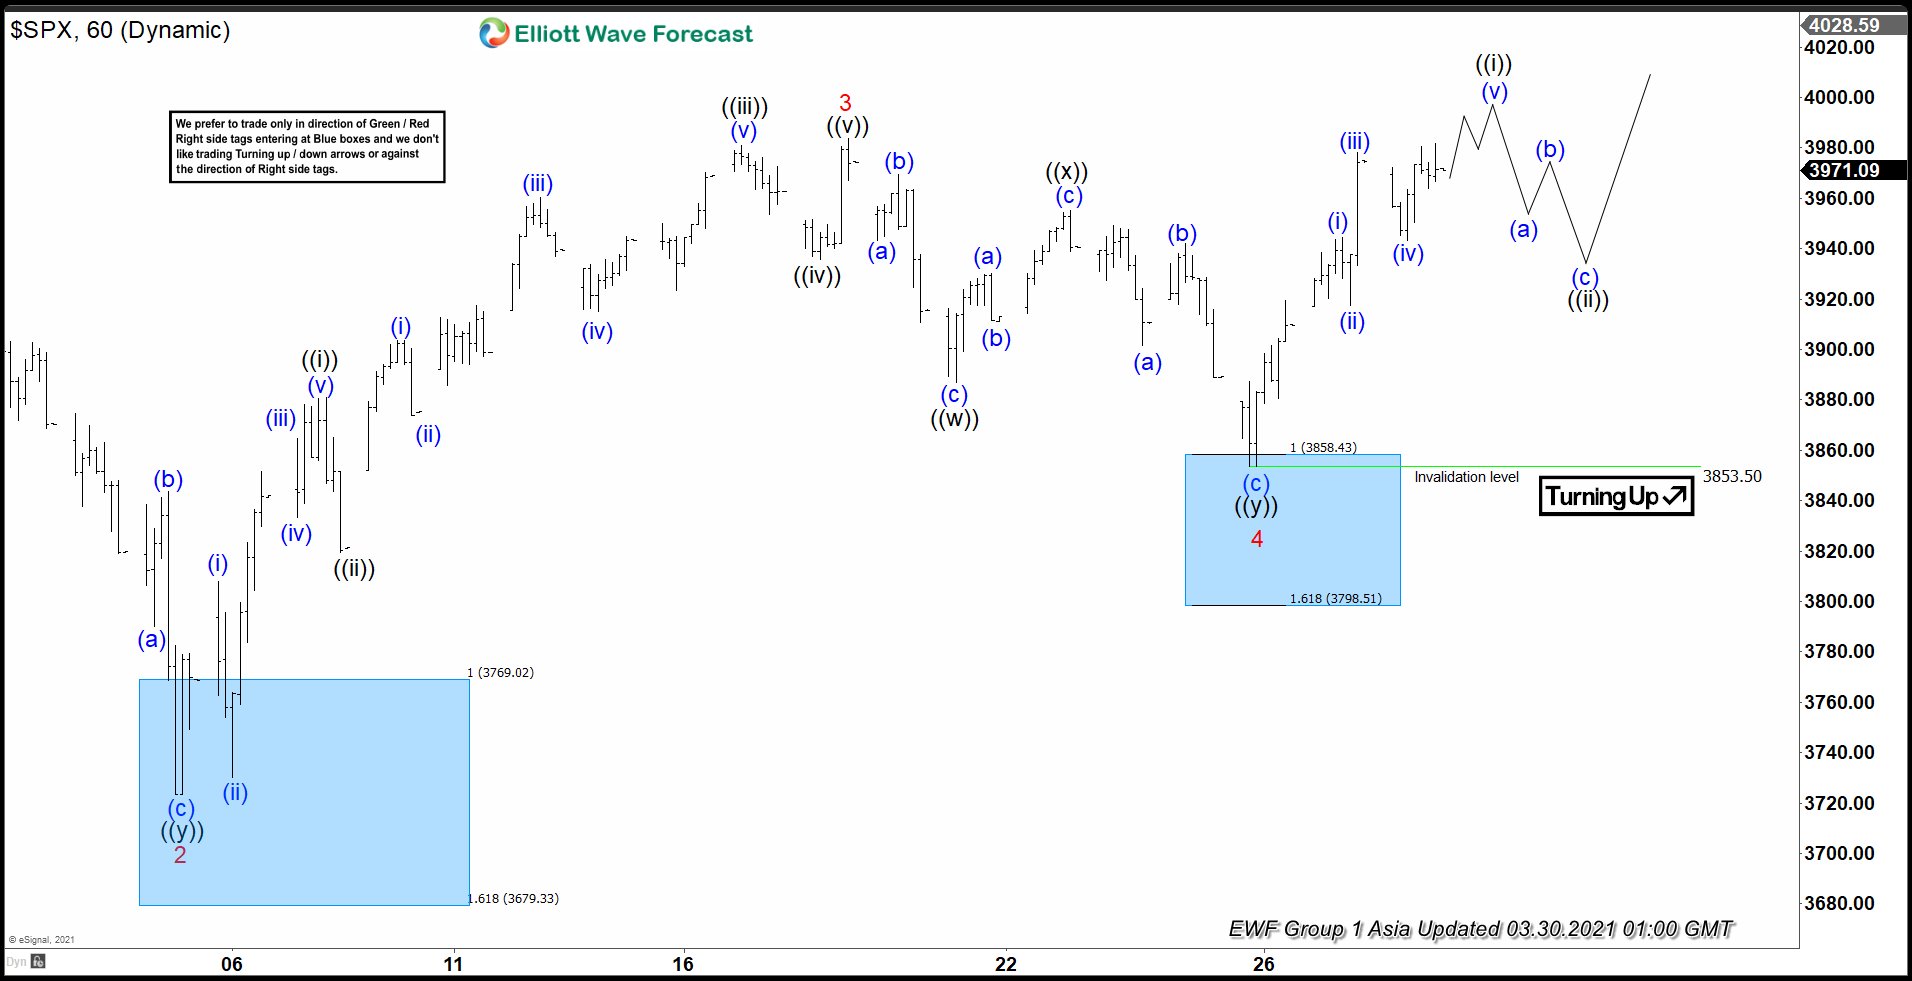
Elliott Wave View: SPX Looking for New All-Time High
Read MoreSPX is looking to extend into all time high. Dips should continue to find support in 3, 7, or 11 swing. This article & video look at the Elliott Wave path.
-
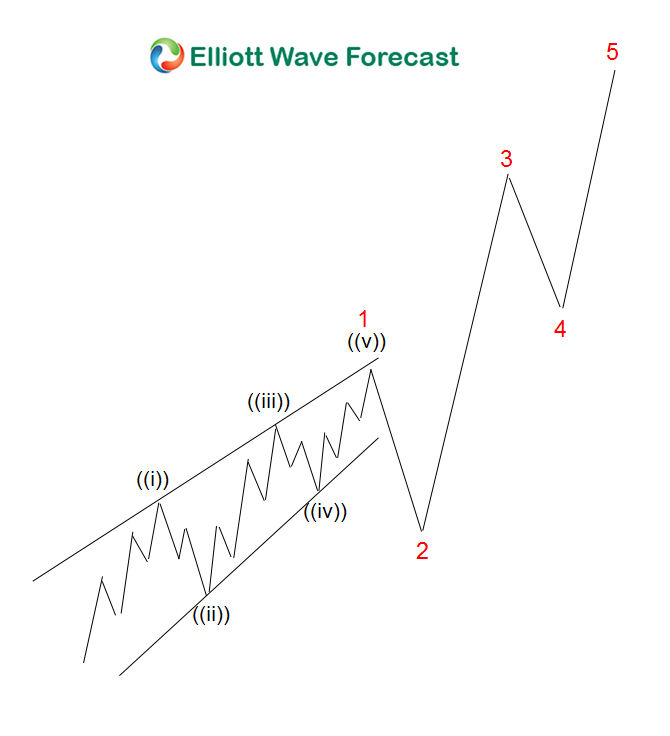
Elliott Wave Theory : Can Wave 4 overlap with Wave 1 ?
Read MoreThe Overlap Rule in Elliott Wave Theory: A Common Misconception One of the most misunderstood rules in Elliott Wave Theory is the overlap rule between wave 1 and 4. I have lost count how many times both members and non-members alike make a comment about our charts having an overlap between wave 1 and 4 […]
-
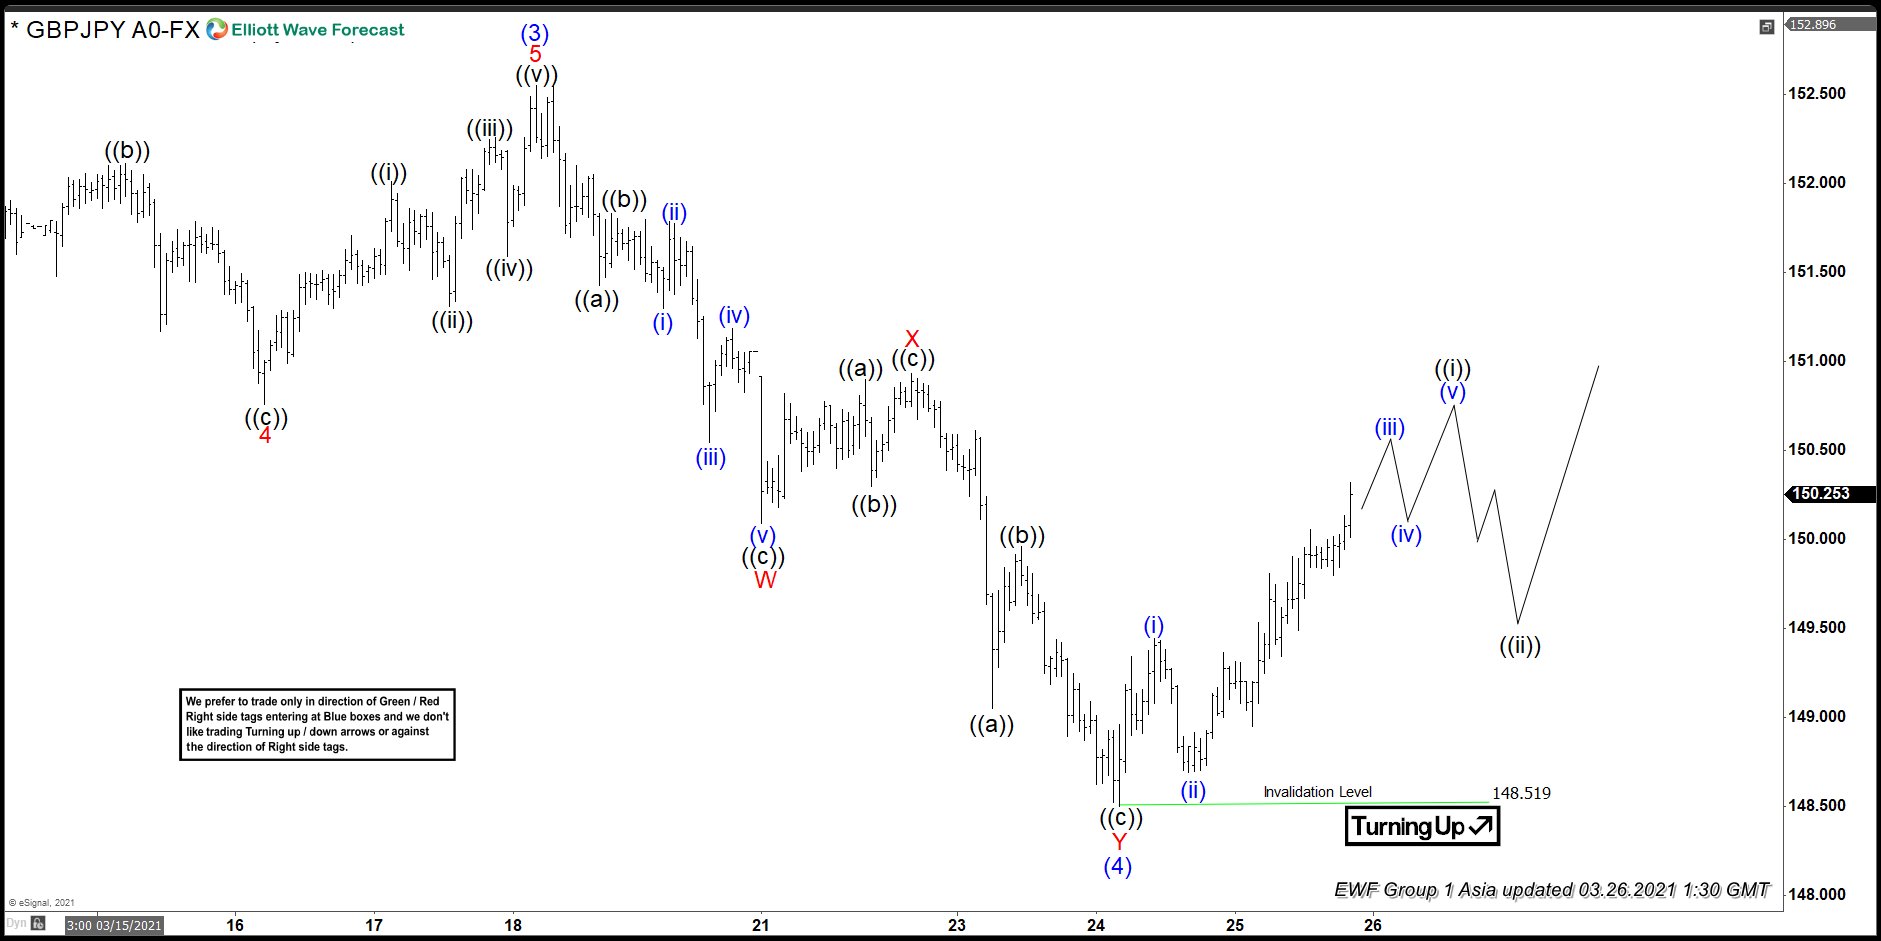
Elliott Wave View: GBPJPY Ended Correction
Read MoreRally from September 21, 2020 low in $GBPJPY is unfolding as a 5 waves impulse Elliott Wave structure. Up from September 21, 2020 low, wave (1) ended at 140.7 and pullback in wave (2) ended at 136.79. Pair resumed higher again and ended wave (3) at 152.55 as 1 hour chart below shows. Wave (4) […]
-
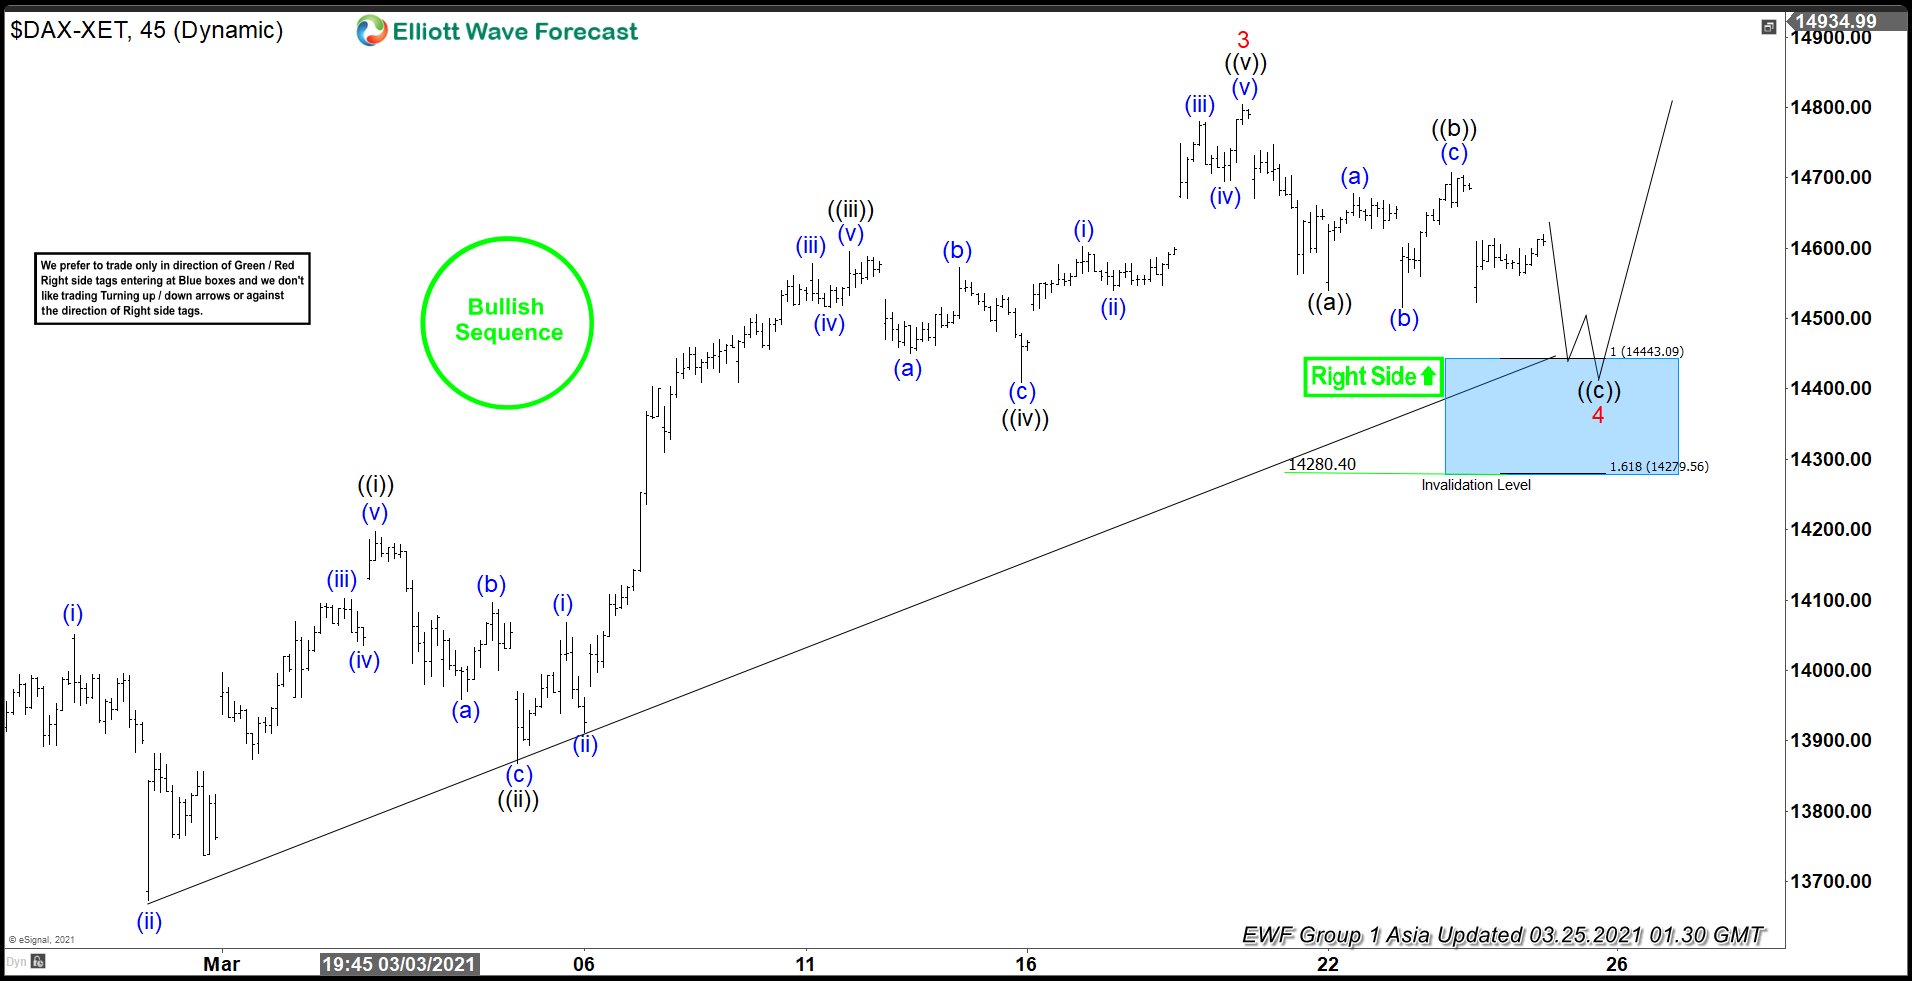
Elliott Wave View: DAX Correction Near Complete
Read MoreDAX is correcting cycle from February 23 low and can see support soon. This article and video look at the Elliott Wave path.