
-
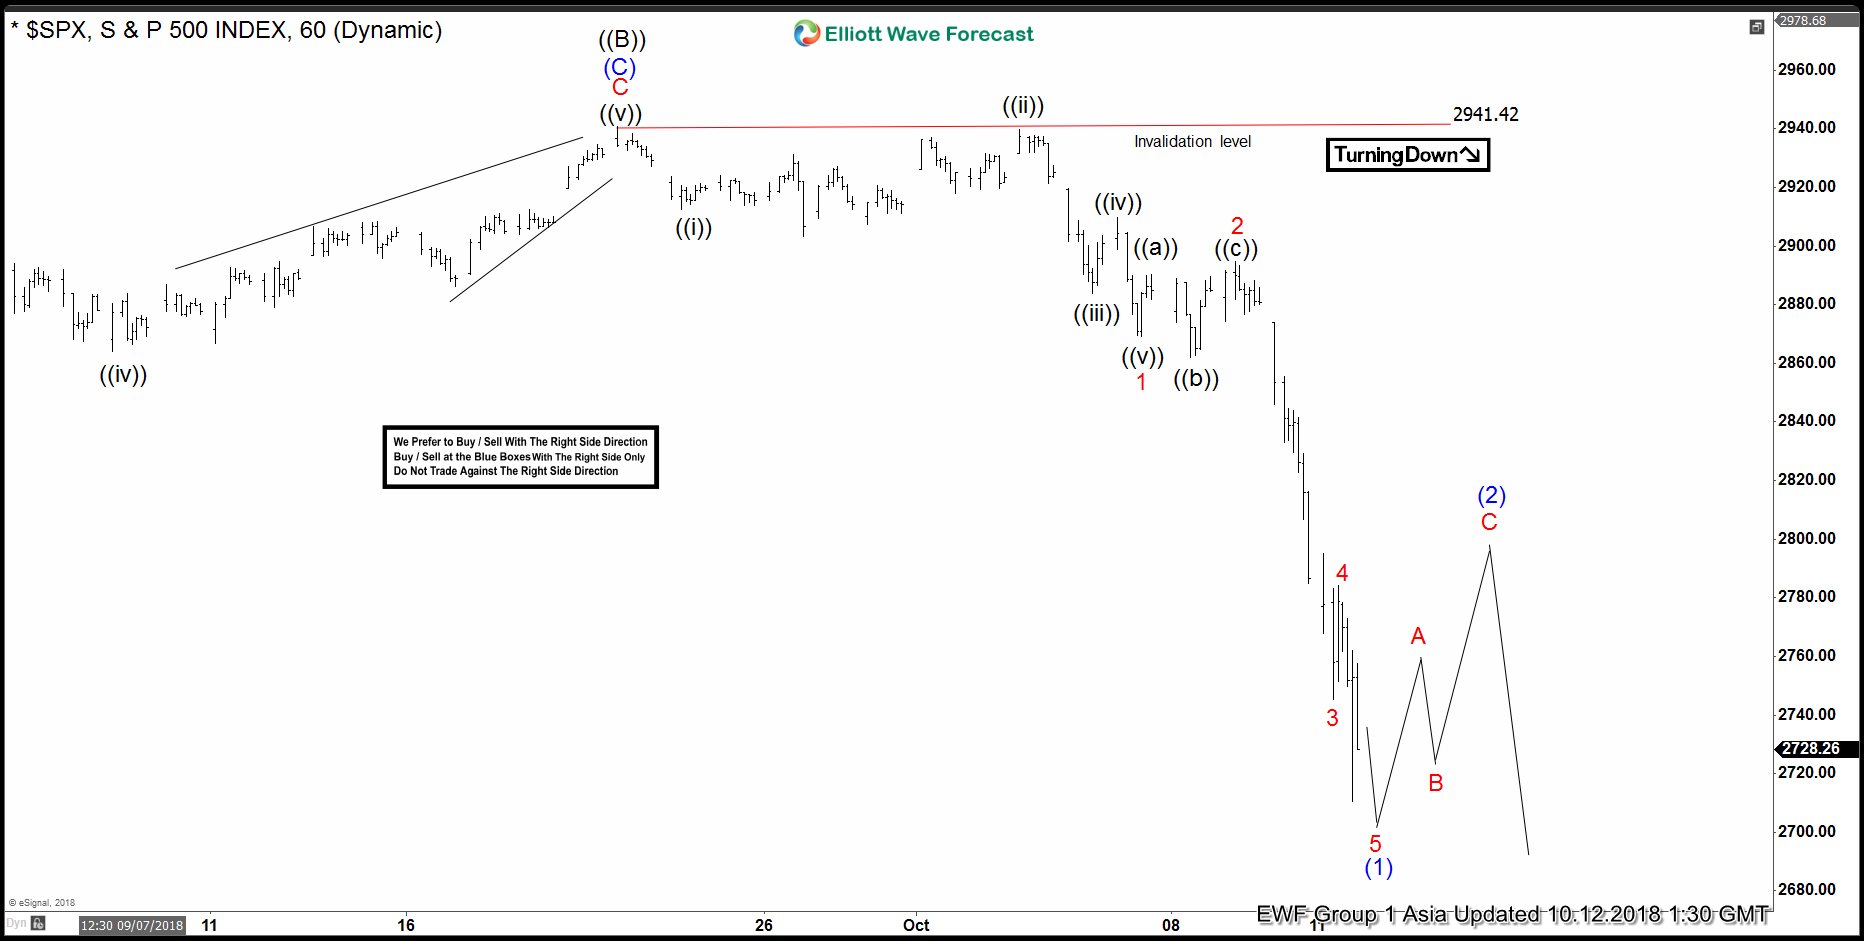
SPX Another Selling Can Enter Index Into Buying Area?
Read MoreSPX short-term Elliott wave view suggests that a rally to $2941.42 high ended primary wave ((2)) bounce. Down from there, primary wave ((C)) remain in progress as impulse structure. Where initial decline to $2912.63 low ended Minute wave ((i)). A bounce to $2939.86 high ended Minute wave ((ii)). A decline to $2883.92 low ended Minute […]
-
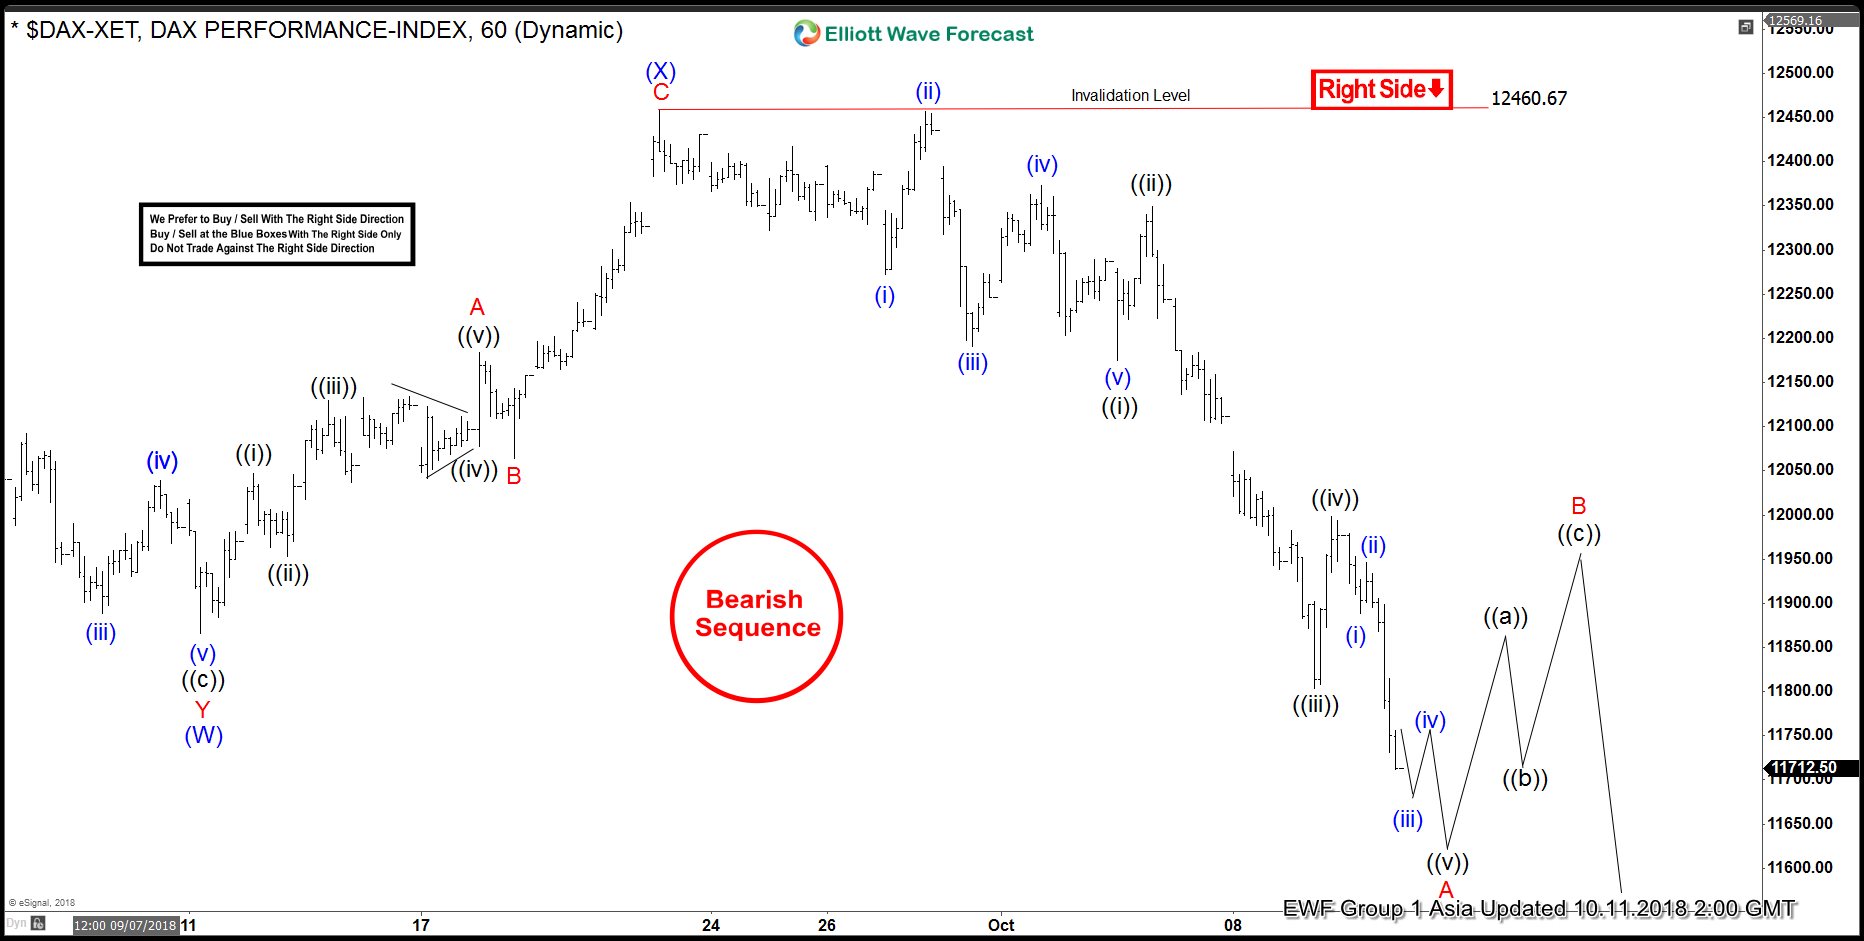
DAX Bearish Sequence Calling For More Downside
Read MoreDAX short-term Elliott wave view suggests that the decline to 11865.47 low ended intermediate wave (W). Up from there, the bounce to 12460.67 high ended intermediate wave (X). The internals of that bounce unfolded as a zigzag structure where Minor wave A ended at 12184.41 high in lesser degree 5 waves. A pullback to 12064.41 […]
-
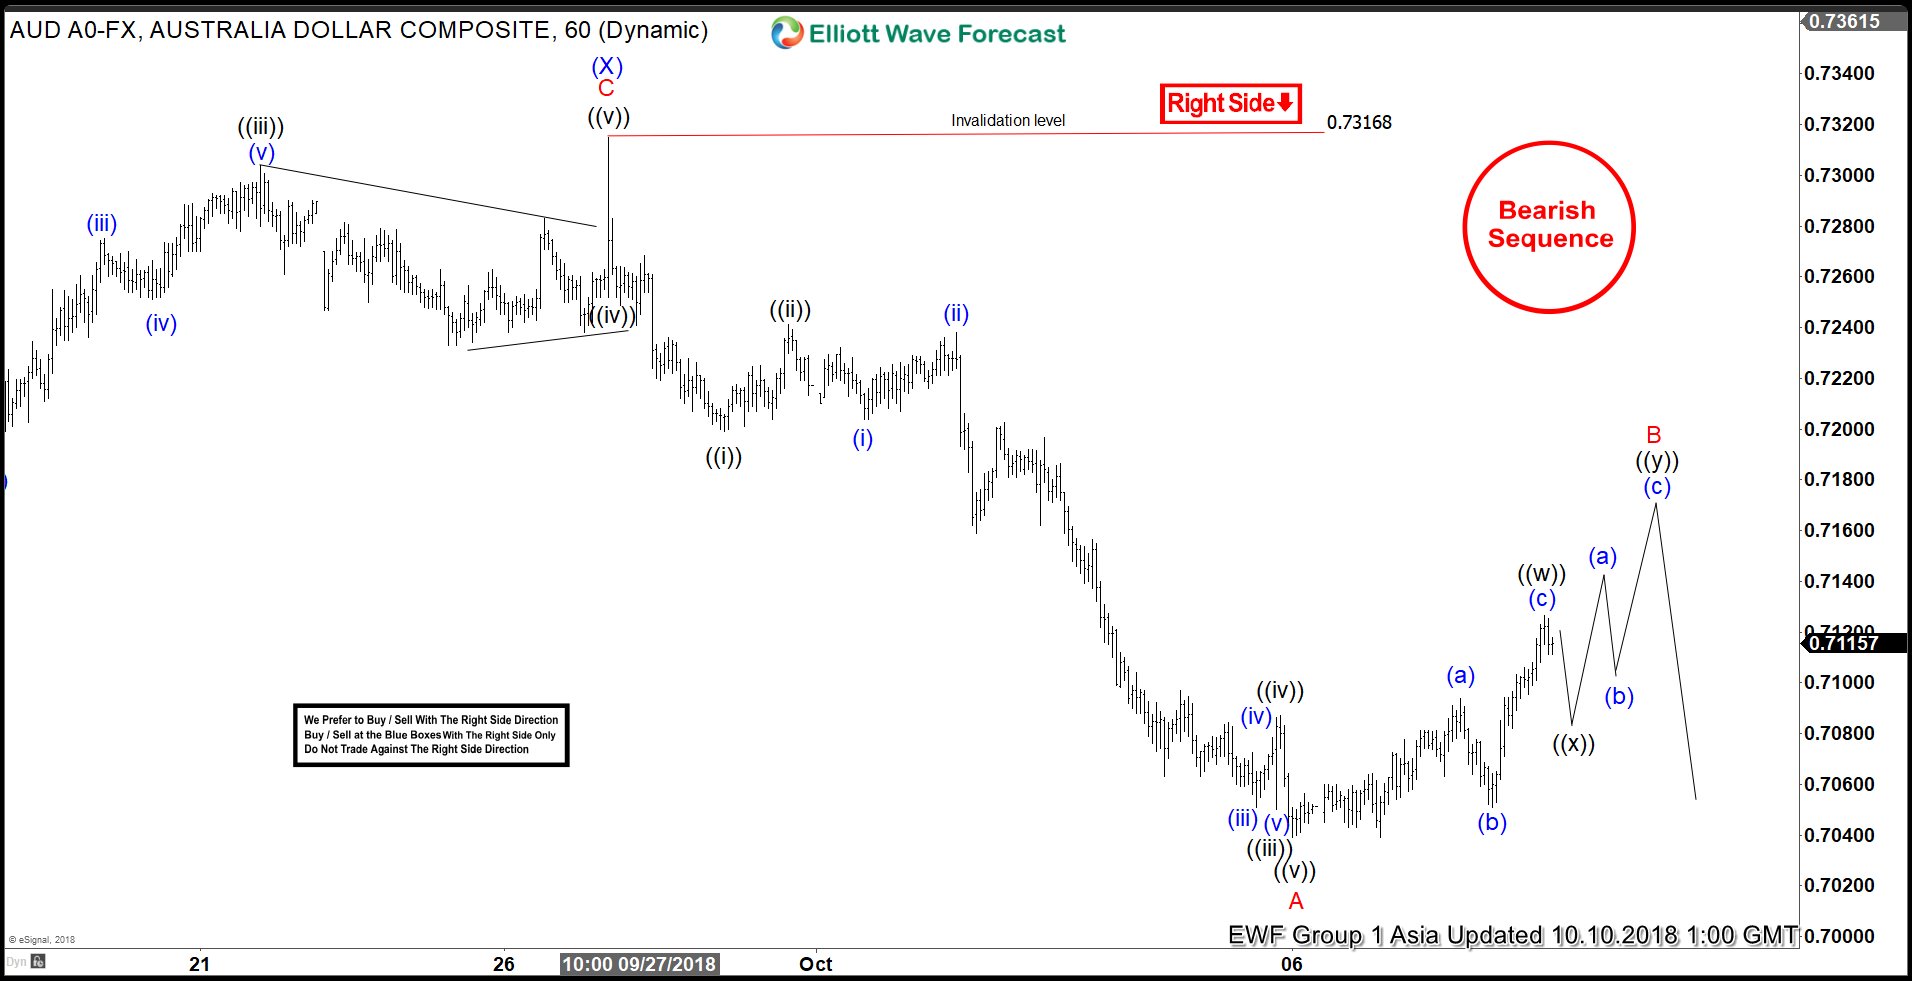
AUDUSD Bearish Sequence Support More Downside
Read MoreAUDUSD short-term Elliott wave view suggests that the bounce to 0.7316 high ended intermediate wave (X). Down from there, intermediate wave (Y) remain in progress as a zigzag structure. Where initial decline to 0.7049 low ended in 5 waves impulse structure & also completed the Minor wave A lower. Also, it’s important to note that […]
-
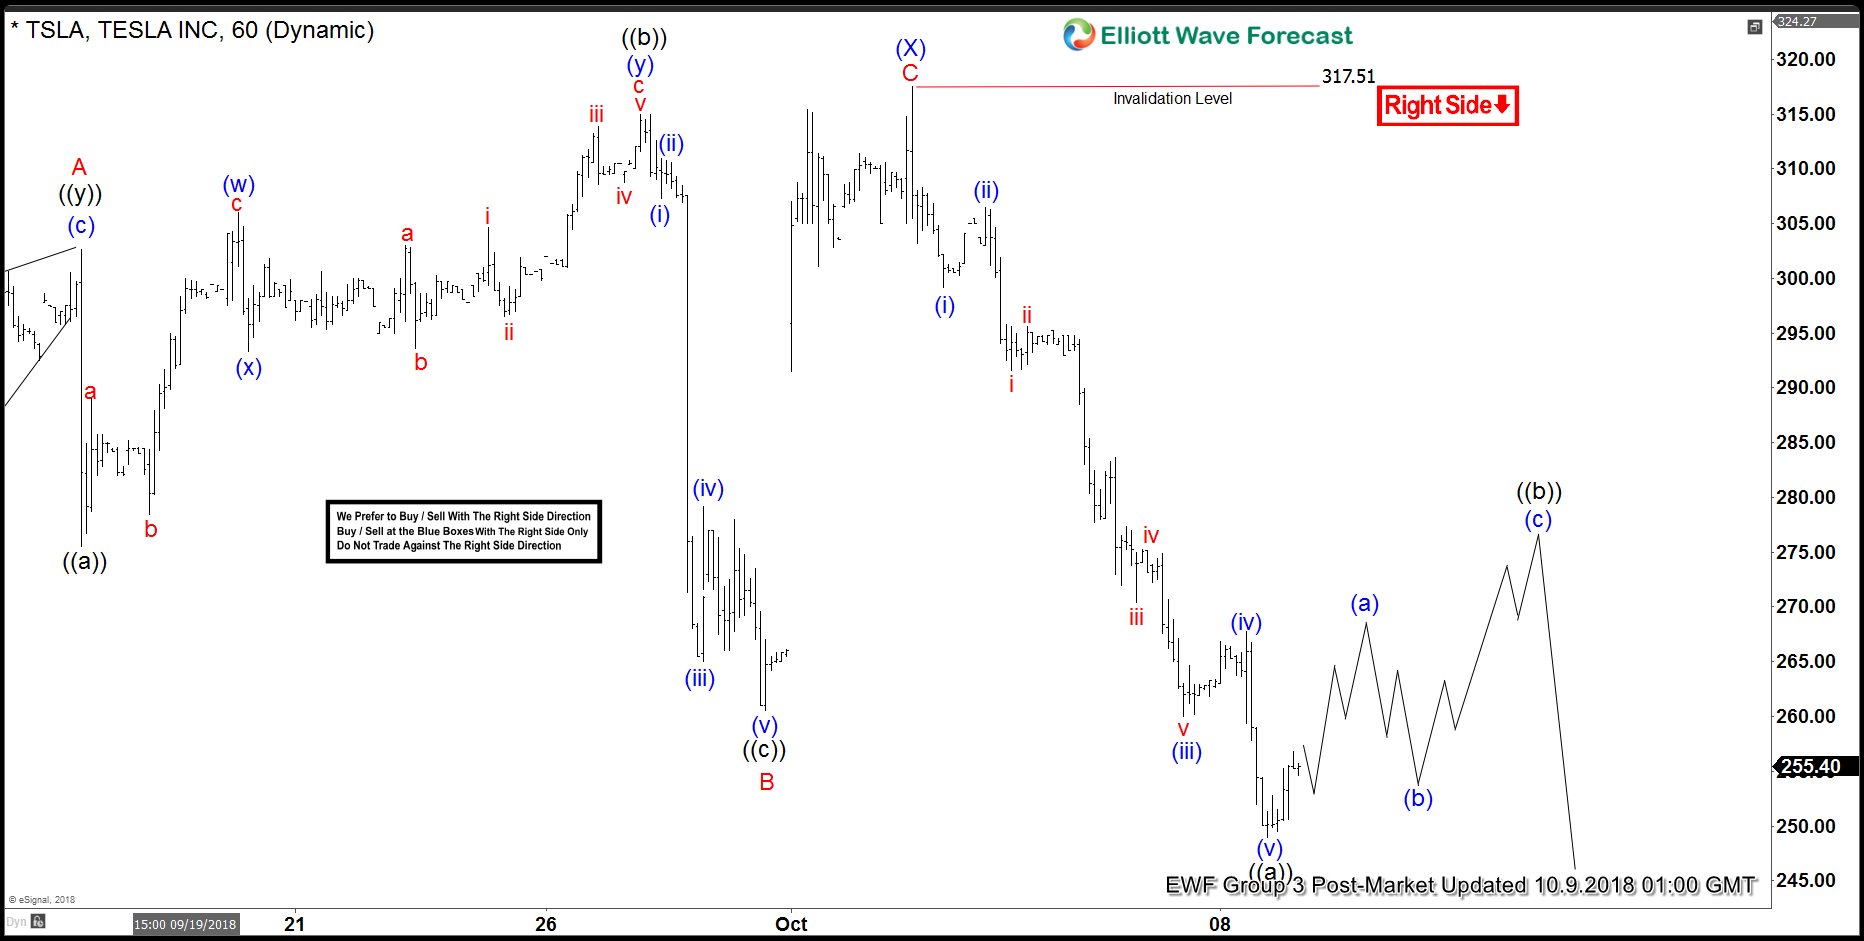
Tesla Elliott Wave View: Favoring More Downside To Proceed
Read MoreTesla ticker symbol: $TSLA short-term Elliott wave view suggests that the rally to $317.51 high ended intermediate wave (X) bounce. The internals of that bounce unfolded as zigzag structure where Minor wave A ended in 5 waves at $302.64 high. Down from there, Minor wave B pullback ended as a Flat at $260.56 where lesser […]
-
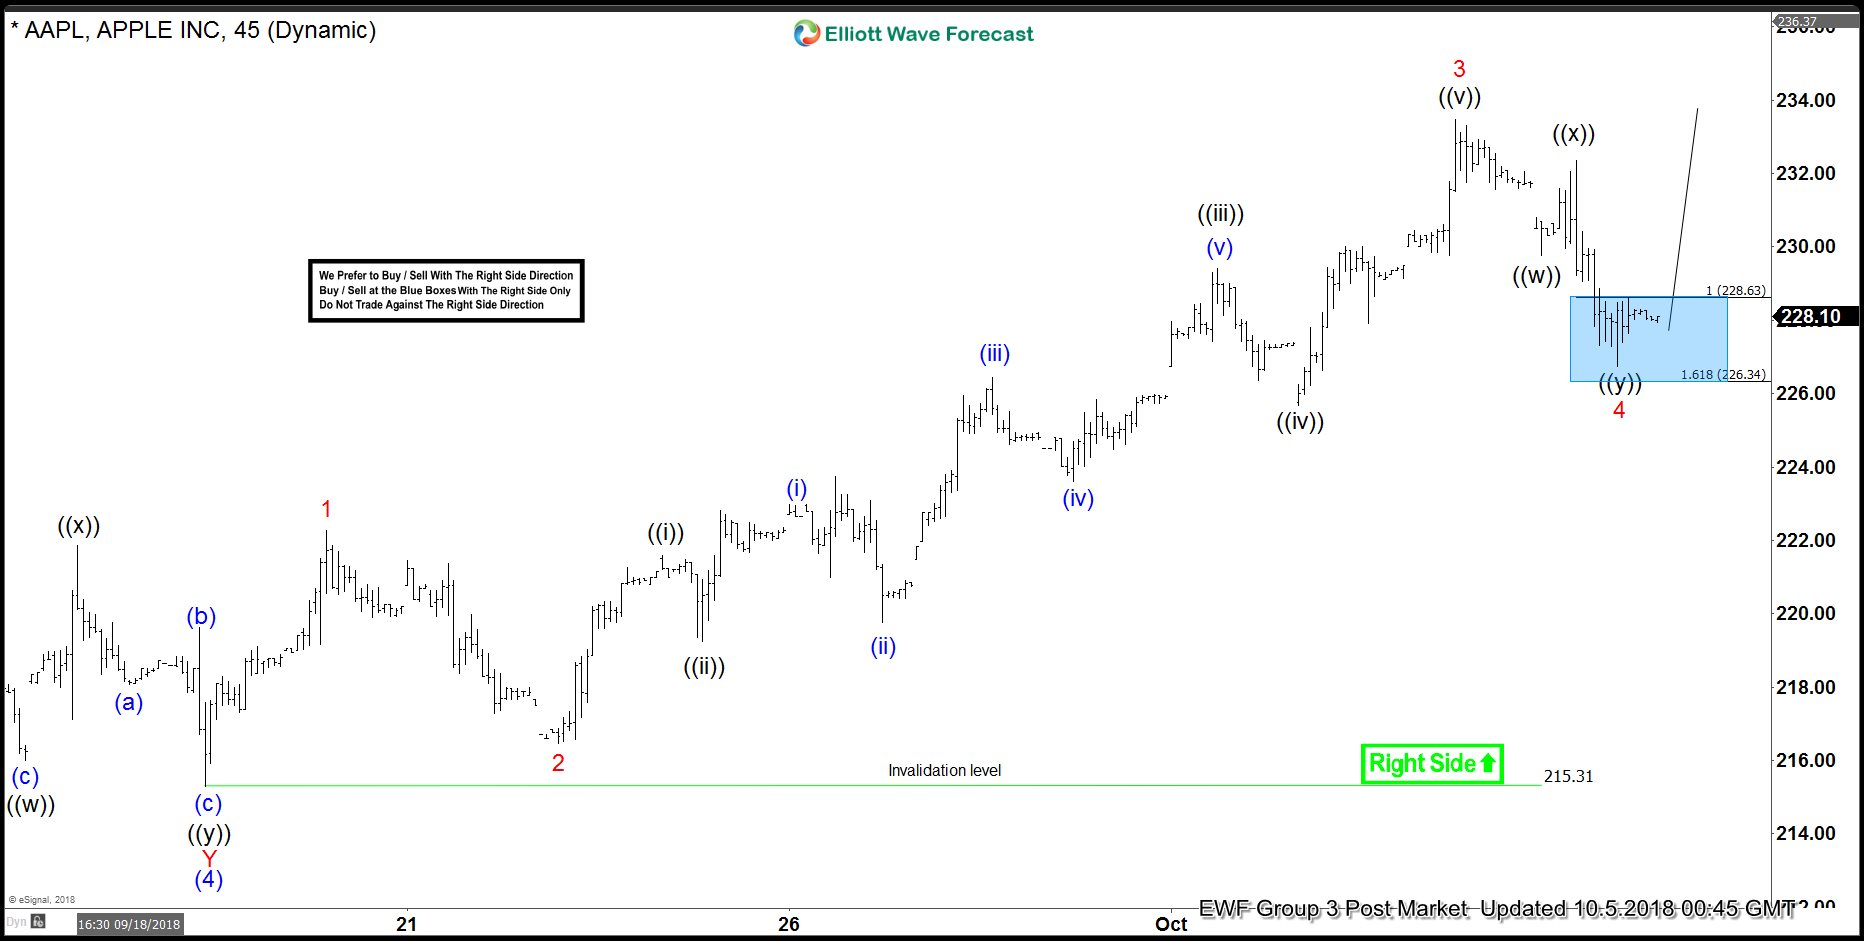
Apple Nesting Higher As Elliott Wave Impulse Structure
Read MoreApple ticker symbol: $AAPL short-term Elliott wave view suggests that the decline to $215.31 low ended intermediate wave (4) pullback. Above from there, the stock is nesting higher within wave intermediate wave (5) looking for more upside extension. The internals of intermediate wave (5) is unfolding as impulse structure with the sub-division of 5 waves […]
-
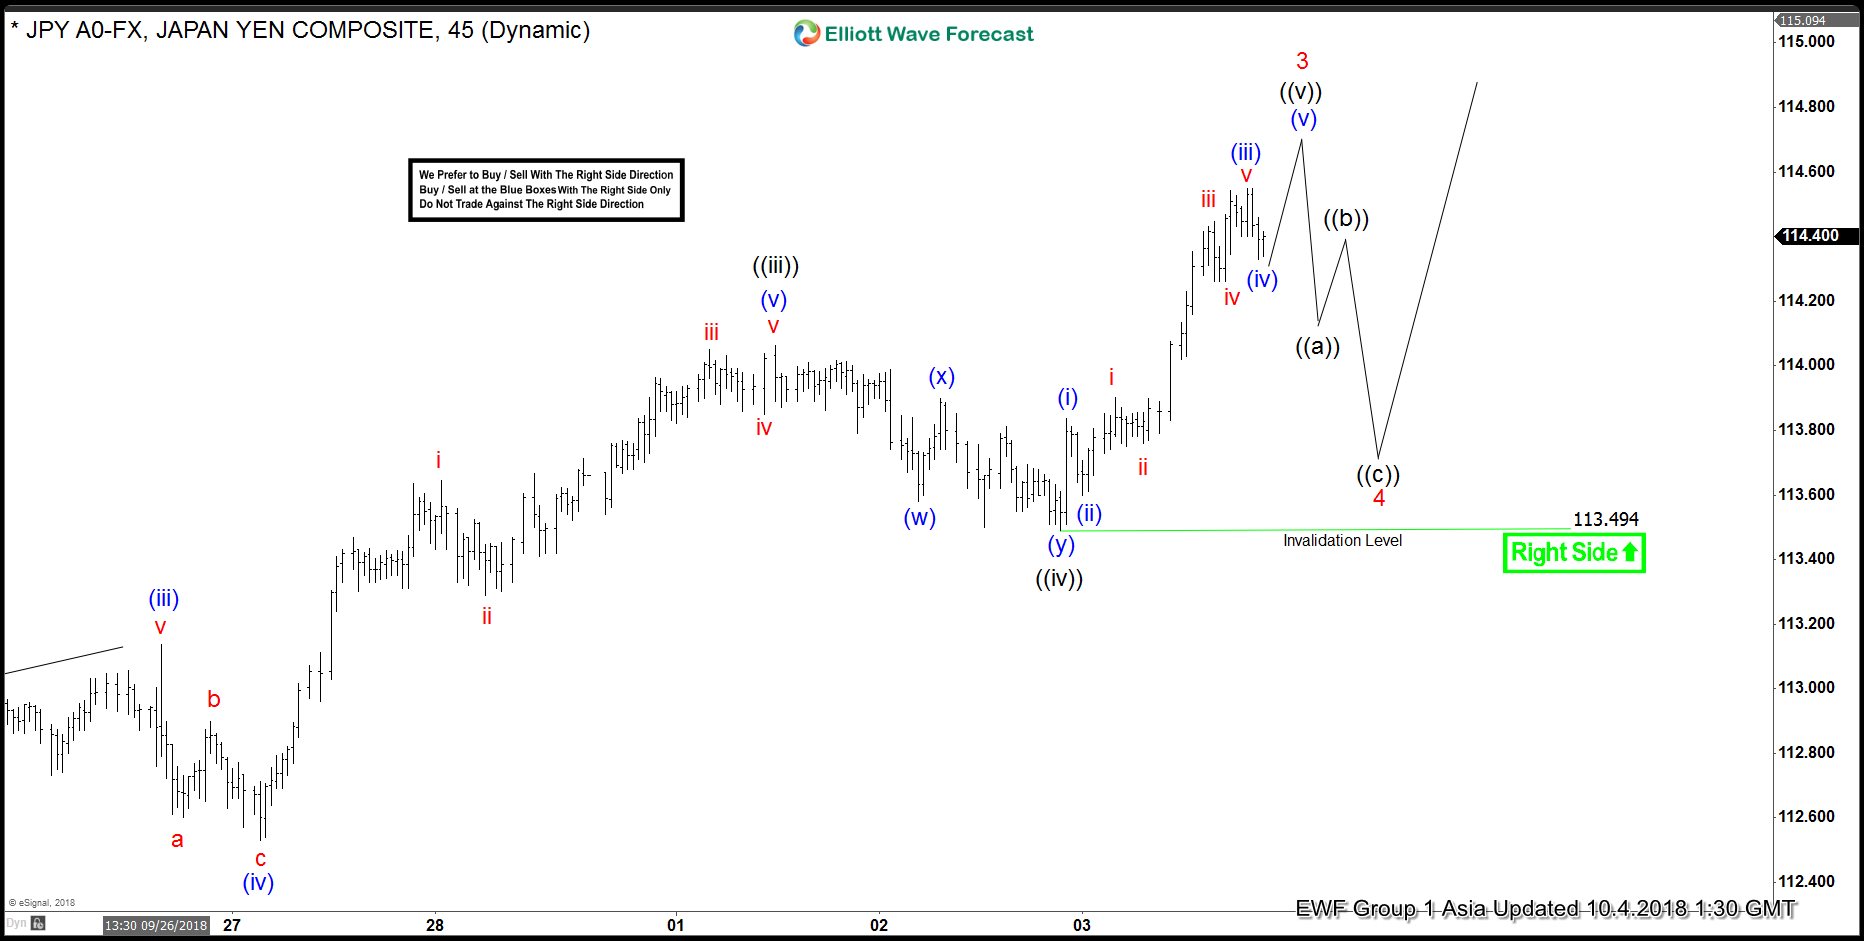
USDJPY Elliott Wave Suggest Extension Towards 118.24-120.30 Next
Read MoreUSDJPY short-term Elliott wave view suggests that the pair is nesting higher as impulse structure. Looking for an extension higher towards 118.24-120.30 100%-123.6% Fibonacci extension area from 3/23/2018 low. And until that area is reached dips are expected to remain supported in 3, 7 or 11 swings looking for upside extension. Currently, Minor wave 3 remain […]