
-
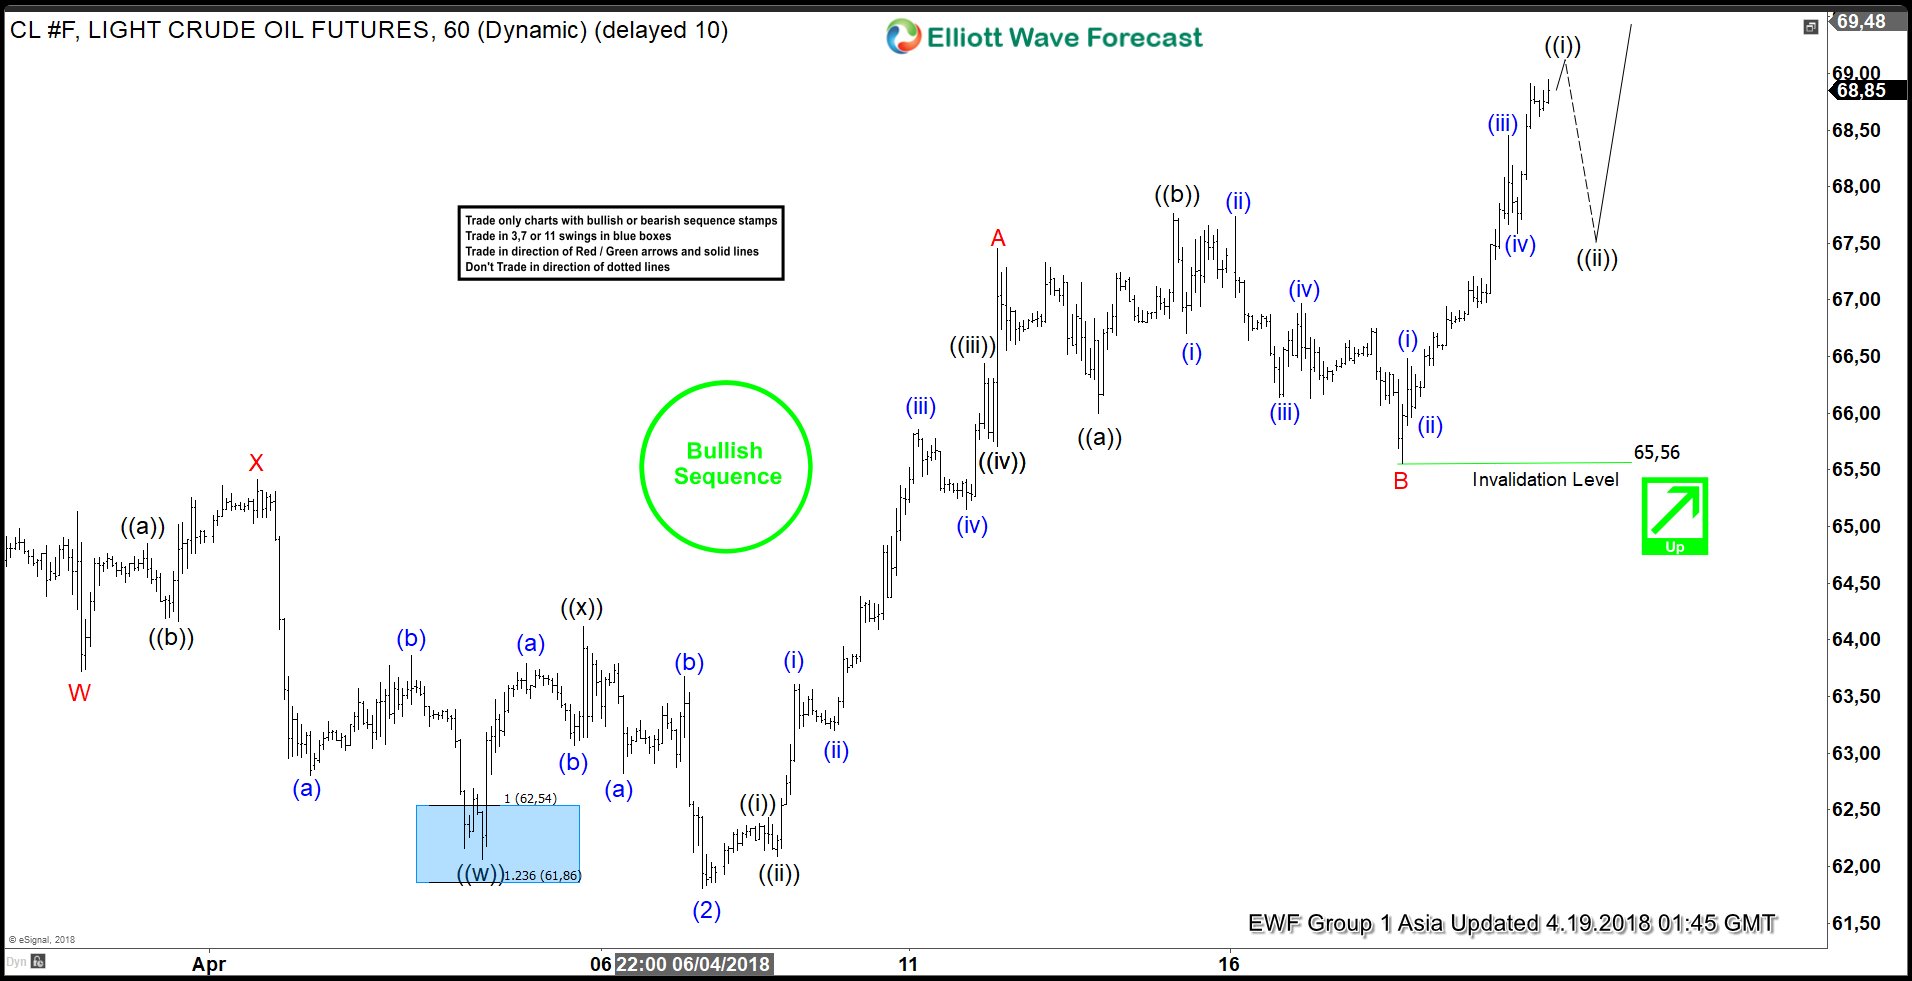

CL_F Elliott Wave View: Calling More Strength
Read MoreCL_F Elliott Wave short-term view suggests that the decline to 61.80 on 4/06/2018 low ended Intermediate wave (2). Above from there, Intermediate wave (3) remains in progress as Zigzag Elliott Wave structure. Looking to extend higher towards 70.43-72.47 area at a minimum. Up from 61.80 low, the instrument made a strong rally higher. And ended […]
-
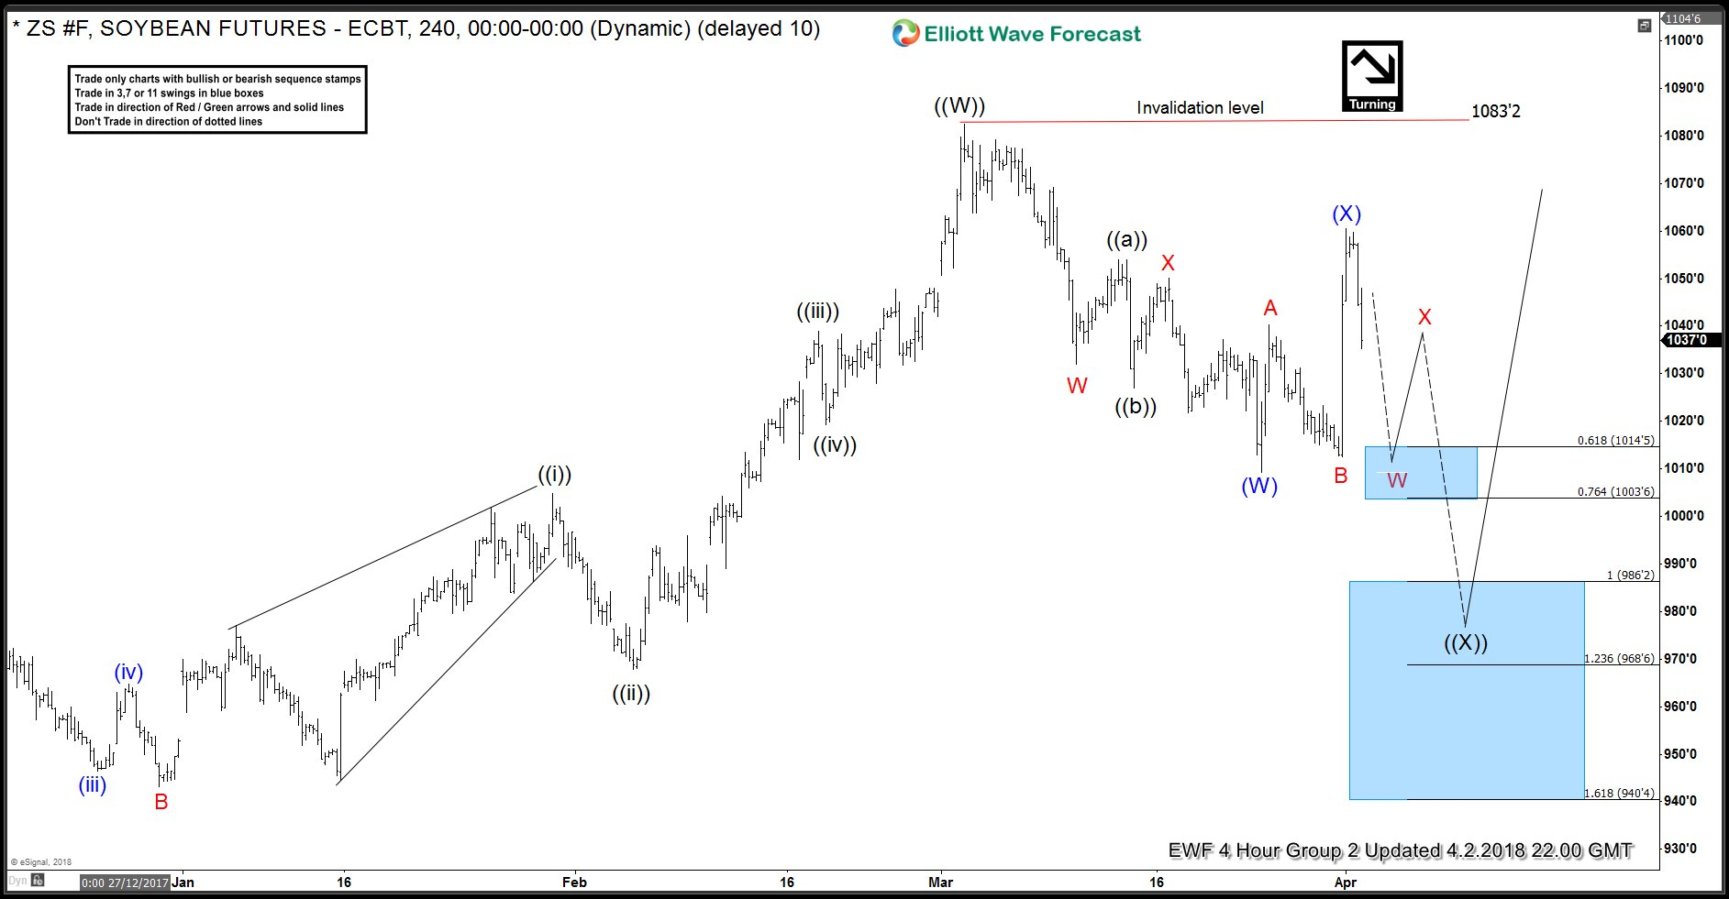
Soybeans (ZS_F) Forecasting The Elliott Wave Pullback
Read MoreIn this technical blog, we are going to take a quick look at the past performance of Soybeans (ZS_F) Charts presented in members area. Last month instrument made a strong reaction lower from March 02. 2018 peak (1083.2) and ended the cycle from June 2017 low cycle. Thus suggested that we should be correcting that cycle […]
-
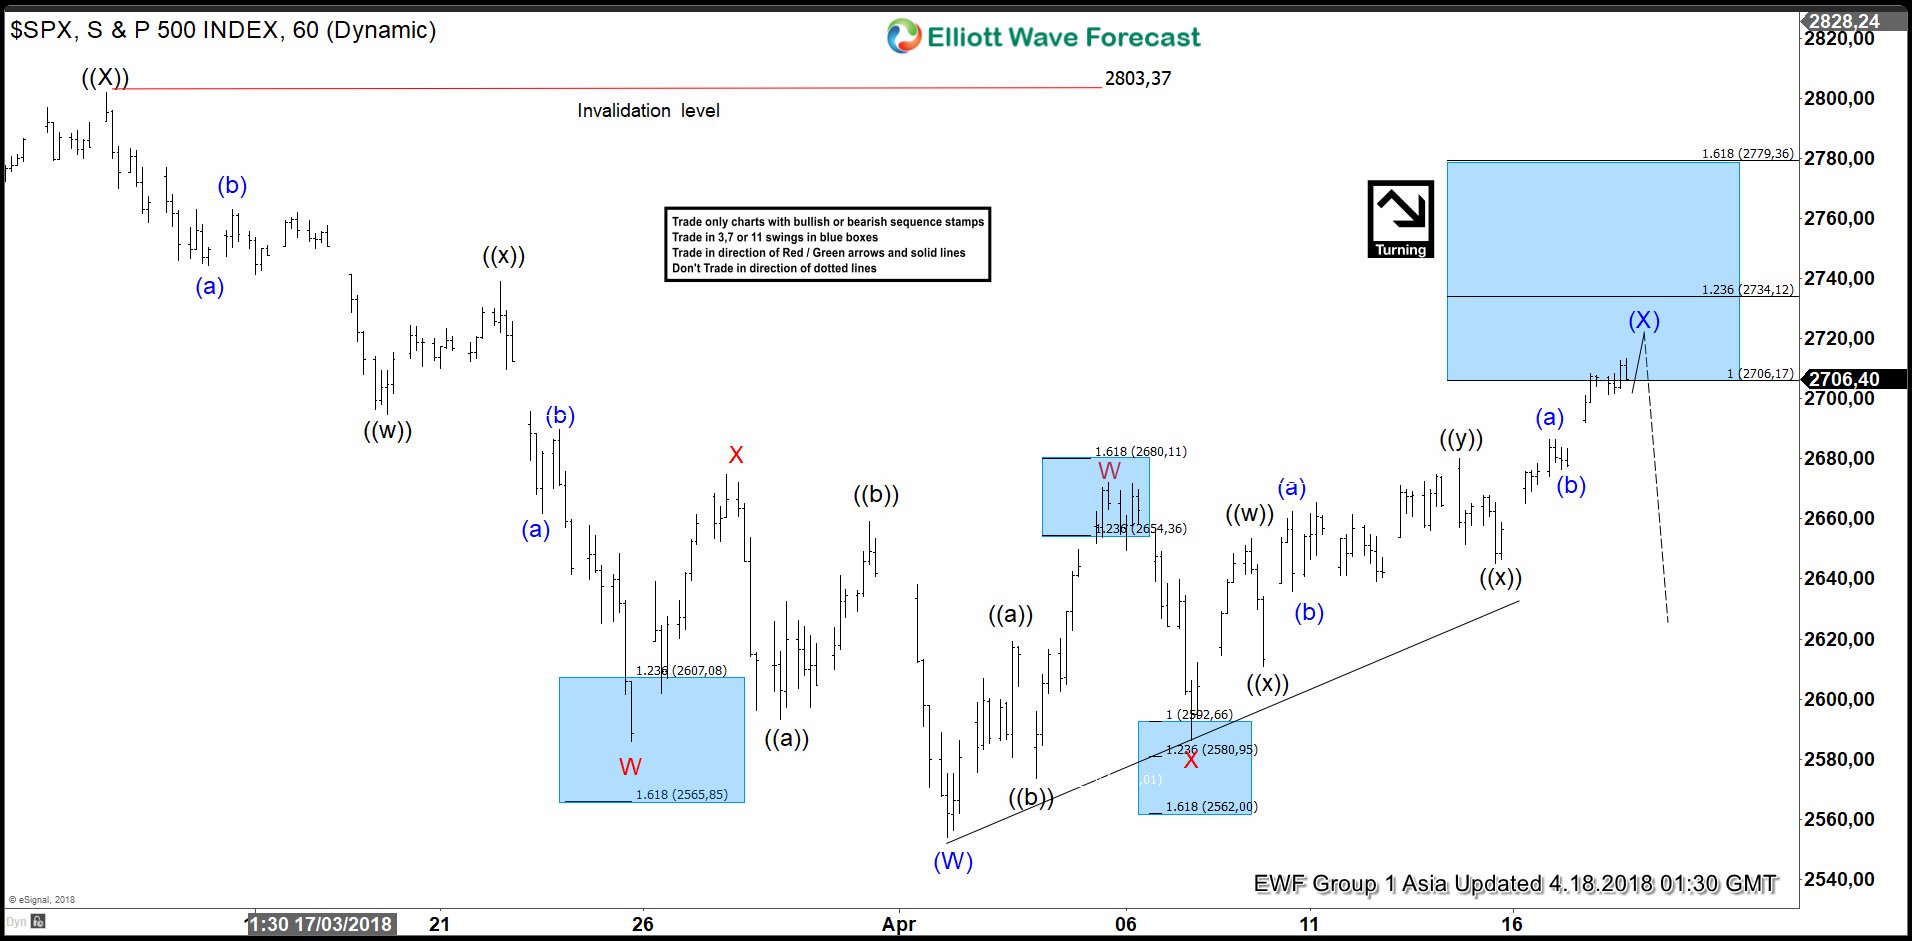
SPX Elliott Wave View: Calling Reaction Lower Soon
Read MoreSPX Elliott Wave view in short-term cycles suggest that the bounce to 3/13 high (2803.37) ended primary wave ((X)). Down from there, primary wave ((Y)) remains in progress as a double three Elliott Wave structure. The internal distribution of wave ((Y)) shows overlapping structure, thus favored it to be a corrective sequence i.e either W.X.Y […]
-
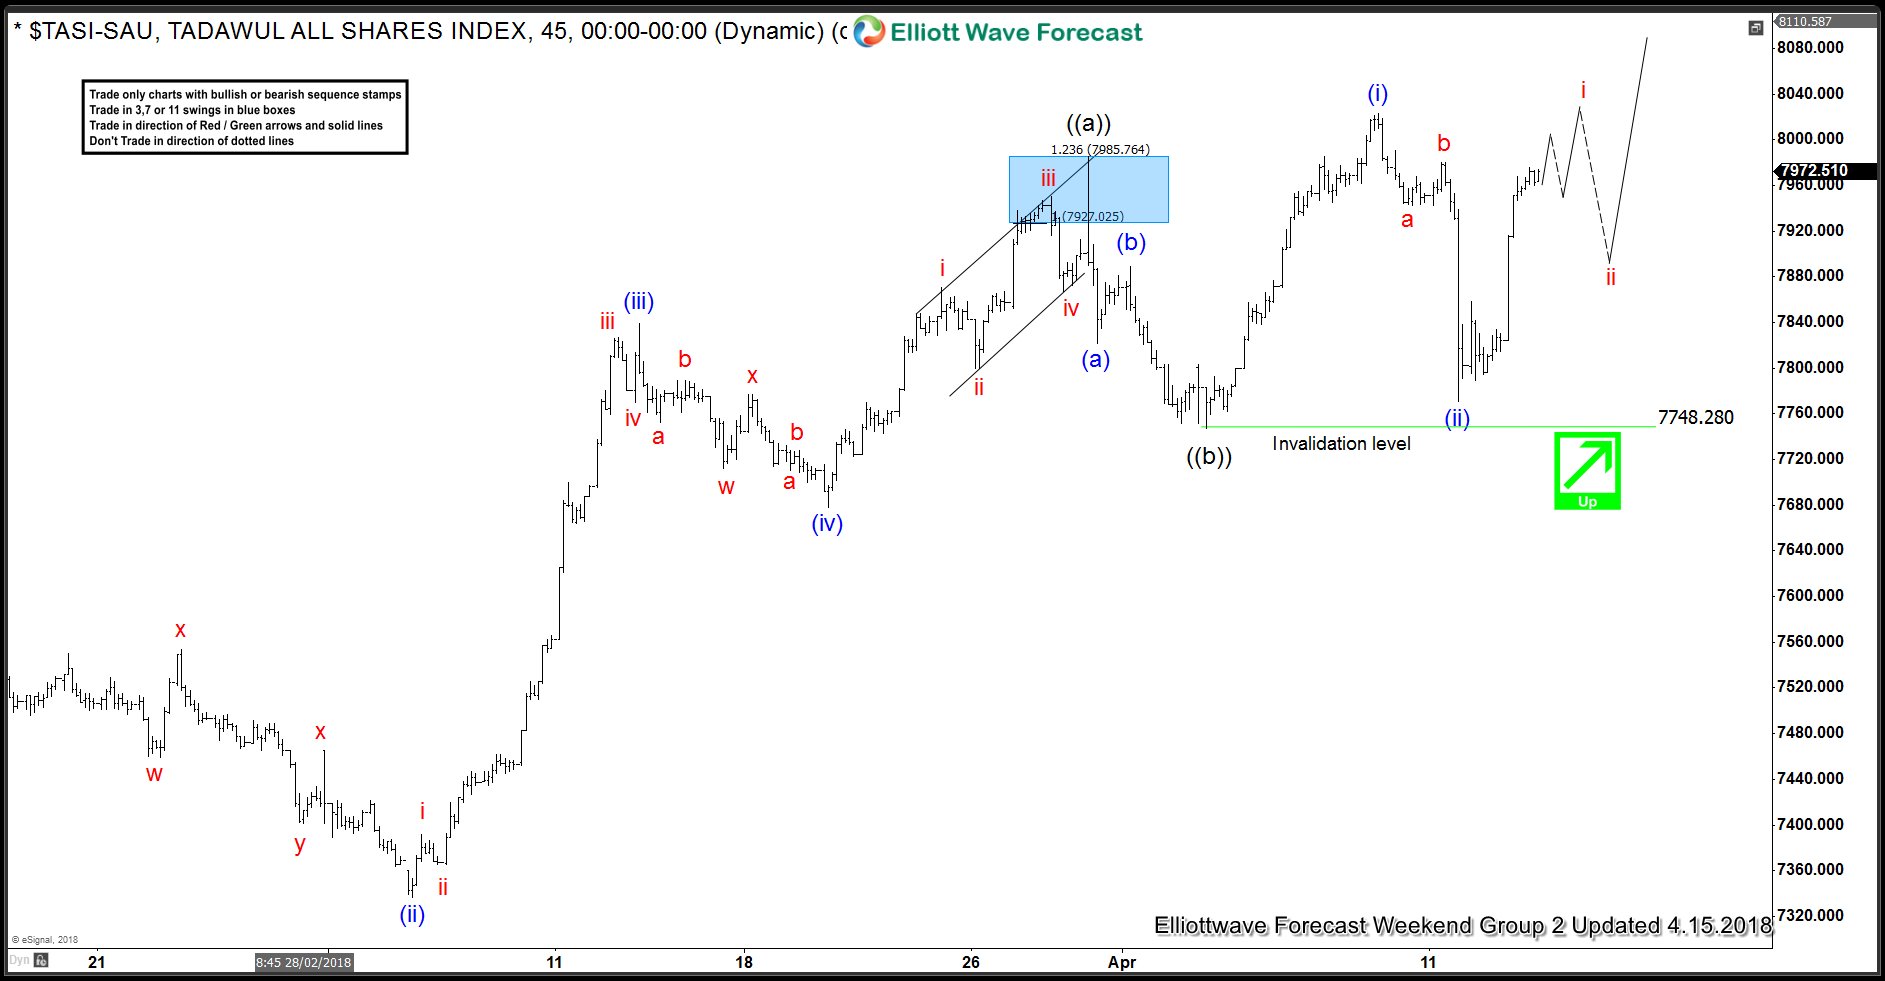
Elliott Wave Analysis: TASI (Tadawul All Shares) Calling Strength Higher
Read MoreTASI (Tadawul All Shares) an index from Saudi Arabia Elliott Wave Analysis suggests that the cycle from 11/21/2017 is showing higher high sequence. Calling for more upside extension towards 8259.82-8484.56 area next before it ends that cycle and starts the pullback. So now let’s take a look at the shorter cycles from February 11.2018 low. Which showed […]
-
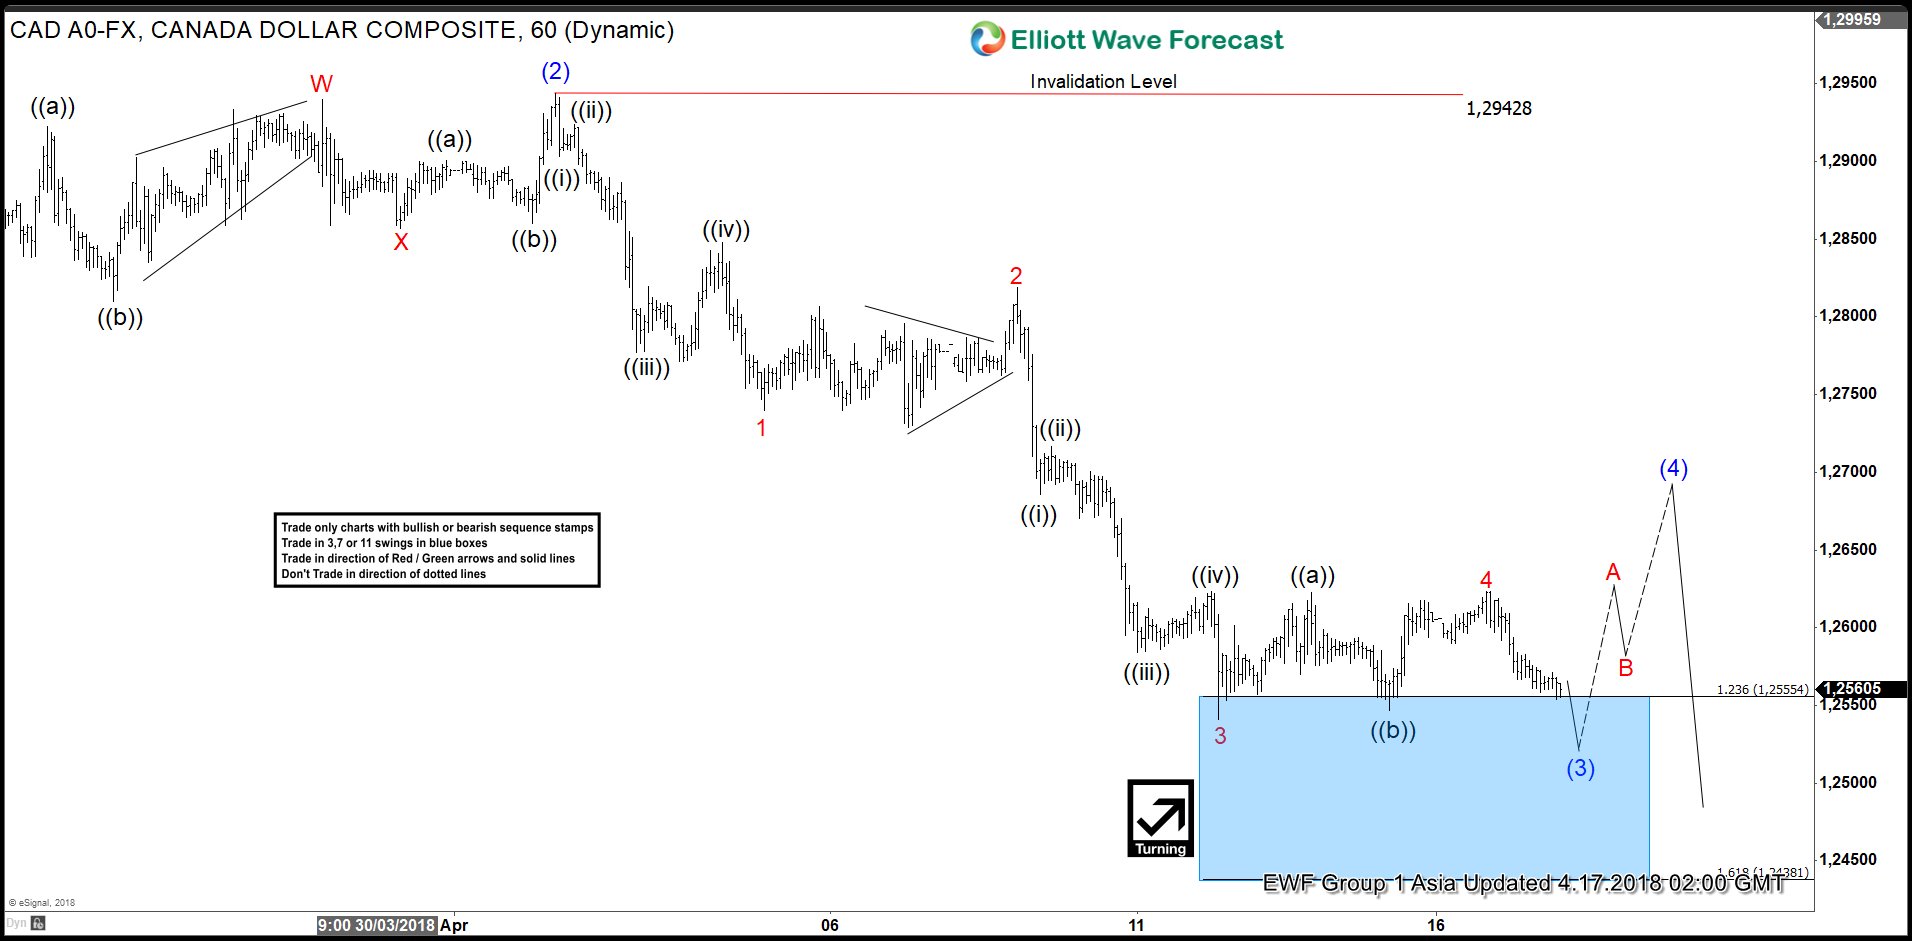
USDCAD Elliott Wave View: Calling Intraday Bounce
Read MoreUSDCAD Elliott Wave short-term view suggests that the bounce to 1.2942 high ended Intermediate degree wave (2). Then the decline from there is unfolding in an impulse sequence with an internal sub-division of each leg lower is showing 5 waves structure thus favored it to be an impulse. Below from 1.2942 high, Intermediate wave (3) […]
-
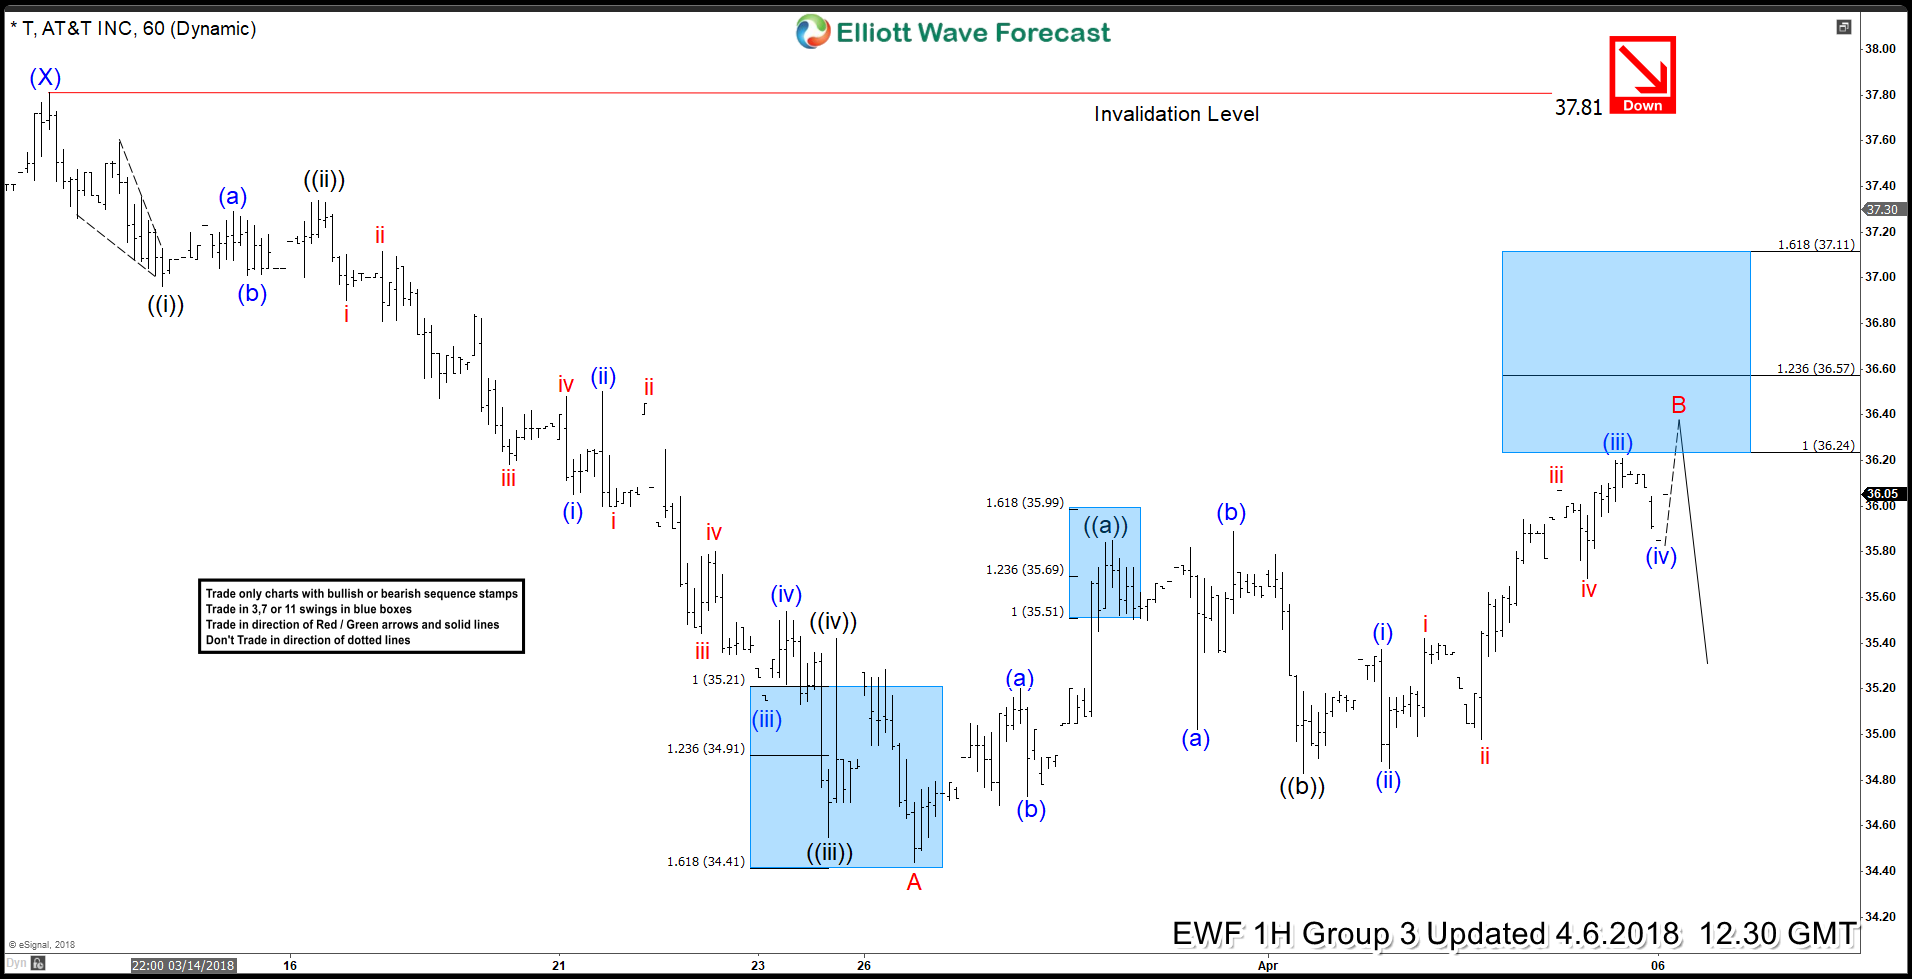
AT&T Elliott Wave View: Calling Bounces to Fail
Read MoreAT&T ticker symbol: ($T) short-term AT&T Elliott Wave view suggests that the bounce to 3/13 high (37.81) ended Intermediate wave (X) bounce. Below from there, intermediate Y leg lower remains in progress as a Zigzag correction. Where initial decline unfolded in 5 waves Elliott Wave Impulse Sequence with extension in Minor wave A. Which can be seen in […]