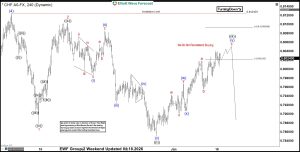
USDCHF has provided traders with a textbook example of how Fibonacci extension zones can act as powerful resistance. After an extended move higher, price reached the 0.8020–0.8092 extension...
Read More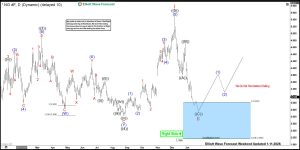
Natural Gas has once again reminded traders of its explosive potential. After finding buyers at a key Fibonacci extension area, prices catapulted 146% in just 12 trading days—an...
Read More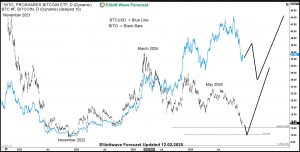
Bitcoin’s recent surge toward $91K has traders buzzing with excitment and some are already anticipating the start of next bullish leg, but the charts tell a different story....
Read More
We conducted an Exclusive Webinar on Wednesday, 26th November 2025 titled Metals in Motion – Unlock the future of Gold, Silver, Copper and Platinum through Elliott Wave, Cycles, and...
Read More
In this technical blog, we analyze the historical performance of the CHFJPY 1-hour Elliott Wave charts, as presented to members of ElliottWave-Forecast. The analysis highlights an impulsive rally...
Read More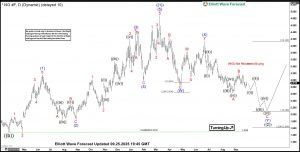
Natural Gas has been showing some interesting price action lately, and for traders who use Elliott Wave analysis, the current setup is worth a closer look. The market...
Read More