
-
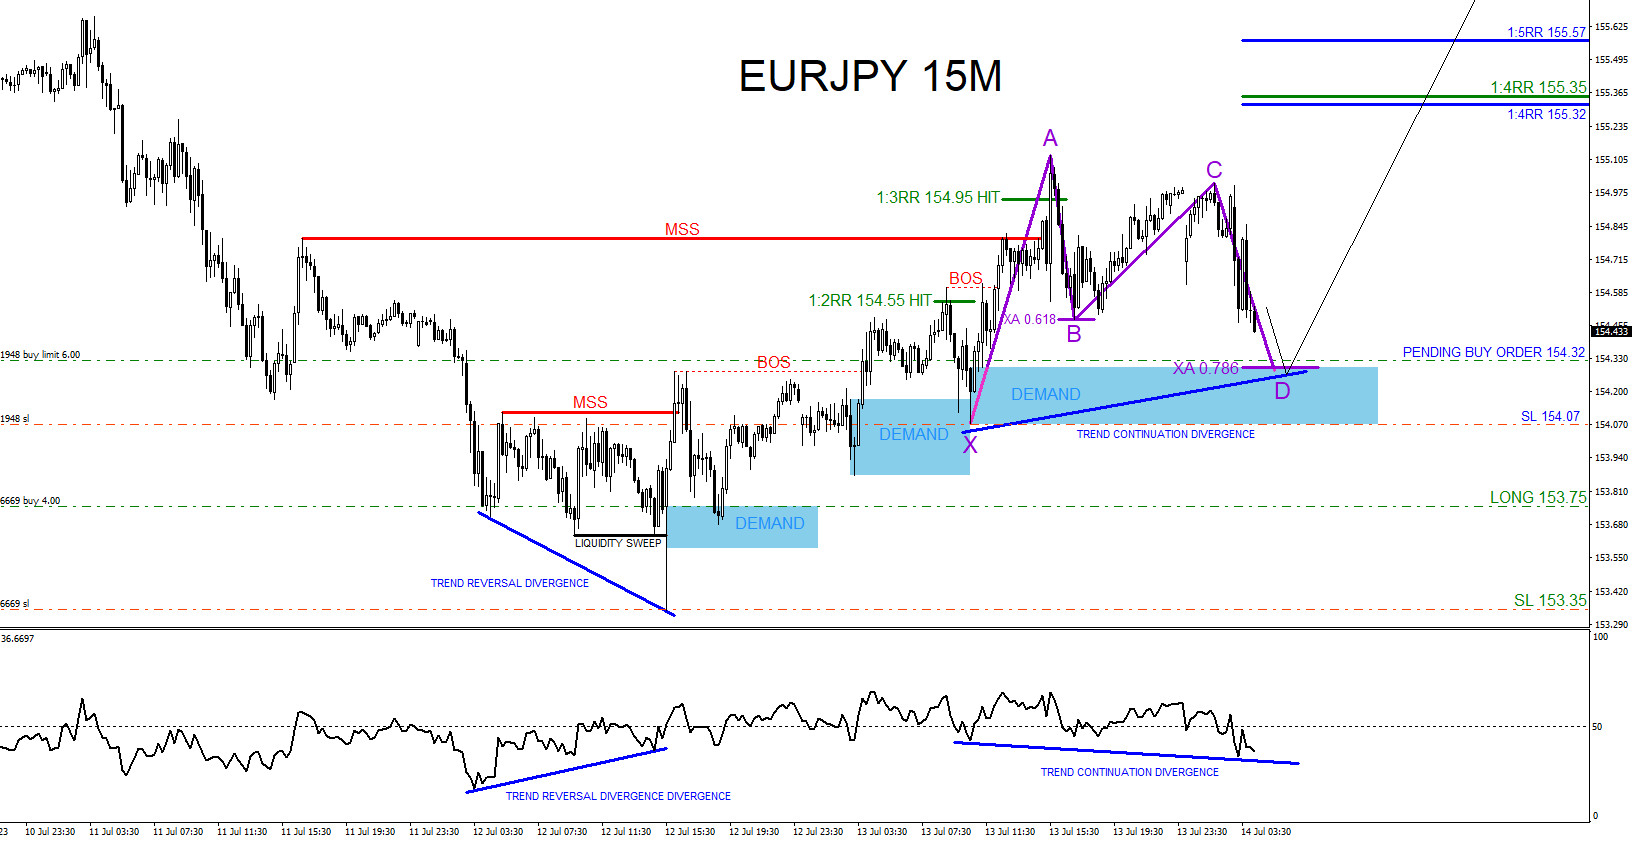
EURJPY : 2 Buy Trades Hits Targets
Read MoreOn July 12 and 13 2023, I posted 2 separate EURJPY buy trade setups on social media @AidanFX . July 12 2023 1st BUY entry (Green) “LONG/BUY EURJPY at 153.75 Stop Loss at 153.35 Target at 154.55 (1:2RR) 154.95 (1:3RR)” and July 13 2023 2nd BUY entry (Blue) “LONG/BUY EURJPY at 154.32 Stop Loss at […]
-
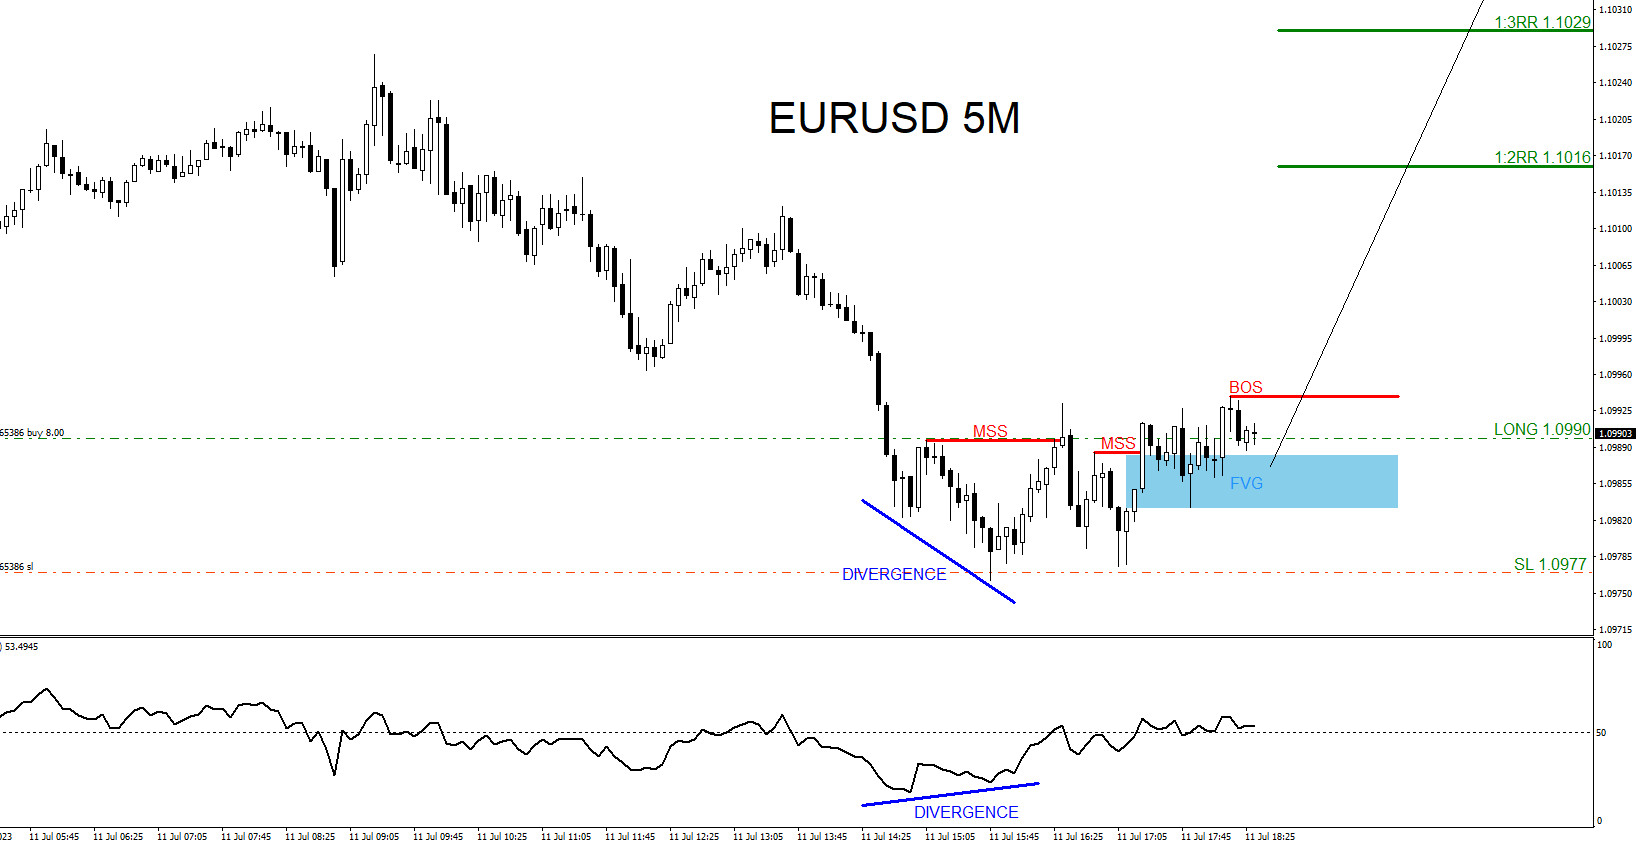
EURUSD : Buy Trade Hits Targets
Read MoreOn July 11 2023 I posted on social media @AidanFX ” LONG/BUY EURUSD at 1.0990 Stop Loss at 1.0977 Target 1.1016 – 1.1029 area.” BUY Trade Setup 1. RSI indicator and price form a bullish trend continuation divergence pattern. (Blue Line) 2. Price breaks above internal structure lower high (Red Line) signalling bearish weakness and […]
-
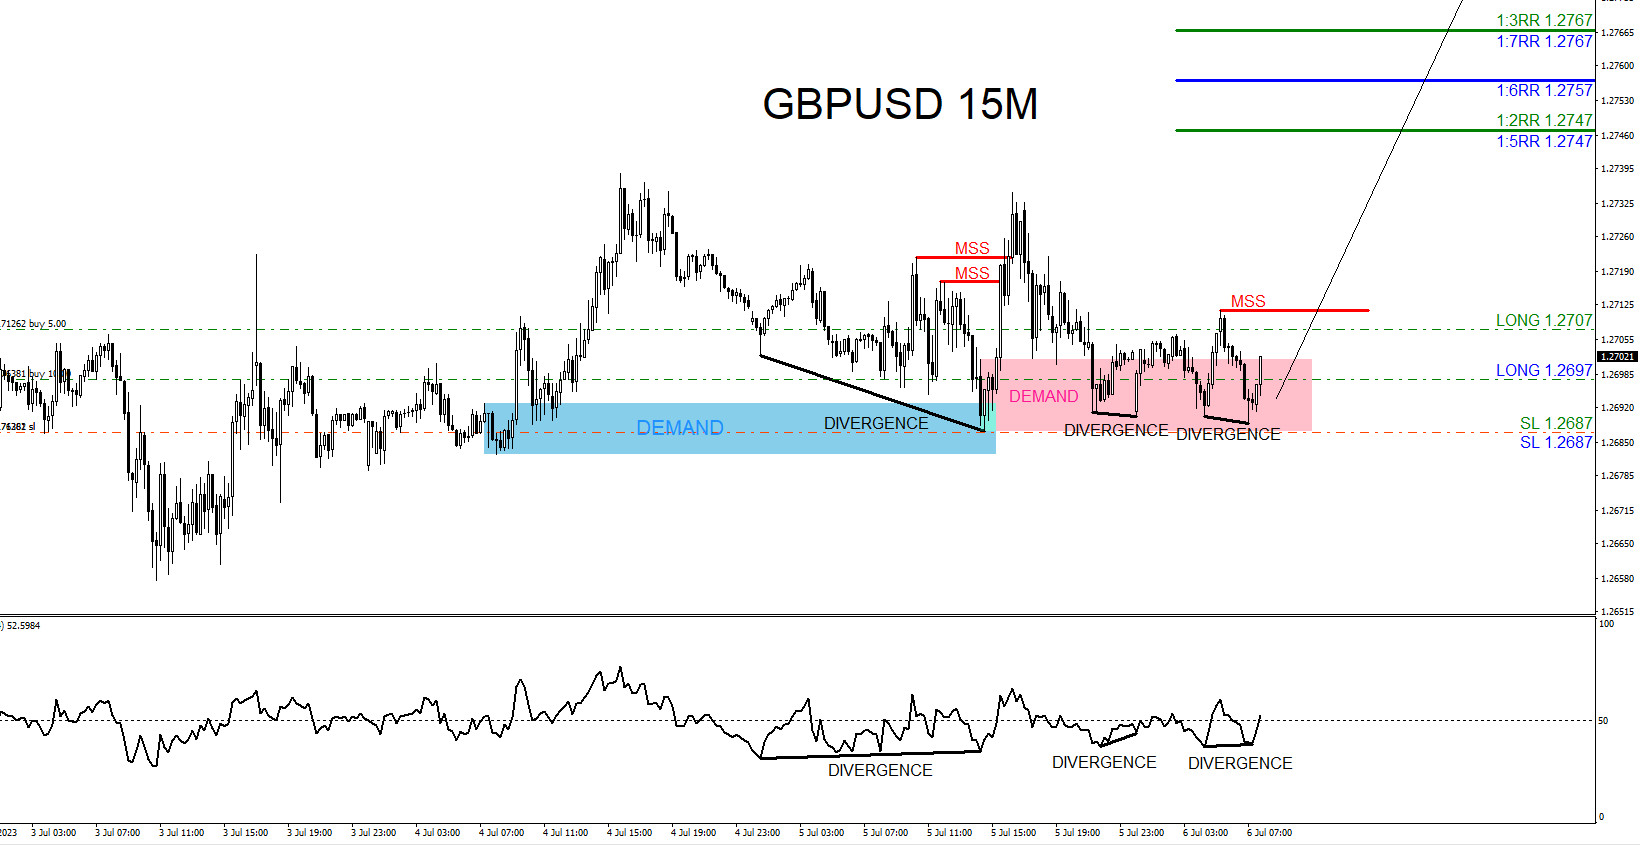
GBPUSD : 2 Buy Trades Hits Targets
Read MoreOn July 5th and 6th I posted 2 separate buy trade setups on social media @AidanFX “LONG/BUY GBPUSD at 1.2707 Stop Loss at 1.2687 Target at 1.2747 (1:2RR) 1.2767 (1:3RR)” and “Added 2nd LONG/BUY GBPUSD at 1.2697 Stop Loss at 1.2687 Target at 1.2747 (1:5RR).” Trades were taken based on demand zones, market structure and the […]
-
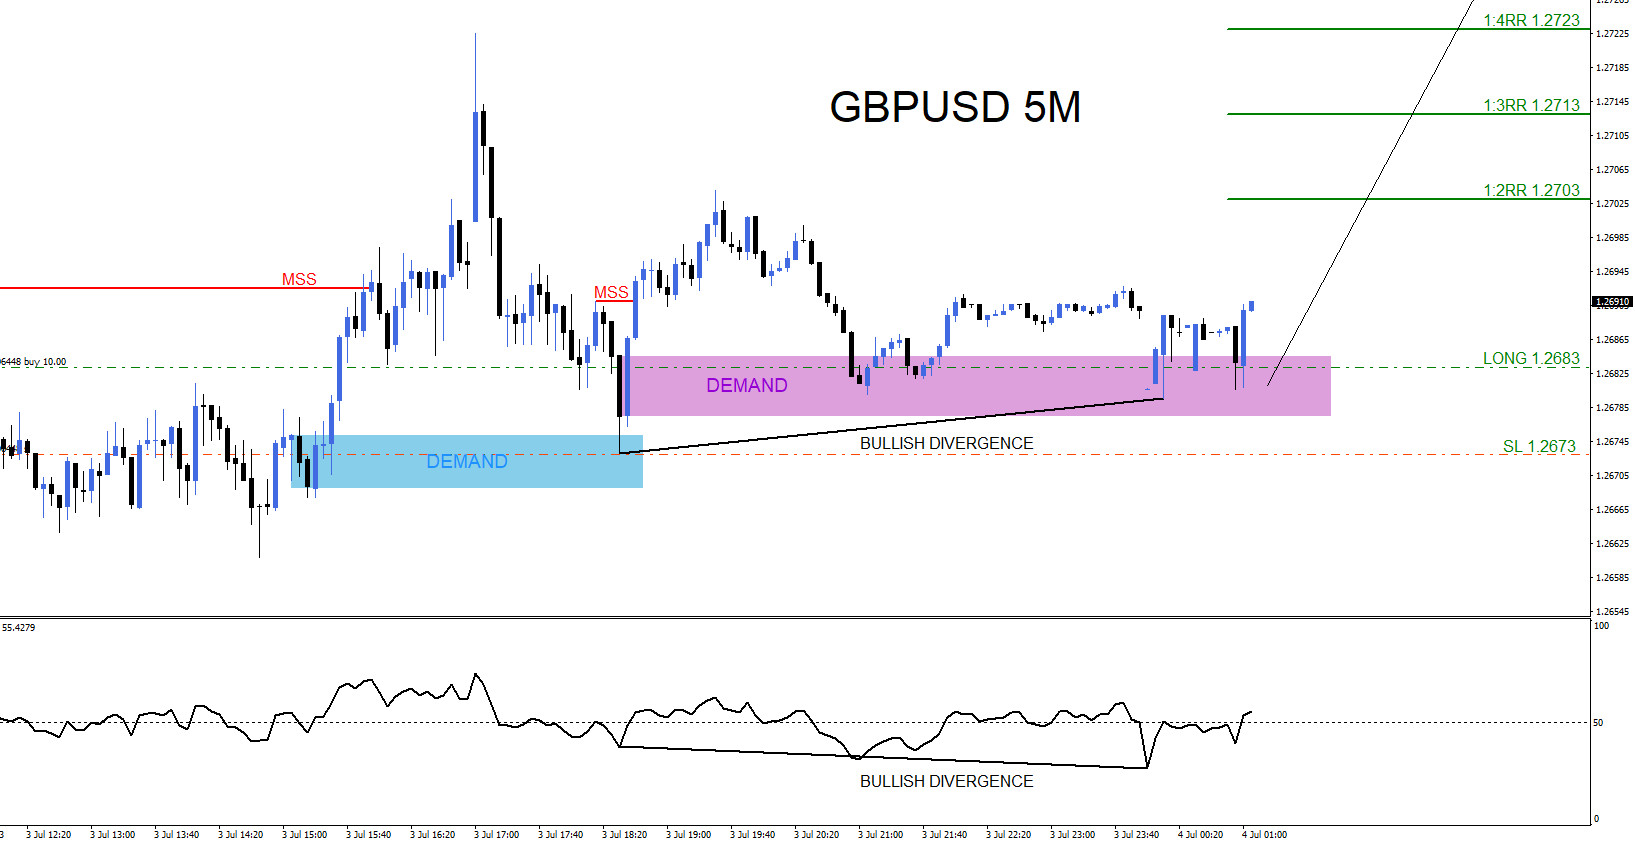
GBPUSD : Catching the Move Higher
Read MoreOn July 3 2023 I posted on social media @AidanFX ” LONG/BUY GBPUSD at 1.2683 Stop Loss at 1.2673 Target 1.2703 – 1.2713 area.” BUY Trade Setup 1. RSI indicator and price form a bullish trend continuation divergence pattern. (Black Line) 2. Price breaks above internal structure lower high (Red Line) signalling bearish weakness and […]
-
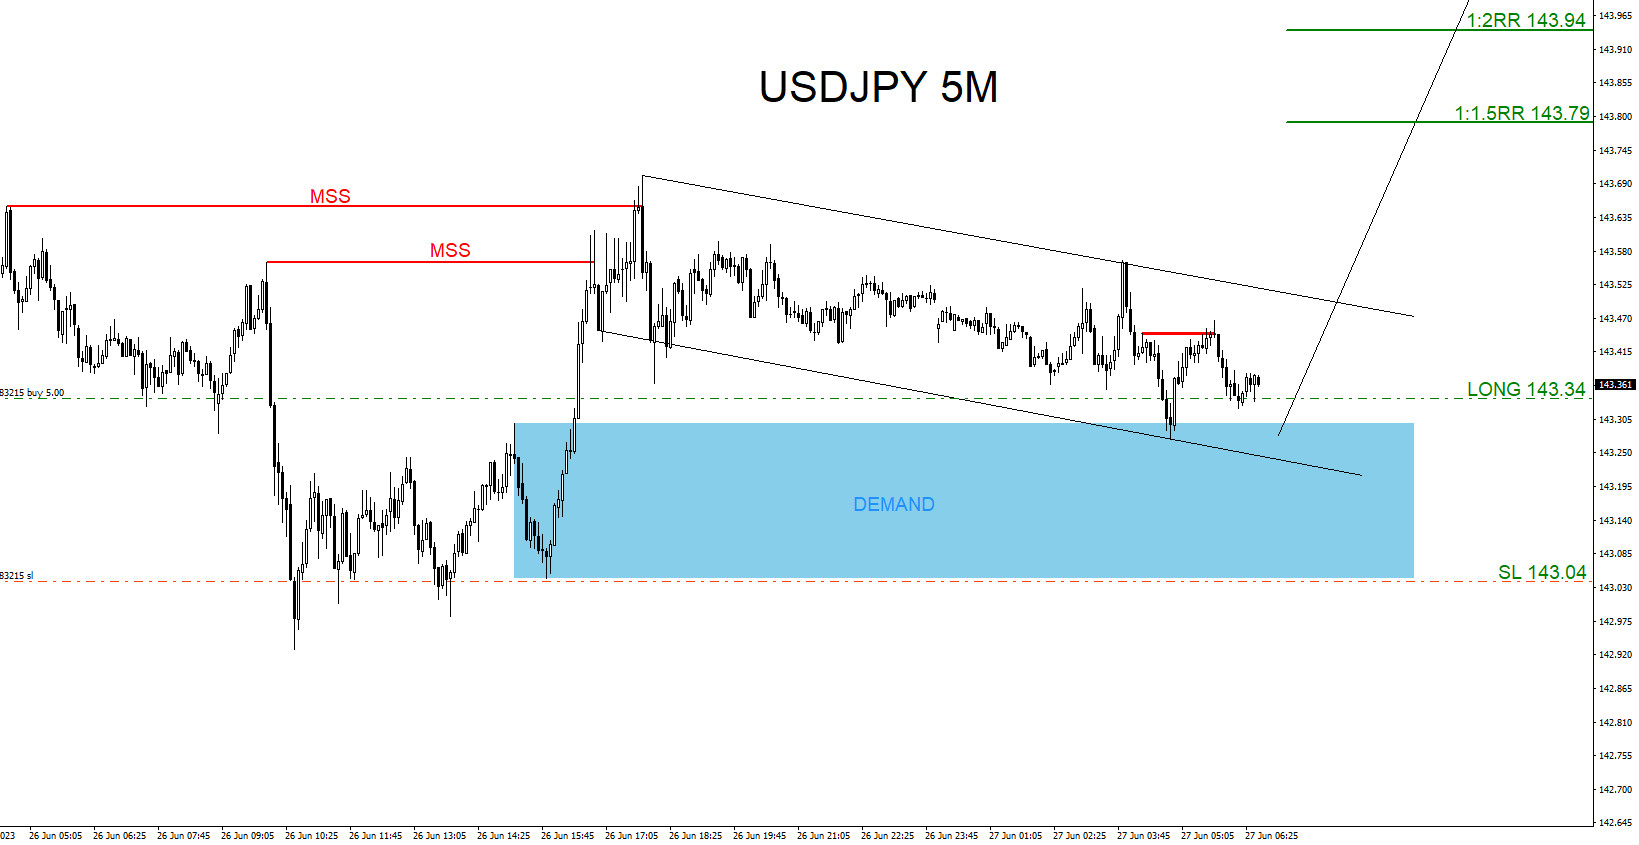
USDJPY : Buy Trade Hits Targets
Read MoreOn June 26 2023 I posted on social media @AidanFX ” USDJPY : Will be watching for buying opportunities against 142.92 low for another move higher towards 144.00.” I also posted on June 26 2023 the buy trade ” USDJPY BUY at 143.34 Stop Loss at 143.04 Target 143.79 – 143.94 area.” Buy Trade Setup […]
-
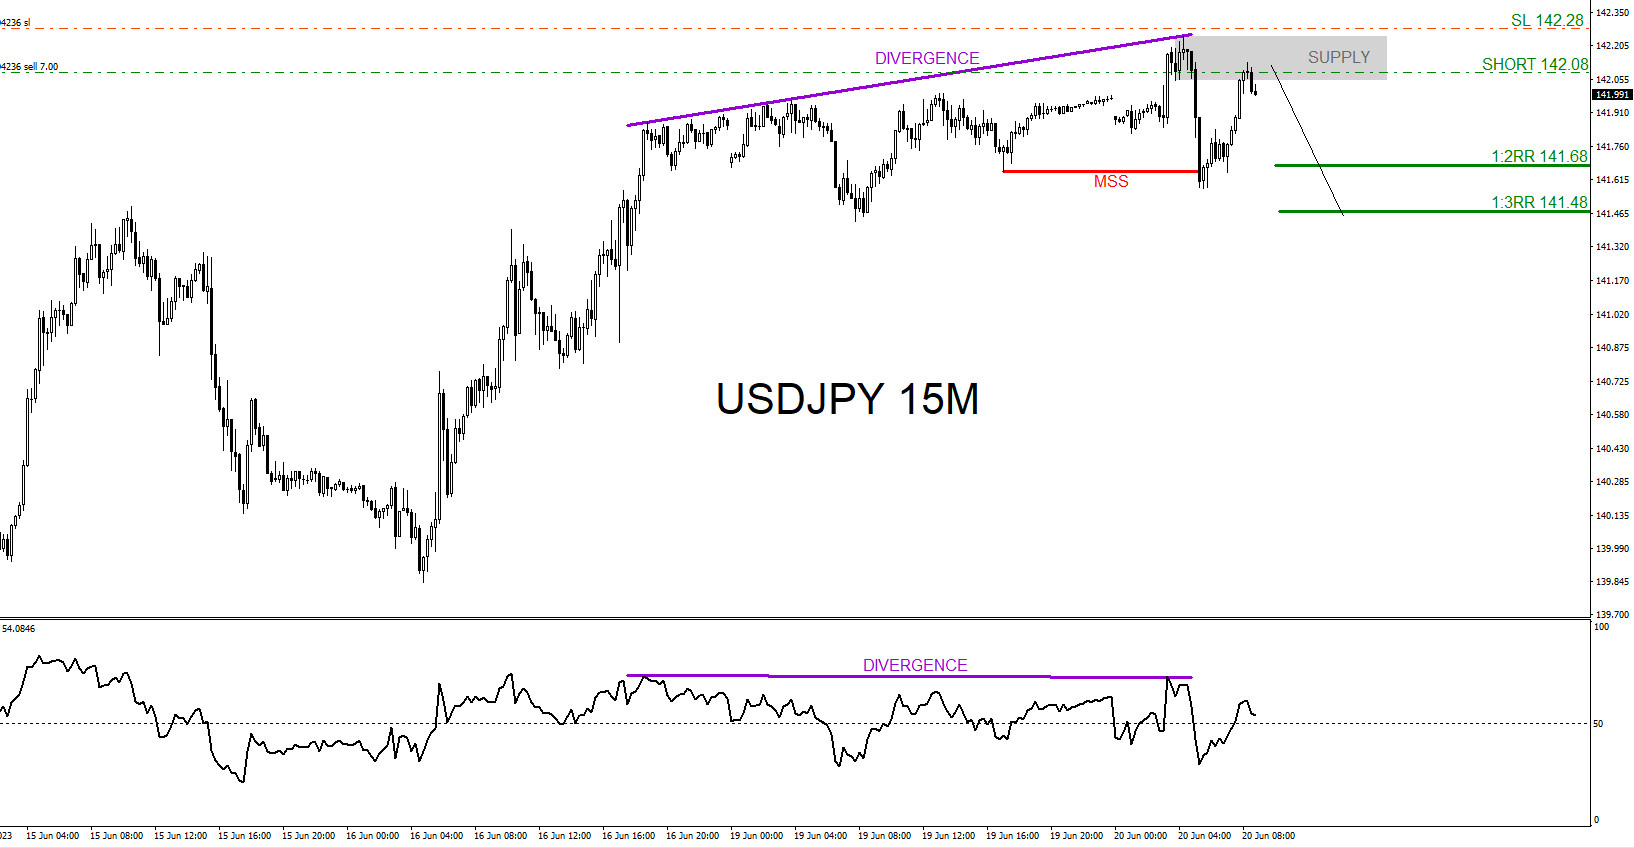
USDJPY : Catching the Move Lower
Read MoreOn June 20 2023 I posted on social media @AidanFX ” USDJPY : For now as long as price stays below 142.25 will be watching for sells for another push lower towards the 141.68 – 141.48 area.” SELL Trade Setup 1. RSI indicator and price form a bearish trend reversal divergence pattern. (Purple Line) 2. […]