
-
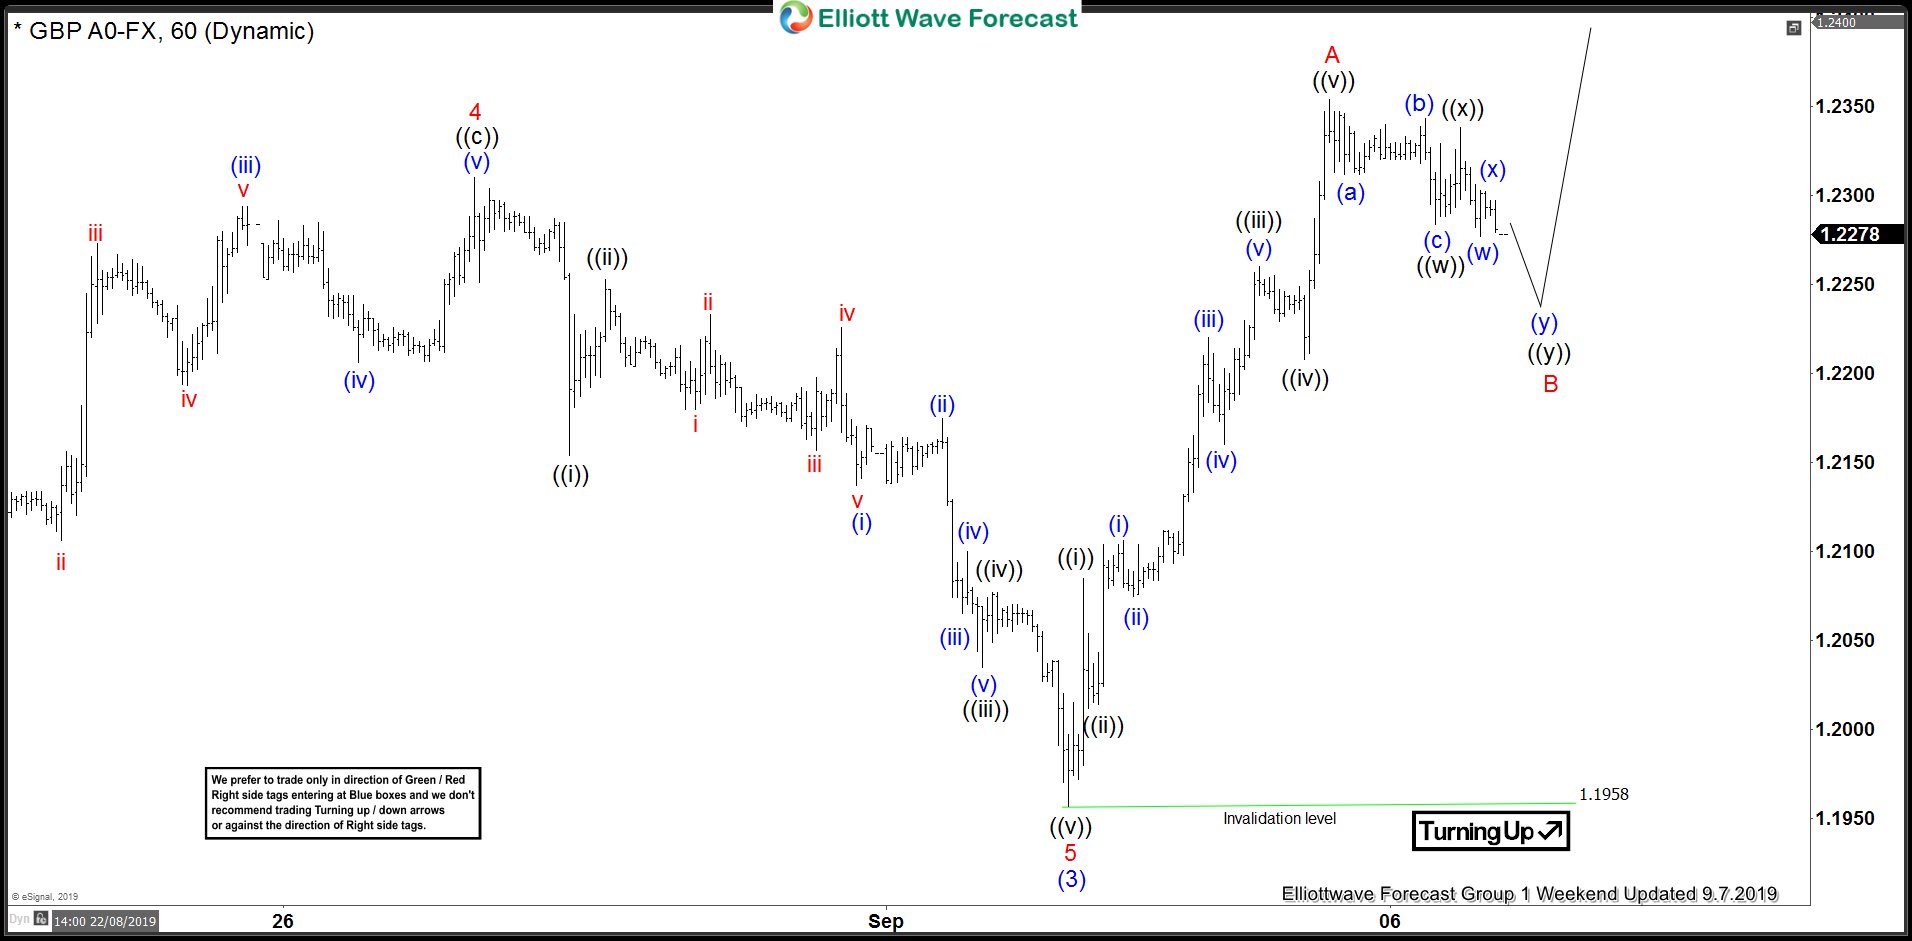
GBPUSD : Trading the Move Higher
Read MoreGBPUSD Technical Analysis Using Elliott Waves to forecast the markets can allow a trader to decide which side to trade. Tracking GBPUSD at the start of the trading week (September 8/2019 – September 13/2019) we saw that there was a possible wave count that was calling the pair to trade higher. Before the start of […]
-

GBPCAD : Bullish Elliott Wave Count + Bullish Market Breakout Patterns
Read MoreGBPCAD Technical Analysis Before the start of the trading week (September 8/2019 – September 13/2019), we at Elliottwave-Forecast advised our clients/members that GBPCAD still had another possible move higher. From our members only area, the chart below shows that we were calling for wave ((b)) to terminate which should then be followed by a move […]
-
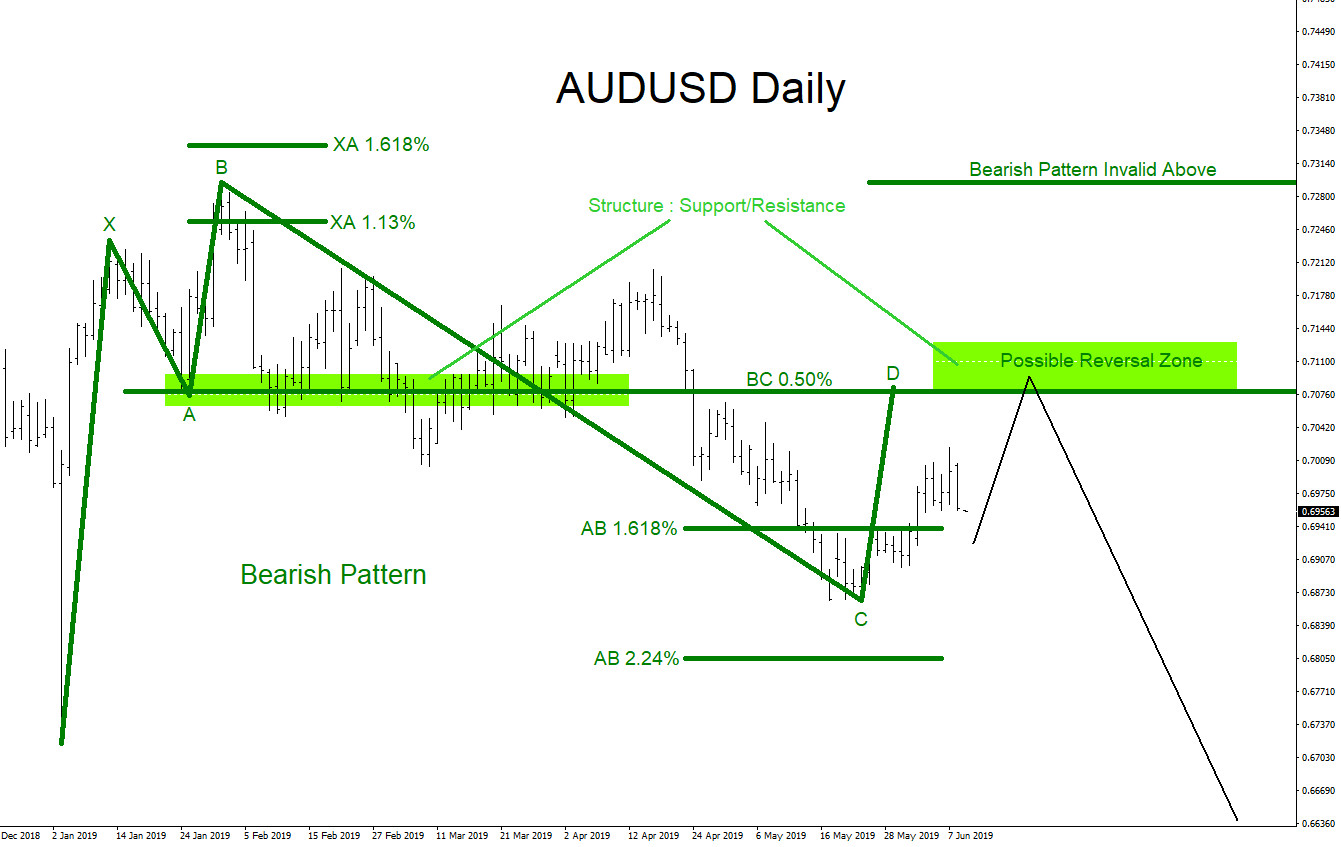
AUDUSD : Calling the Move Lower
Read MoreAUDUSD Technical Analysis AUDUSD: On June 10/2019 I posted on Twitter @AidanFX a possible bearish market pattern. On the Daily chart AUDUSD has been trending lower since 2018 so it would only make sense to follow the trend and continue to look for possible selling opportunities. The chart below shows the possible reversal zone where […]
-
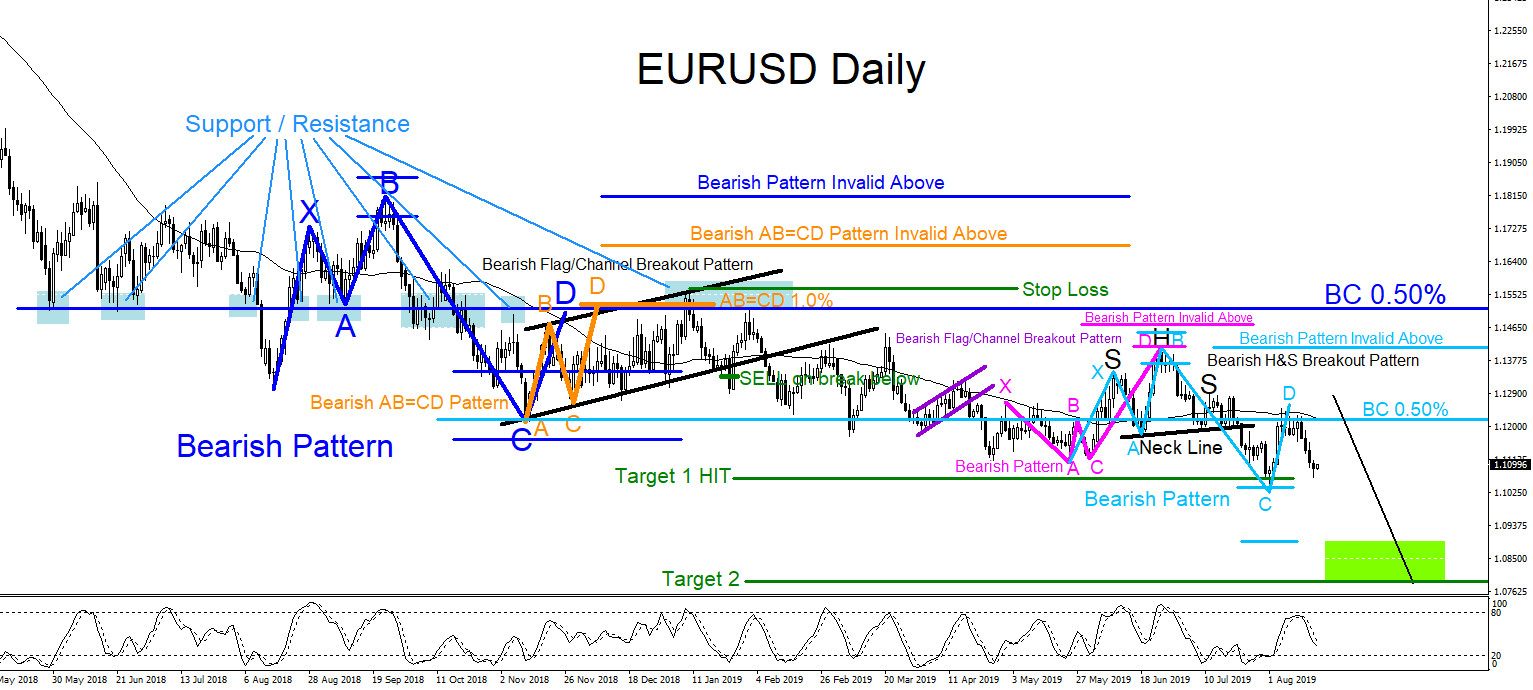
EURUSD : Bearish Market Patterns
Read MoreEURUSD Technical Analysis August 18/2019 In January of 2019 I published the EURUSD SELL breakout trade setup (EURUSD: Will Pair Break Lower) explaining that bearish market patterns were clearly visible and was calling for a move lower towards 1st Target at 1.1060. EURUSD Daily Chart 1.23.2019 Fast forward to August 2019. In the chart below […]
-
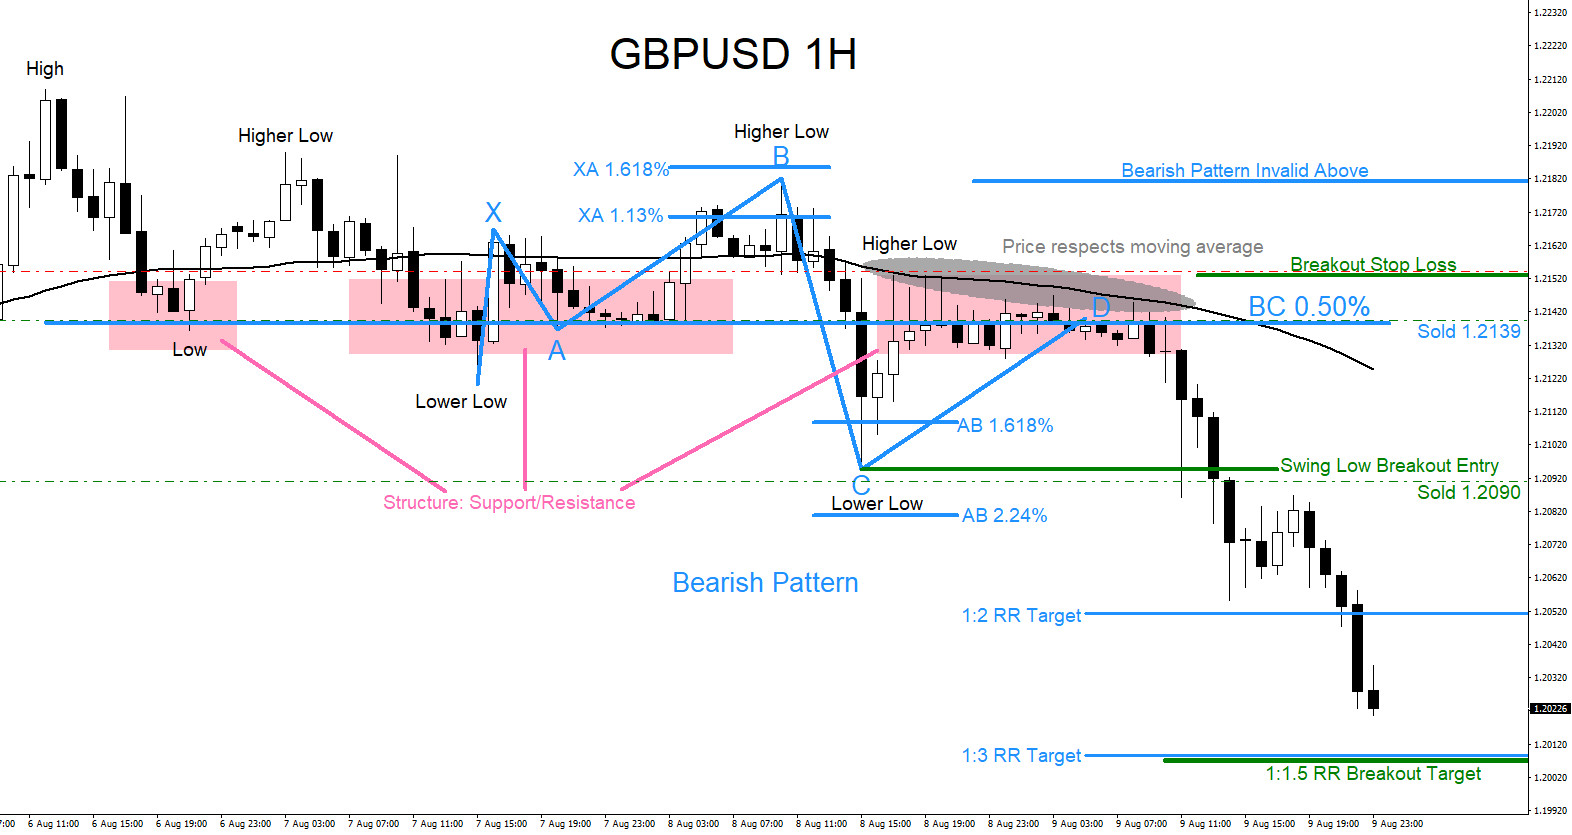
GBPUSD : Calling the Move Lower
Read MoreGBPUSD Technical Analysis Start of the trading week of August 4 – 9 / 2019 EWF members were already advised to watch for GBPUSD to make another move lower. The GBPUSD 1 Hour chart below, from our members area, clearly advises our members to watch for the termination of Wave ((iv)) in the blue box […]
-
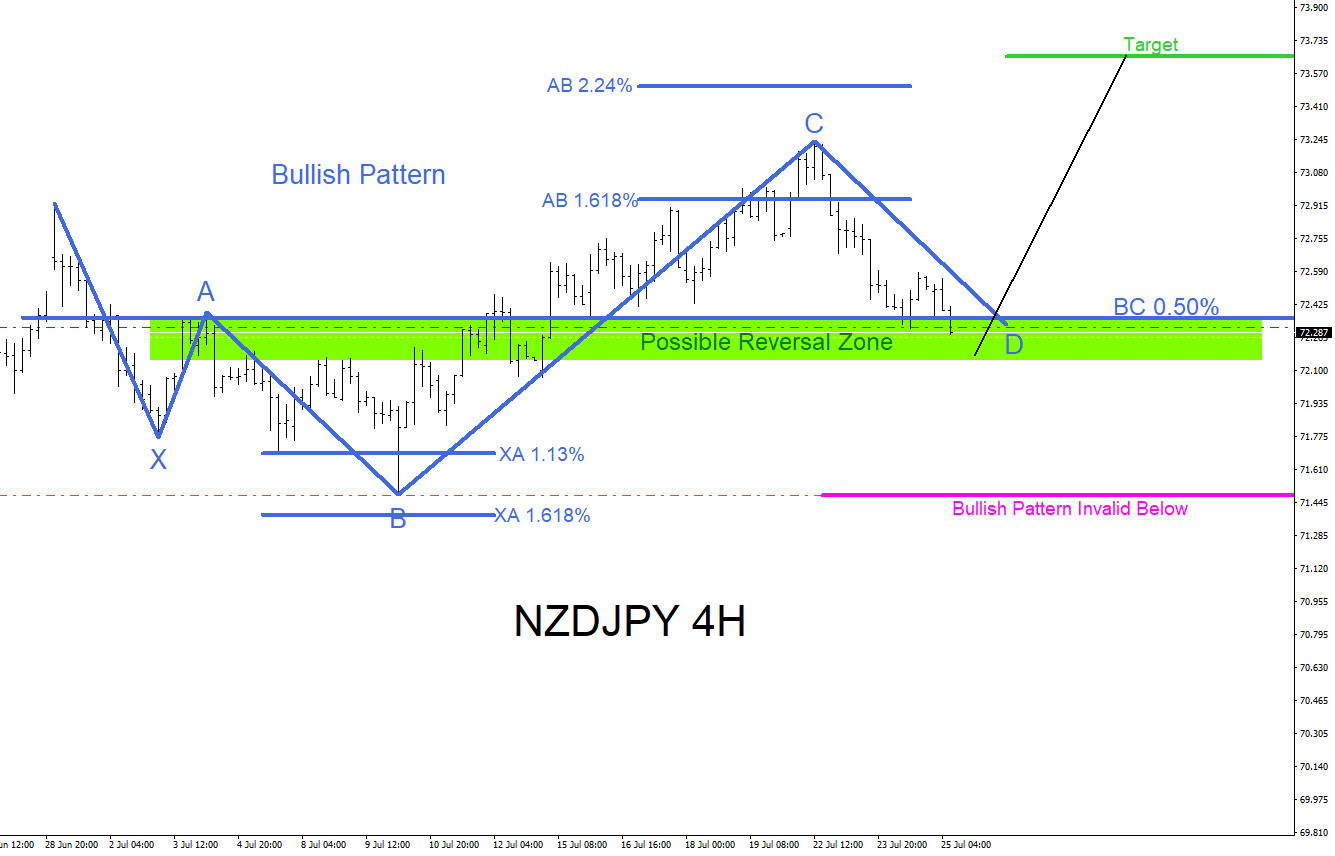
NZDJPY : Watch for Another Push Higher
Read MoreNZDJPY Technical Analysis July 25/2019 NZDJPY has a clear bullish market pattern that has already formed. In the 4 hour chart below the blue bullish market pattern has already triggered buyers to enter the market at the BC 0.50% Fib. retracement level. The BC 0.50% level also aligns with a support/resistance structure (possible reversal zone) […]